 AI insights
 About us
 Careers
 Security
 Customer reviews
 Contact us
 Affiliate program
 Solution partners
 Looker Studio templates
 Tableau templates
 Facebook Ads templates
 Google Ads templates
 Data fields & Metrics
 AI prompt library & Guides
 Product documentation
 API documentation
 Case studies
 Blog
Blog Data models
 Windsor vs Supermetrics
 Windsor vs Fivetran
 Windsor vs Portermetrics
How to use Windsor.ai’s Google Sheets templates
Windsor.ai’s Google Sheets templates are designed to automate your spreadsheet reporting with live analytics data, without writing a single line of code or manual scripts.
How our Google Sheets templates work
All template elements (dashboard and formulas) are pre-built. Simply connect your data to Windsor.ai, and our Google Sheets add-on will automatically replace the sample rows with your own dataset.
Here’s how it works:
- Each tab in the template contains raw sample data for various reporting aspects.
- We’ve already added the necessary formulas, transformations, and logic in each sheet so that your metrics are automatically processed and displayed on the Dashboard tab.
- Once you replace the sample data with real data from Windsor.ai, the Dashboard will update automatically—no extra setup or linking required.
Template components
Each Windsor.ai Google Sheets template consists of several key components designed to streamline your data reporting with a fully automated setup:
Raw data tabs (sheets): They contain sample data with the pre-built formulas to be replaced with your actual data via the Windsor.ai add-on.
Dashboard tab: A visual data representation, which shows updated KPIs, charts, and filters based on your integrated data.
Date range selector: Filter your report by a specific time.
Customizable layout: Adjust visuals and design to fit your branding without changing the data.
Instructions: Find a quick step-by-step setup guidance and tips to help you configure the template correctly.
Step-by-step tutorial to set up a Windsor.ai template
Video tutorial (The LinkedIn Page is used as an example, but the same steps apply to all Windsor.ai templates): https://www.youtube.com/watch?v=zHHku3BzzwU.
Step 1: Connect your data source in Windsor.ai
1. Go to onboard.windsor.ai.
2. Connect your data source and account (from which you want to pull data into the template).
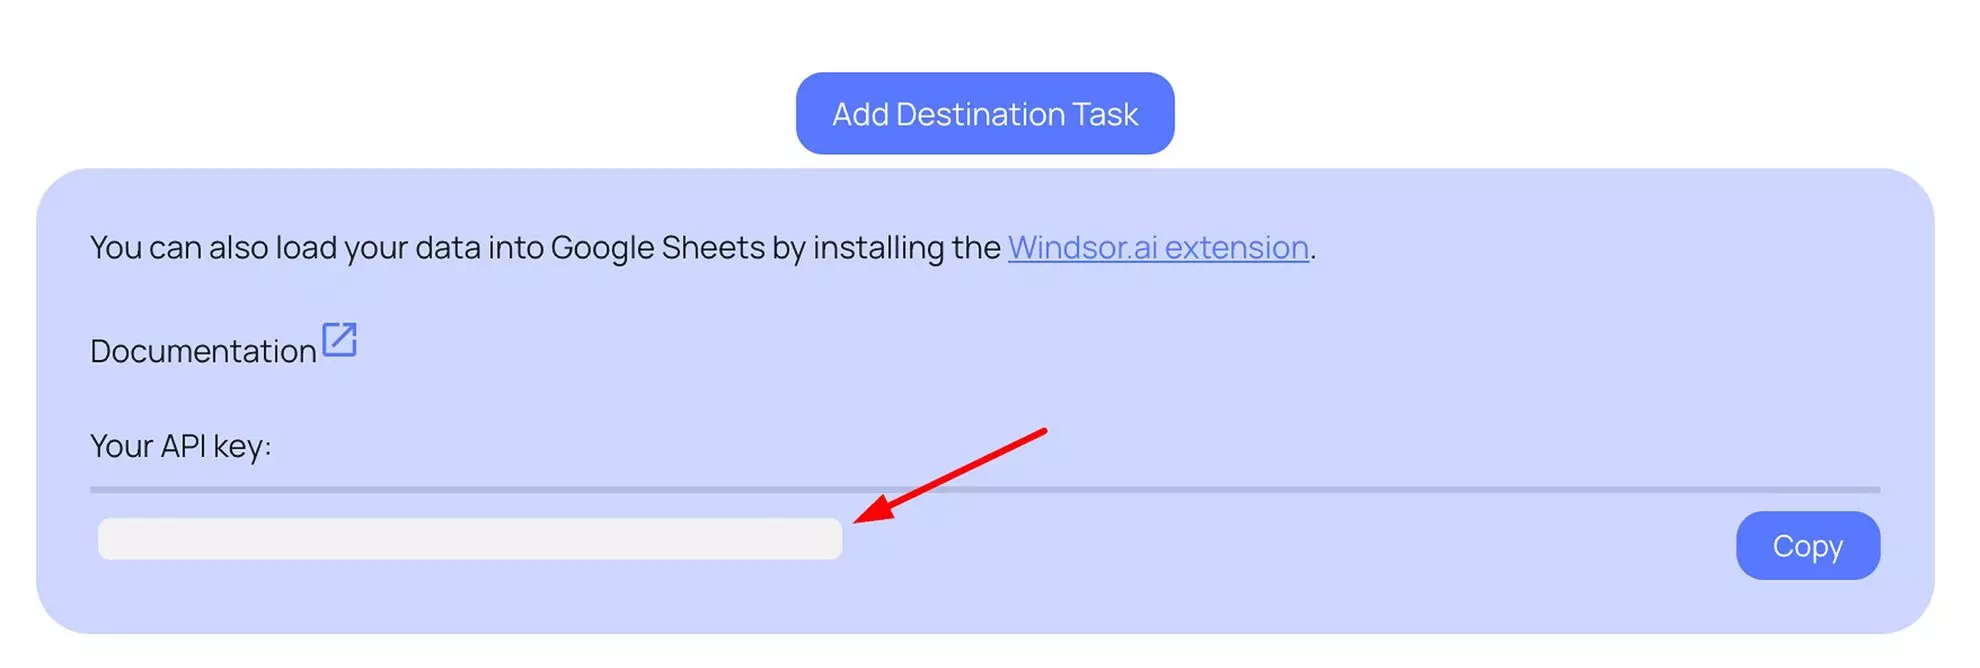
3. Go to the Preview and Destination screen.
4. Choose Google Sheets from the destinations list.
5. Copy your API Key from the instructions below.
Step 2: Prepare the template
Select the necessary template from our library, open it, and make a copy.
Step 3: Set up the Windsor.ai extension in Google Sheets
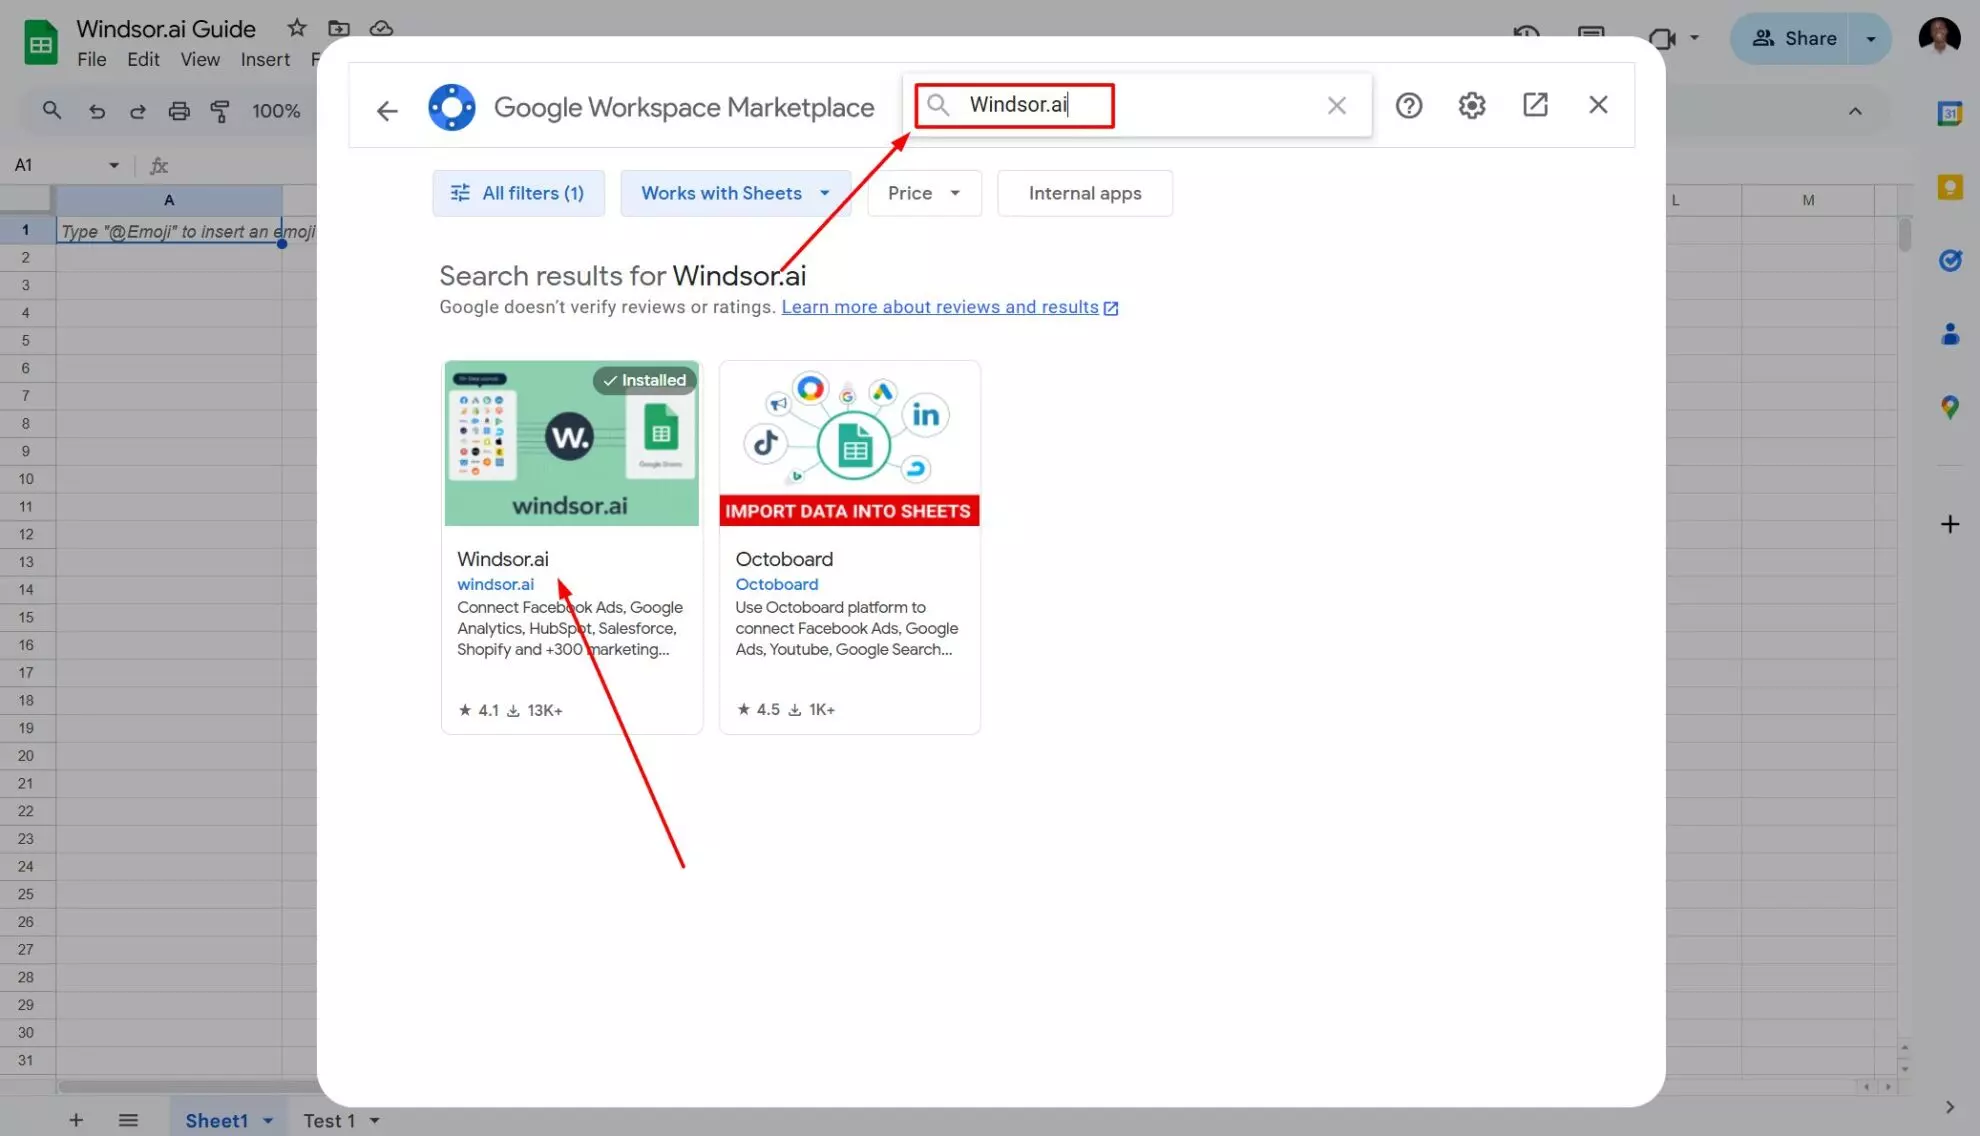
1. Install the Windsor.ai Google Sheets extension (if not installed yet):
- In Google Sheets, go to Extensions -> Add-ons -> Get add-ons.

- Search for Windsor.ai and click Install.
2. Go to Extensions -> Windsor.ai -> Login.
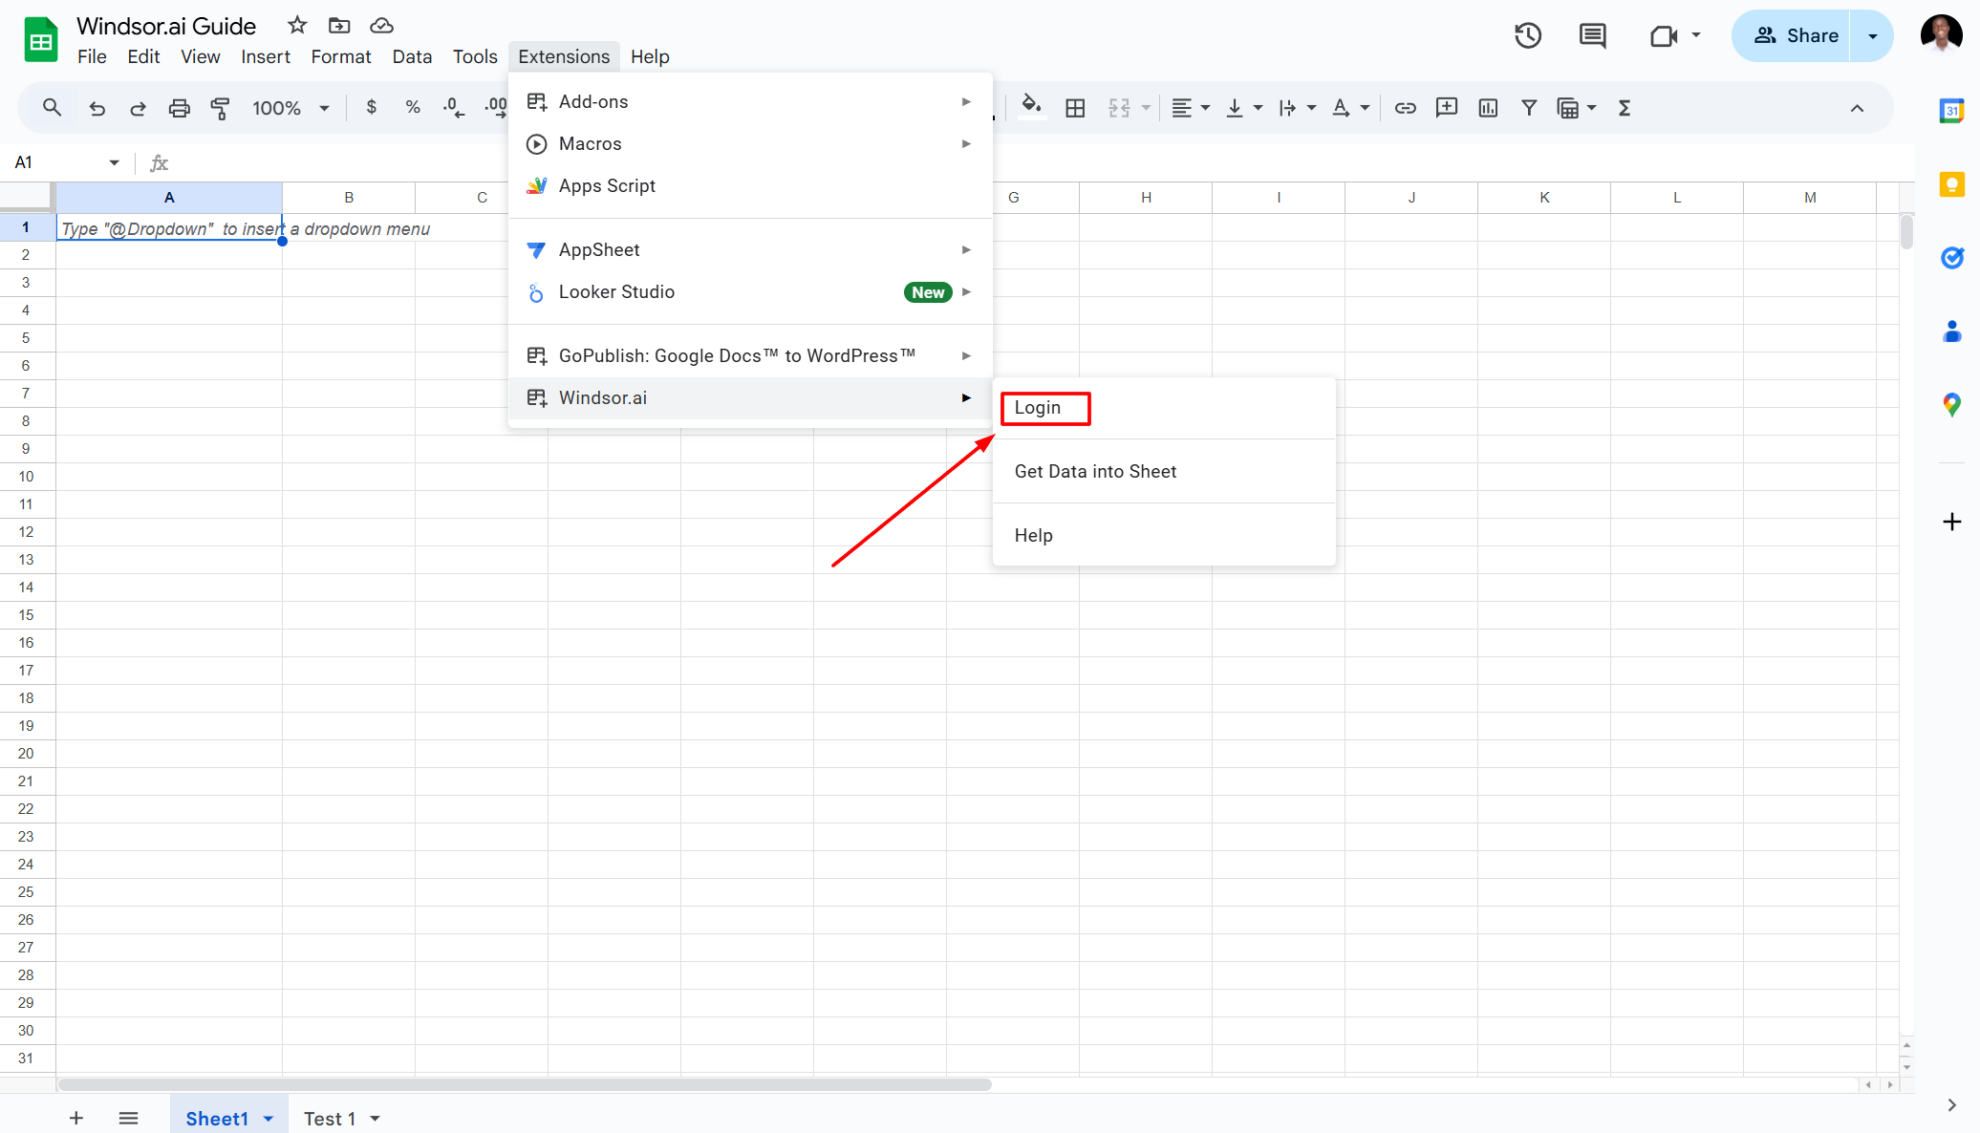
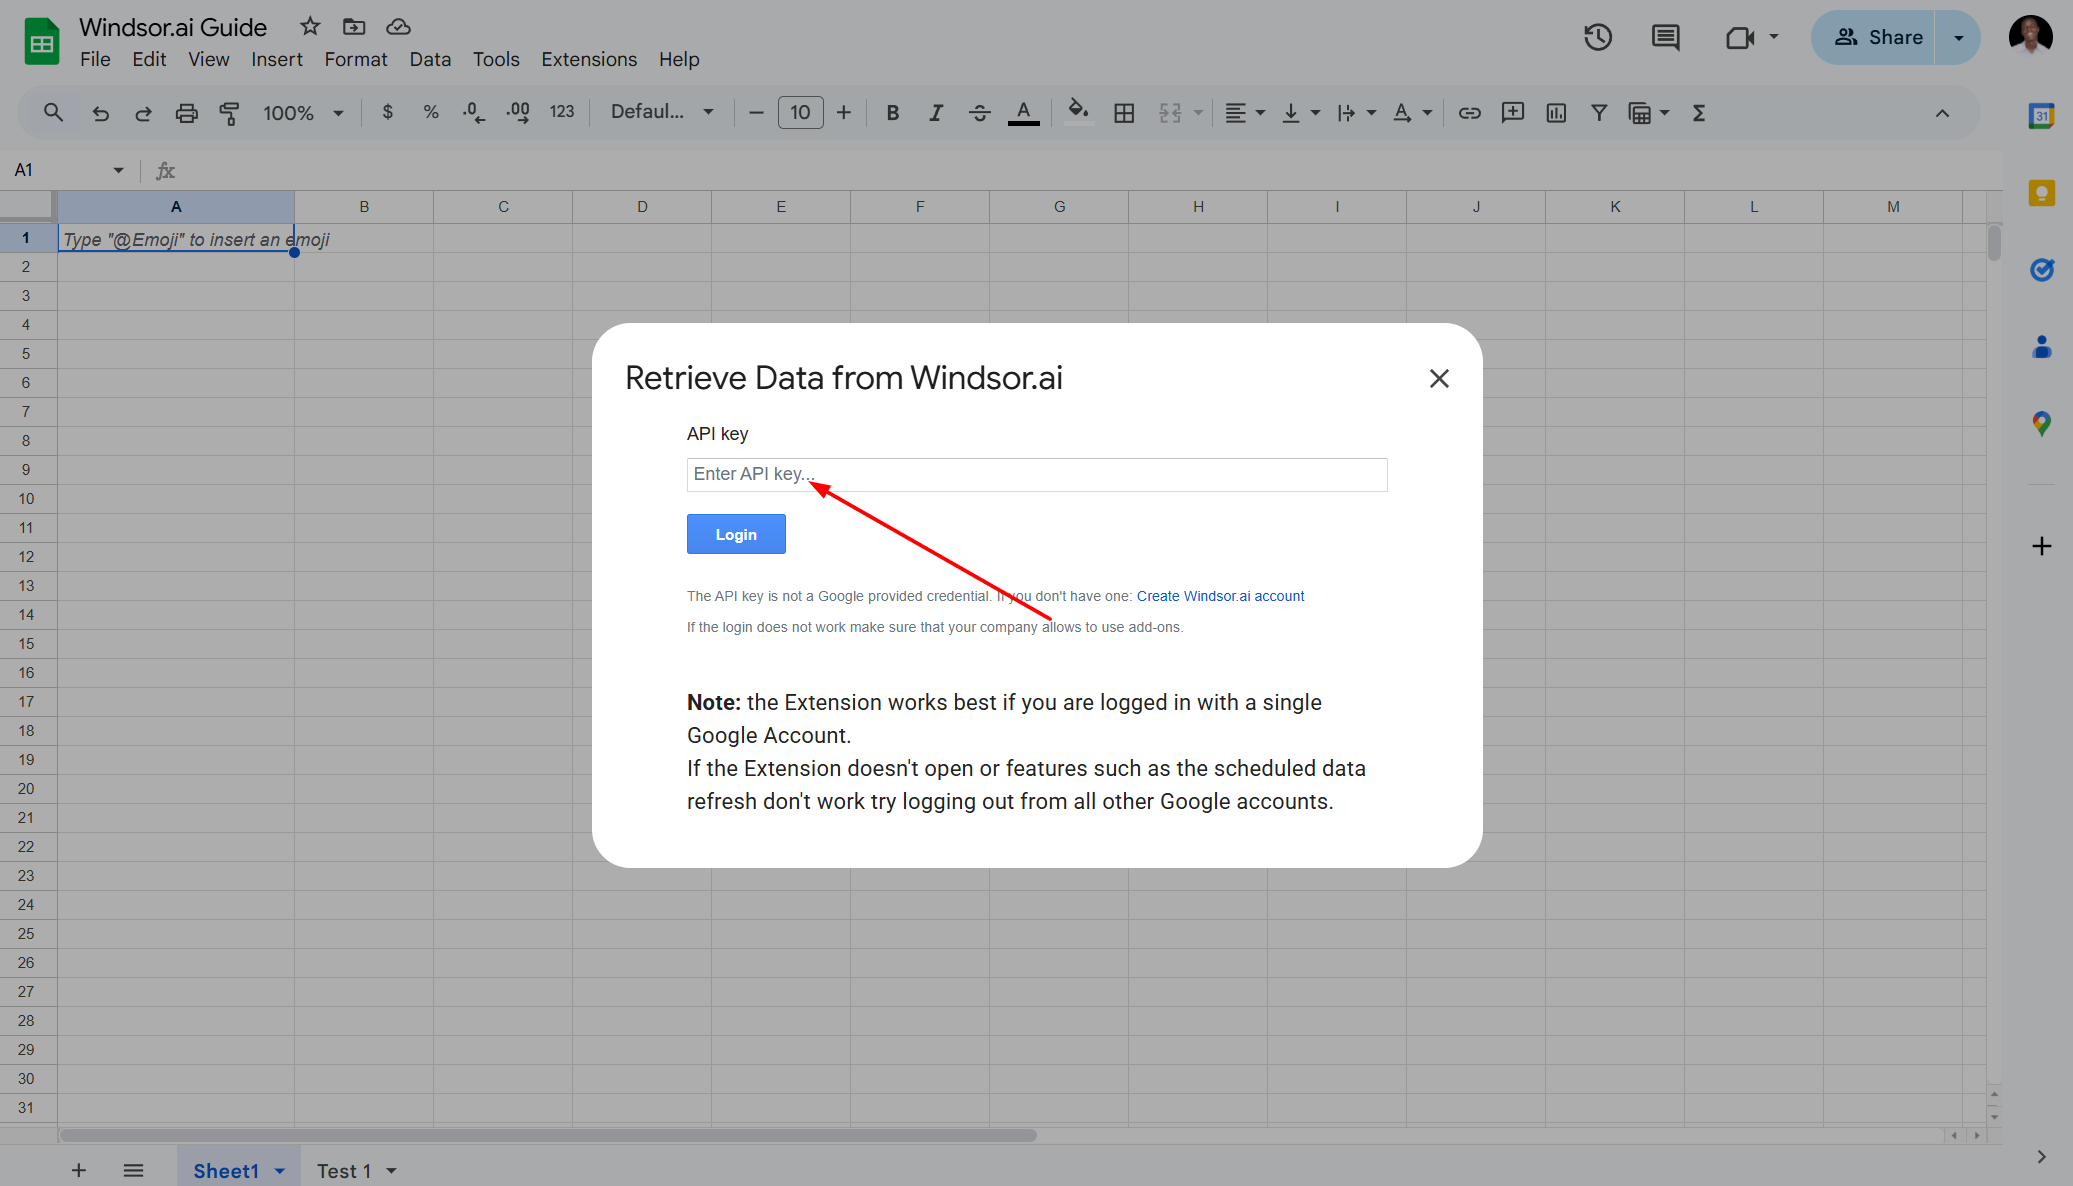
3. Paste the API Key you copied earlier to connect your Windsor.ai account to Google Sheets.
Step 4: Replace sample data in the template
Each data sheet (tab) in the template—like posts, page followers, etc.—has its own predefined list of fields and sample data, which you’ll need to replace with your actual data.
No manual input is needed—just connect your data automatically via the Windsor.ai add-on, by following these simple steps:
📌 Repeat this procedure for every tab that contains raw data (all except for the Dashboard sheet).
1. Open a sheet (tab) in the template (e.g., Top 10). Here you’ll see raw sample data with the prebuilt formulas.
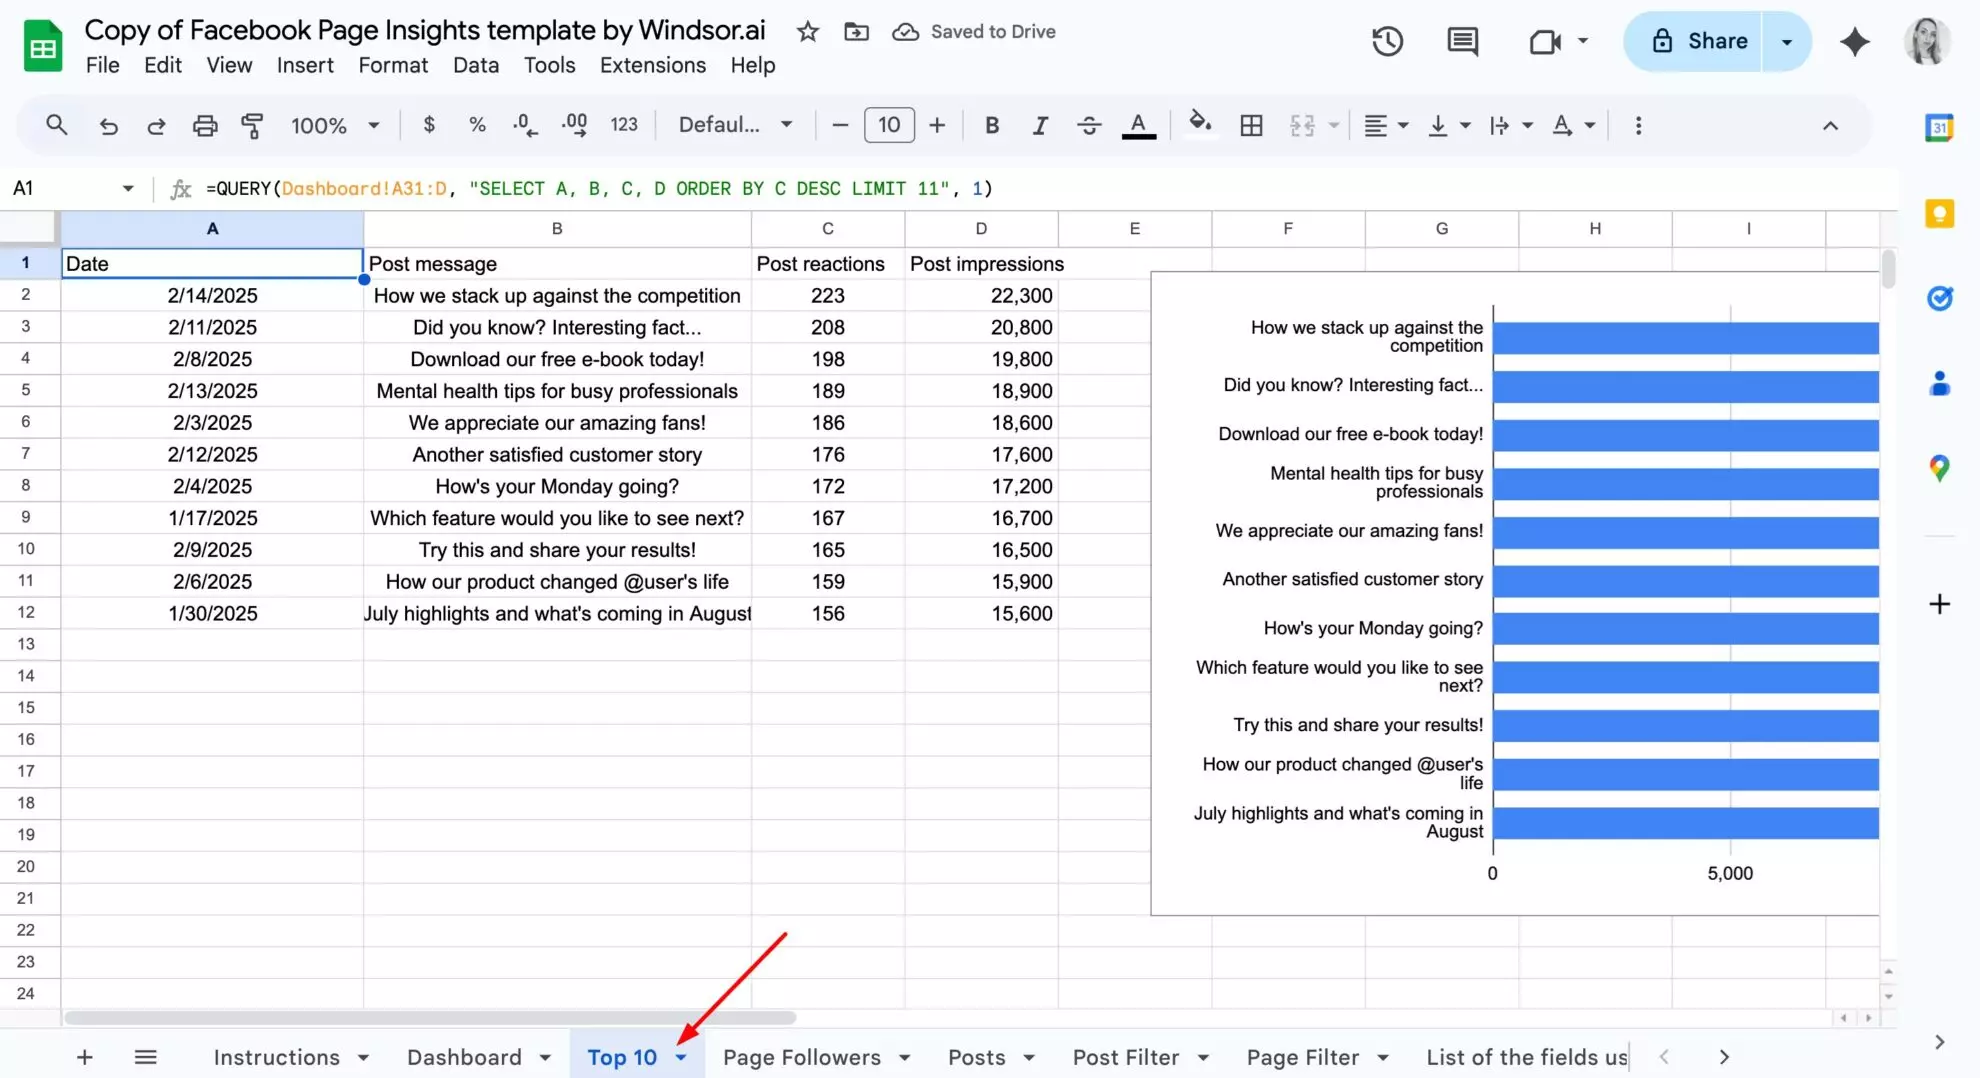
Now, your task is to replace this sample dataset with your real data. No worries, it’s a fully automated process.
2. Make sure you’ve already logged in to the Windsor.ai Google Sheets add-on. Then, go to Extensions -> Windsor.ai -> Get data into sheet.
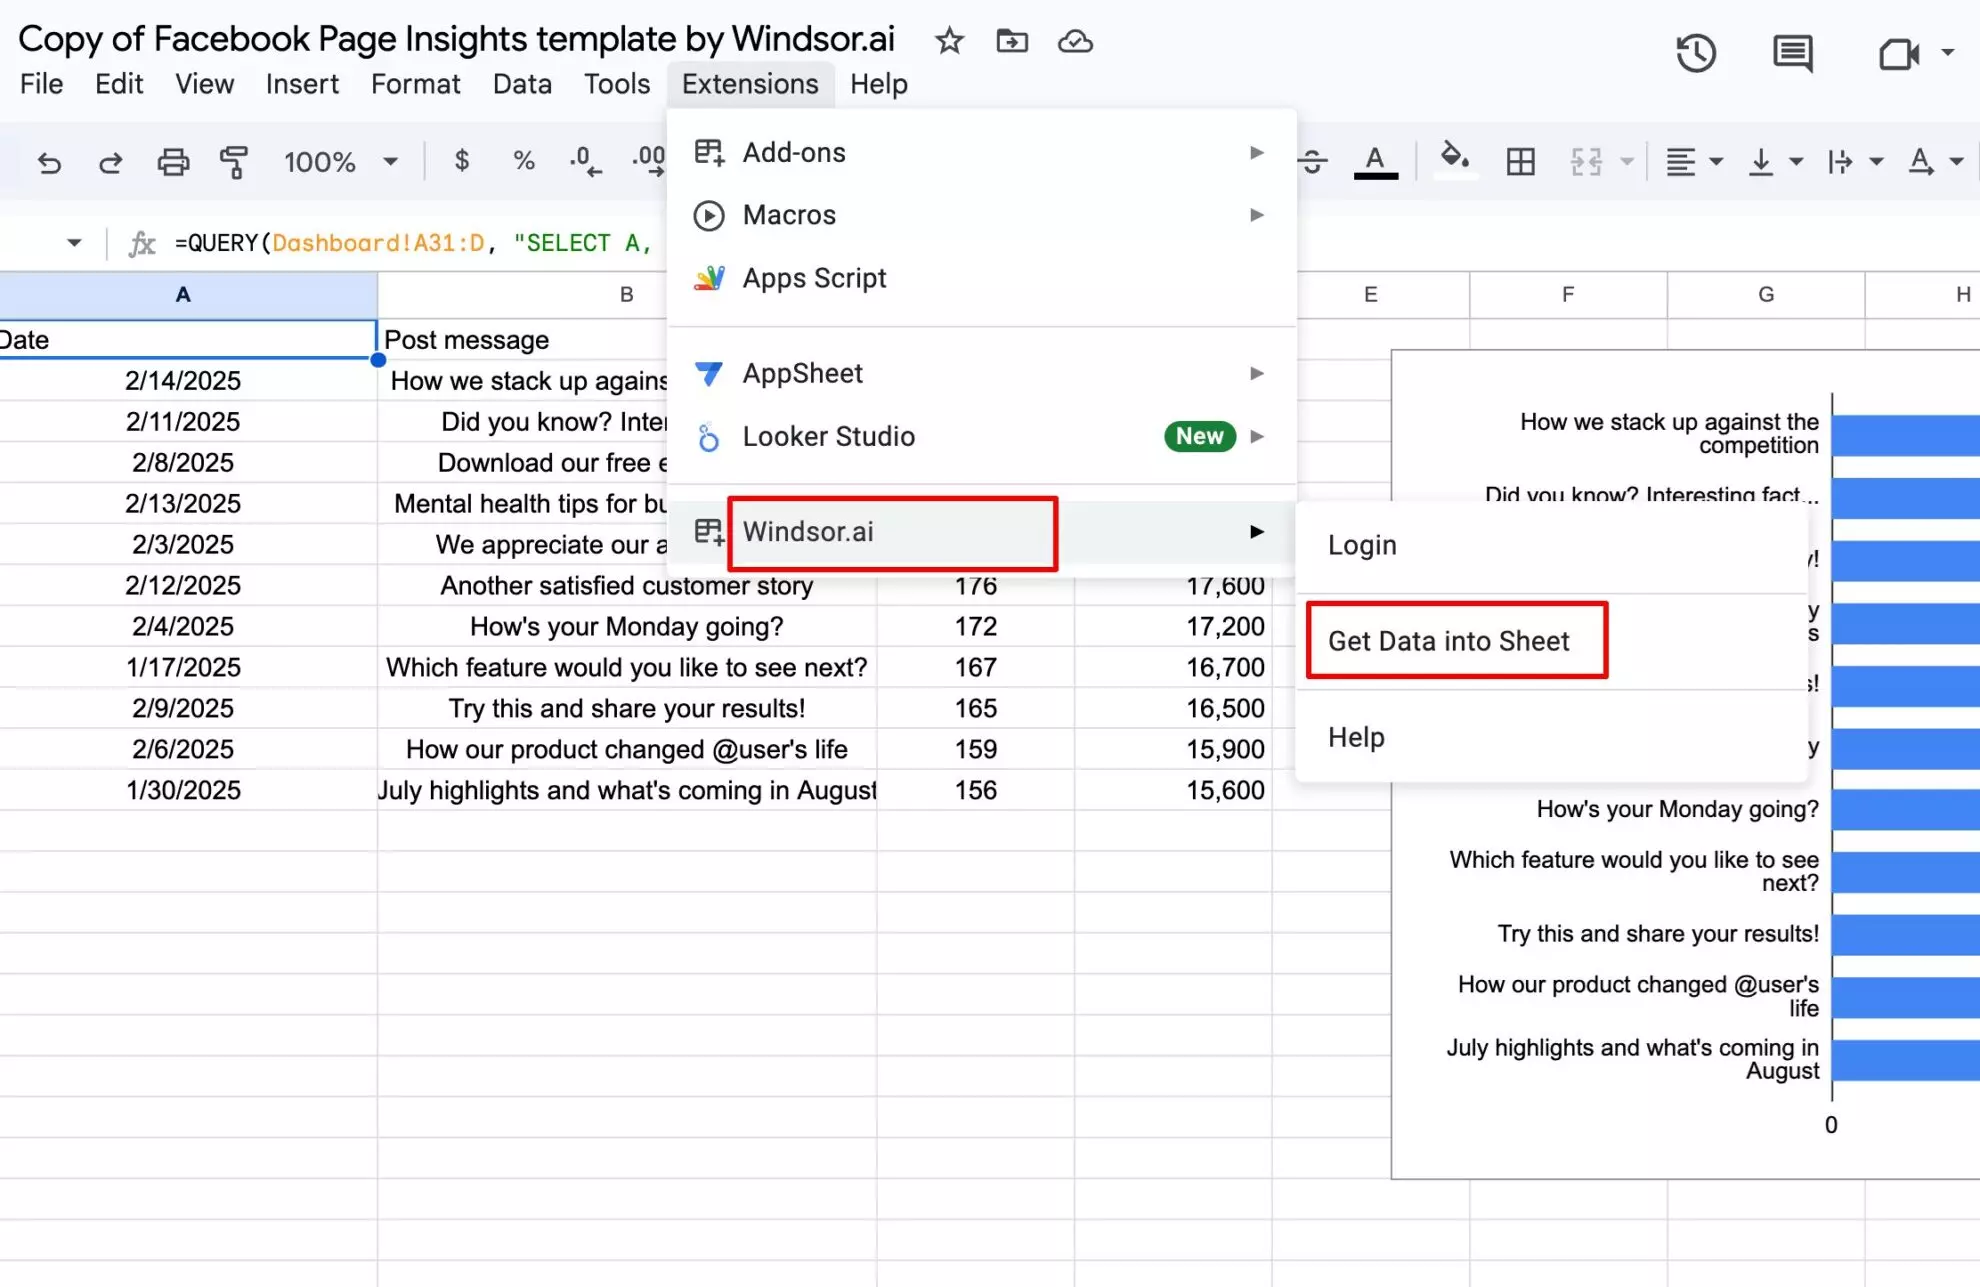
3. In the emerging right-side panel, click the Add new query button.

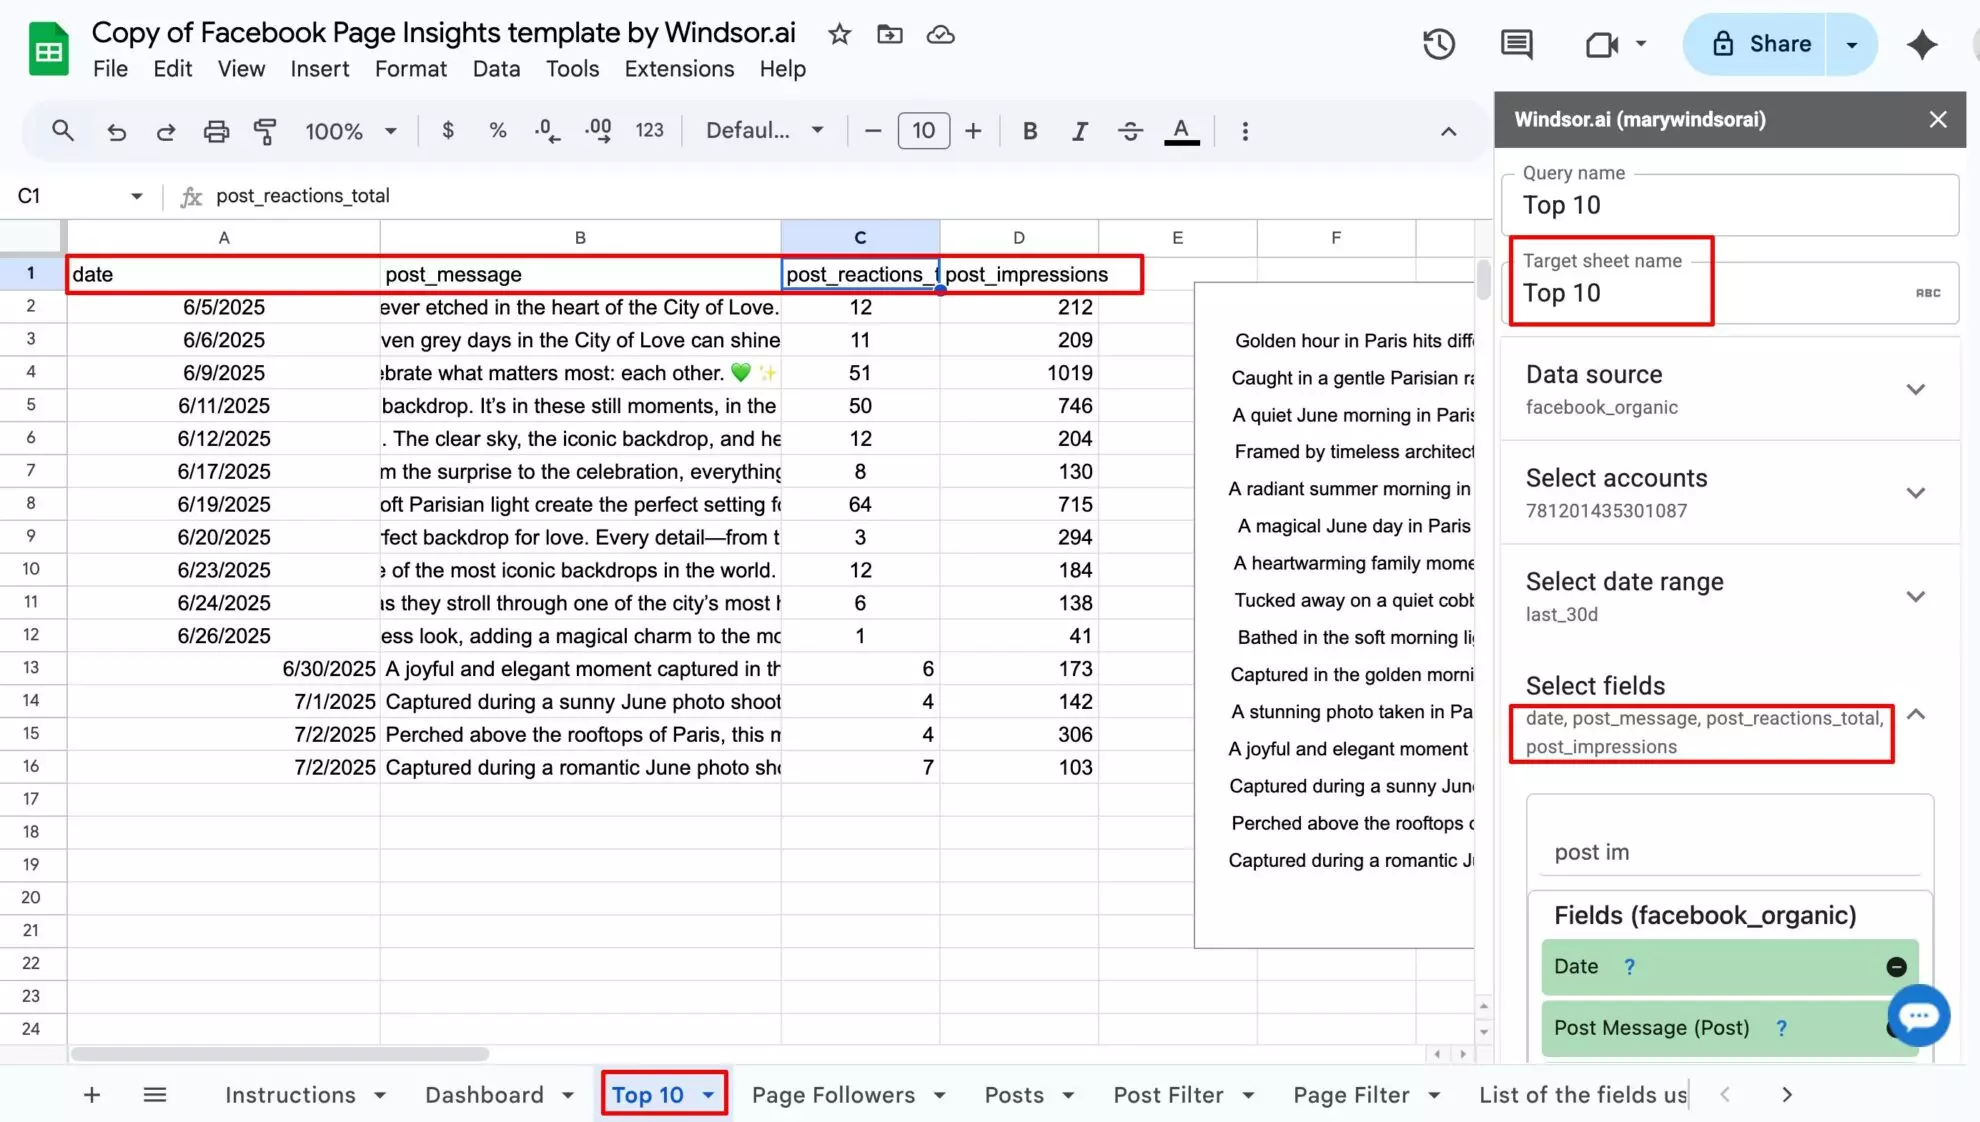
4. Fill in all the required fields:
- Query name: Any as you wish (for your convenience, keep it the same as the sheet name).
- Target sheet: Type the current tab name (to avoid mistakes, just copy-paste the tab name). For example, if you’re on the ‘Top 10’ tab, enter exactly this name in this field.
- Data source: Corresponding with the chosen template, e.g., facebook_organic.
- Account(s): From which you want to pull data.
- Date range: Set your desired reporting range. If the Windsor.ai add-on begins to malfunction or slow down, try selecting a shorter date range. For accounts with large data volumes—such as high-traffic websites or ad accounts with numerous campaigns—we recommend limiting the range to one week.
-
Select fields: Match the exact field names and order already shown in this sheet. Any mismatch may cause the pre-built formulas to work incorrectly, resulting in broken or missing fields in the Dashboard.
For example, if the columns in this sheet are Date, Post message, Post reactions, and Post impressions, select the same fields in the add-on.
- Set refresh frequency (optional): The data in your Dashboard will update automatically based on the schedule you set.
5. Click Save and load data and wait for Windsor.ai to overwrite the sample data with your real, live data.
6. Perform the same flow in the rest of the sheets.
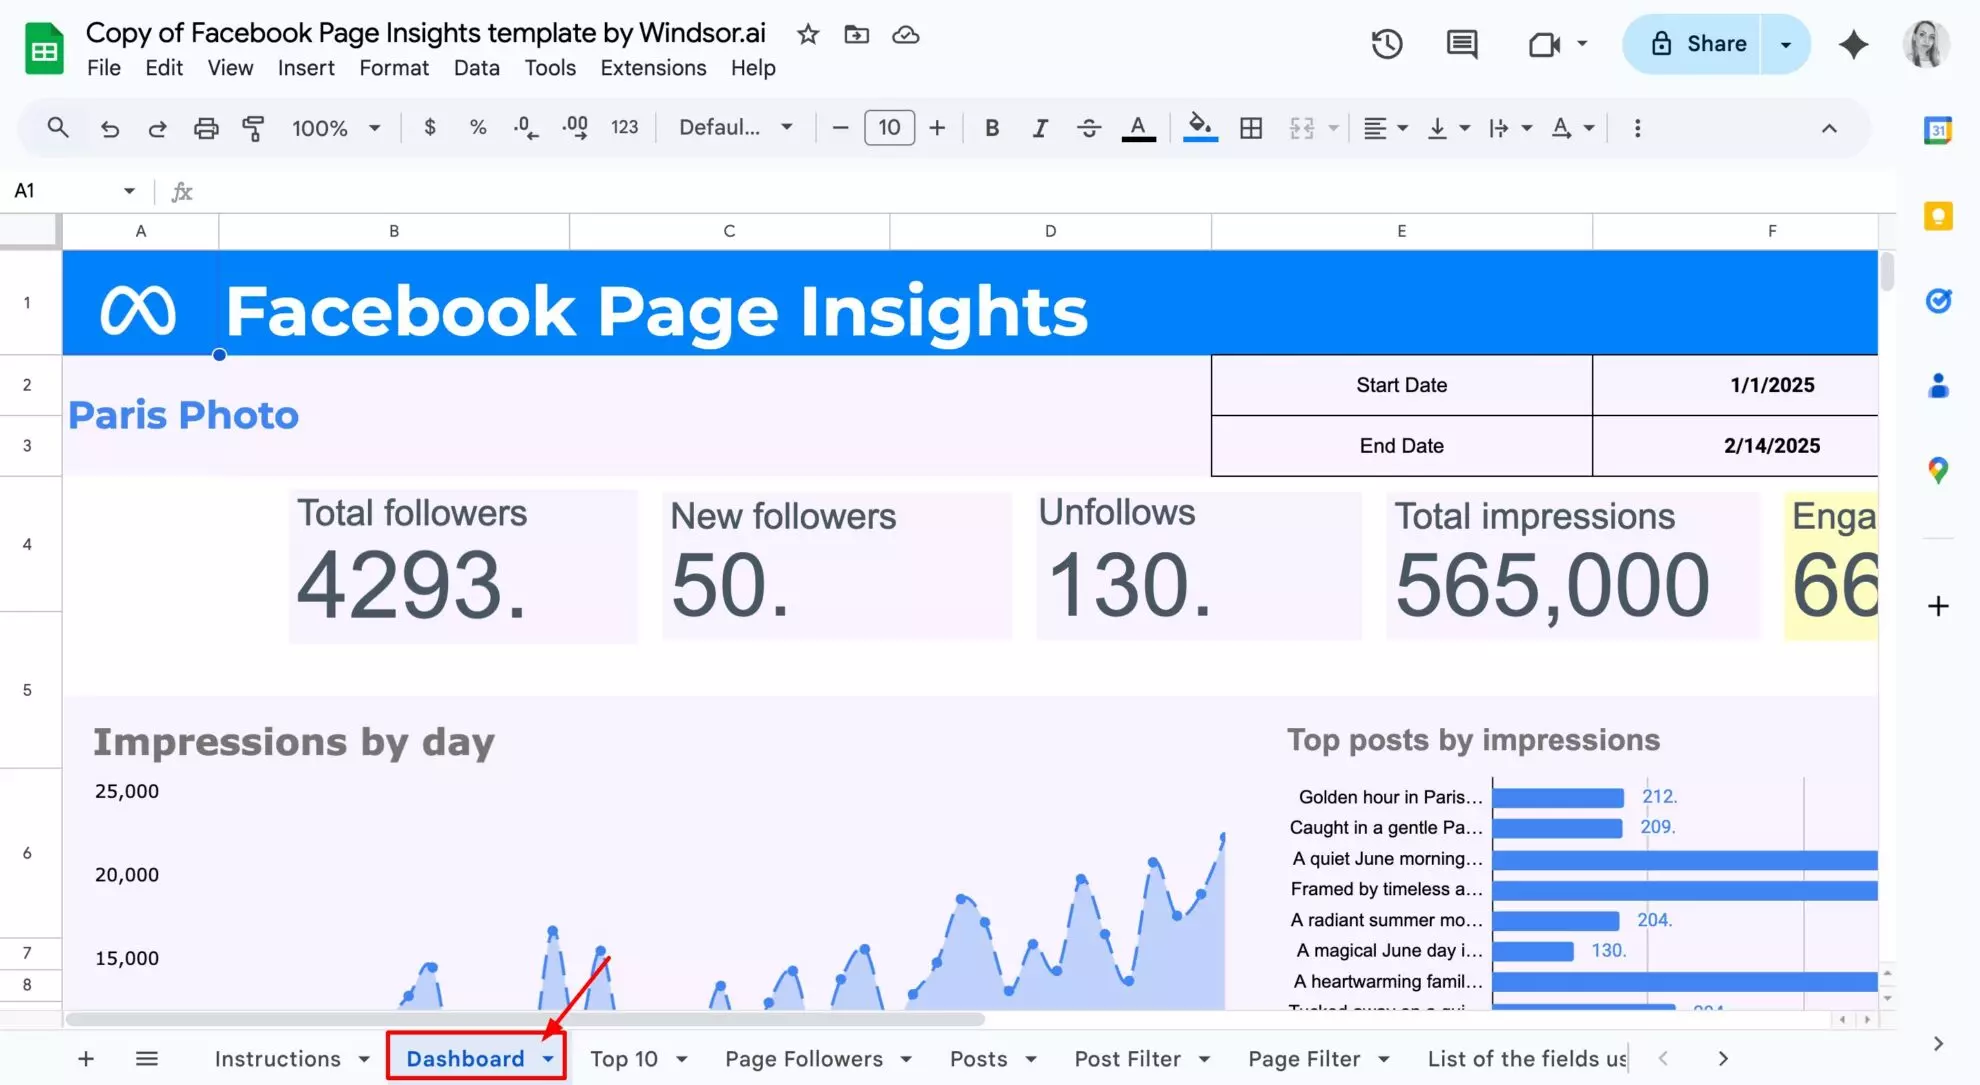
Step 5: Watch your dashboard update automatically
Once your real data is loaded into all raw data tabs, go to the Dashboard tab to confirm that your data has been automatically updated.
All charts, filters, KPIs, and summaries will now reflect your connected data—no need to adjust formulas or connect anything manually.
Step 6: Customize & refresh
Use the dropdowns on the Dashboard tab to set your start and end dates.
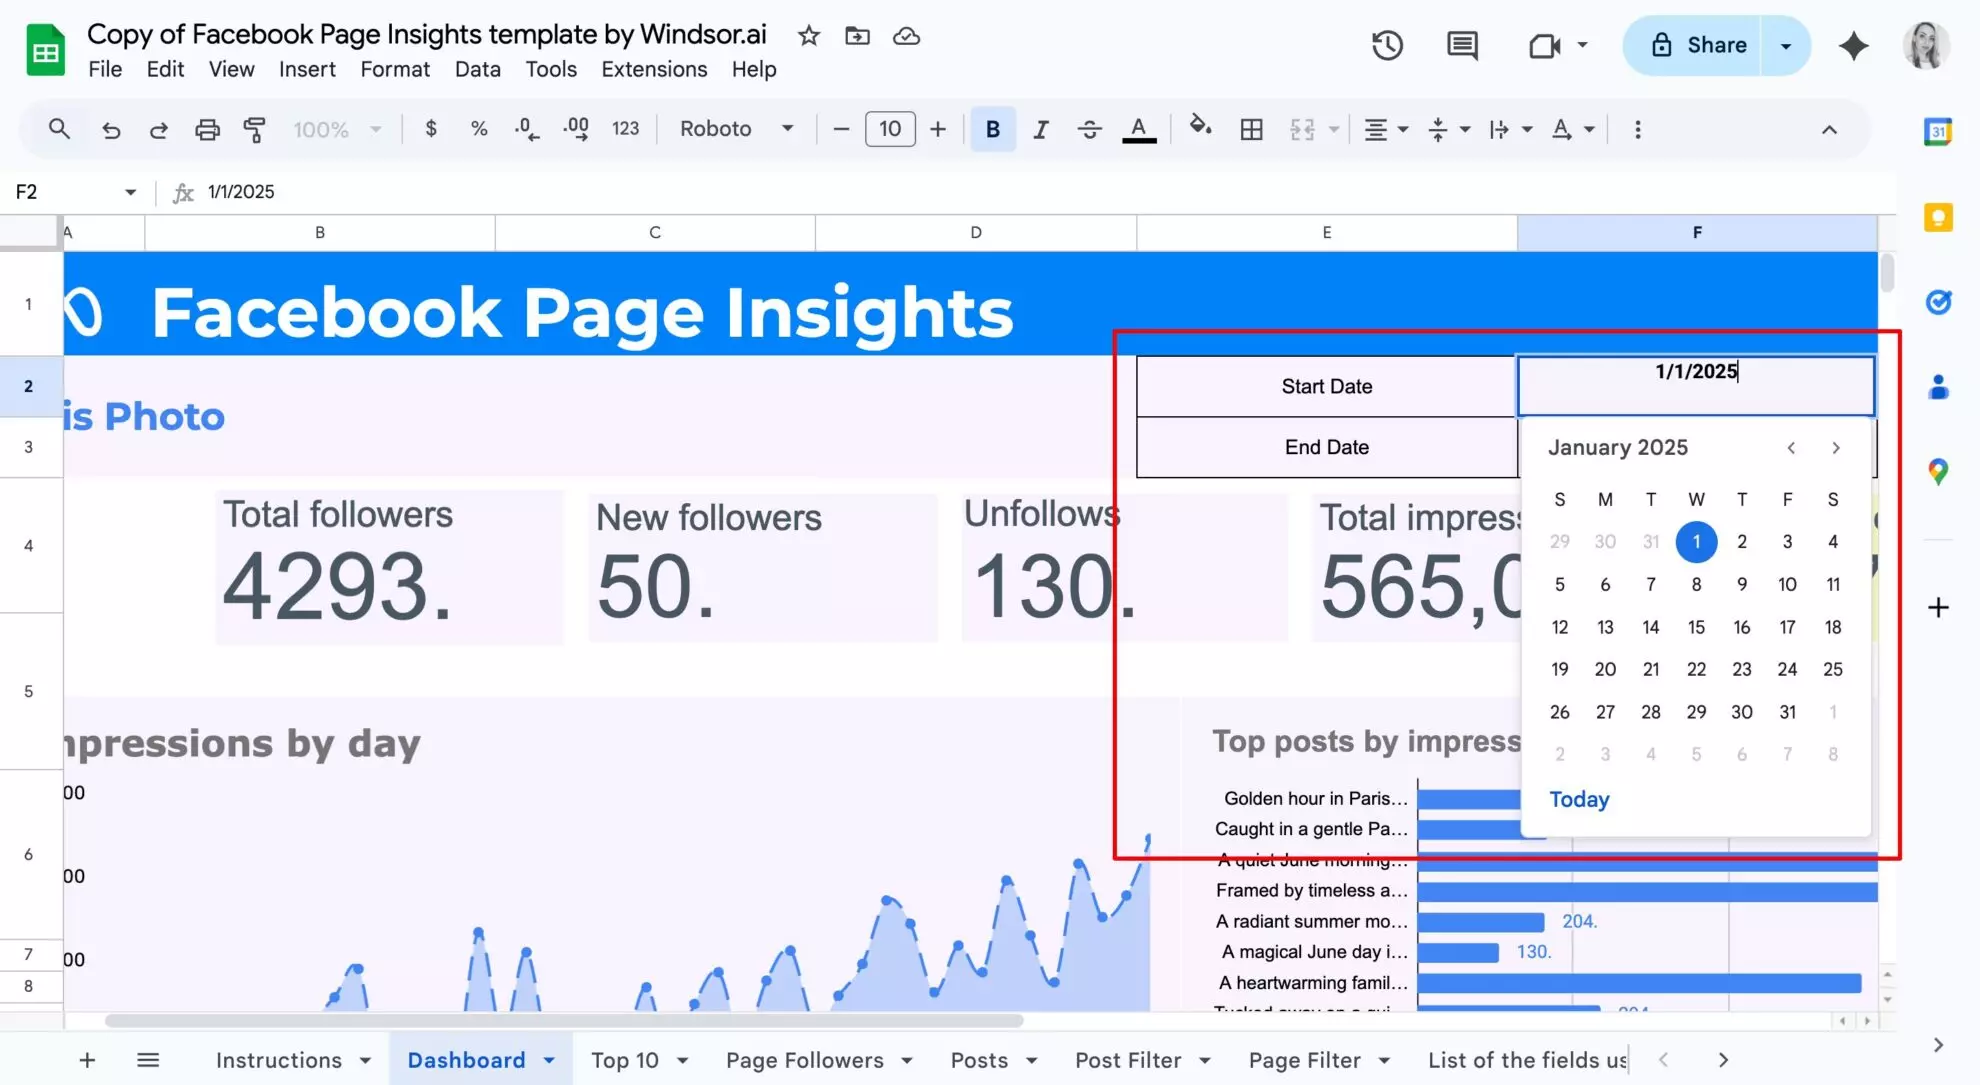
Important: The Dashboard only displays data for the date range selected via the dropdowns. Make sure the same date range is used in the Windsor query panel to avoid empty charts.
You can also customize visuals and layout, and modify formulas to match your reporting needs and branding.
Important to remember
- Each tab in the template works independently—be sure to configure a Windsor.ai query for each one.
- Always match the field names and order exactly when selecting fields in Windsor.ai.
- Don’t delete existing columns or formulas in the Dashboard or raw tabs to ensure report consistency.
- To avoid empty charts, make sure the Dashboard date range doesn’t extend beyond the date range set in your Windsor query.
FAQs
Can I rename the sheets?
Yes, but be careful. The formulas in the Dashboard rely on specific sheet names. If you rename a sheet, make sure to update any formulas or queries referencing it.
What if I select more fields or change their order?
The Dashboard is built to expect specific fields in a specific order. Changing field order or adding extra fields may break formulas or charts. Always match the field names and order shown in each sheet.
My Dashboard is blank (entirely or partially)—why?
Most likely, the date range in the Dashboard is outside the date range you selected in your Windsor.ai query. Make sure they match.
Can I add more data sources?
Yes! Windsor.ai supports blended data from 325+ platforms. Just create a new tab, configure a query for other sources, and integrate the data into your dashboard manually.
Can I schedule data to update automatically?
Yes. In the Windsor.ai extension panel, you can set up a scheduled refresh so your reports update hourly, daily, or weekly without manual input.
Will modifying the dashboard affect the raw data?
No. The Dashboard pulls from the raw data sheets using formulas—it’s a one-way flow. You’re free to edit visuals, layout, and formatting without affecting the source data.
Is my data secure in Google Sheets?
Yes. Windsor.ai only accesses the data sources you’ve explicitly connected and writes data into your sheet using secure APIs. You retain full control over your sheet and account.
What if I only update some sheets with real data?
Only those updated sheets will reflect accurate data. The Dashboard might show incomplete results if some source sheets remain as sample data.
Tired of juggling fragmented data? Get started with Windsor.ai today to create a single source of truth

