 Destinations
 Data sources
 AI insights
 About us
 Careers
 Security
 Customer reviews
 Contact us
 Affiliate program
 Solution partners
 Template gallery
 Looker Studio templates
 Power BI templates
 Excel templates
 Google Sheets templates
 Tableau templates
 Facebook Ads templates
 Google Ads templates
 Data fields & Metrics
 AI prompt library & Guides
 Product documentation
 API documentation
 Case studies
 Blog
Blog Data models
 Windsor vs Supermetrics
 Windsor vs Funnel.io
 Windsor vs Fivetran
 Windsor vs Rivery
 Windsor vs Portermetrics
 Windsor vs Coupler.io
Connect AppsFlyer to Claude
Automatically sync your AppsFlyer data to Claude using the Windsor.ai connector.
Analyze AppsFlyer data in Claude to uncover wasted spend, spot attribution gaps, and turn insights into powerful growth strategies.
Forget CSVs. Stop copy/paste. Connect data in minutes. No code required.
 Sign up with Google
 Free forever plan
No credit card needed
Free forever plan
No credit card needed










Make the most out of your data with AppsFlyer data in Claude
Instantly surface patterns, optimize campaigns, and uncover growth opportunities with AppsFlyer data in Claude. Discover key benefits and use cases of this integration:

Audit partner traffic quality
Claude compares af_prt (Partner) against loyal_users to determine which agencies are delivering long-term value versus ’empty’ installs. This allows you to identify if a specific partner is driving high volume but failing to acquire users who actually stay active.

Identify high-intent registration sources
By analyzing the ratio of af_complete_registration to total installs per campaign, Claude pinpoints which ads attract users ready to sign up. You can then rewrite copy for lower-performing campaigns to better align with the onboarding journey.

Optimize in-app purchase funnels
Claude tracks the drop-off between af_initiated_checkout and af_purchase across different device_models. It can identify if a specific phone type has a significantly lower conversion rate, suggesting a technical bug or UI friction on those devices.

Get insights in seconds
Skip dashboards and manual analysis; Claude instantly interprets your AppsFlyer metrics, turning installs, cost, revenue, and in-app events into clear KPI summaries, performance reports, and actionable insights you can use right away.
Using Windsor.ai to connect data from AppsFlyer to Claude
Integrating AppsFlyer with Claude often requires manual exports, data cleanup, or complex API scripts. Windsor MCP removes this friction with a connector that automatically pulls, cleans, and sends your AppsFlyer data directly into Claude.
Connect in minutes and get AI-powered insights into your mobile marketing performance.















How to connect AppsFlyer to Claude with Windsor.ai
Explore our video tutorial and a step-by-step guide to integrate your data from any source into Claude with the Windsor.ai connector.
Select your data source
Choose AppsFlyer as your data source and grant access to Windsor.ai.
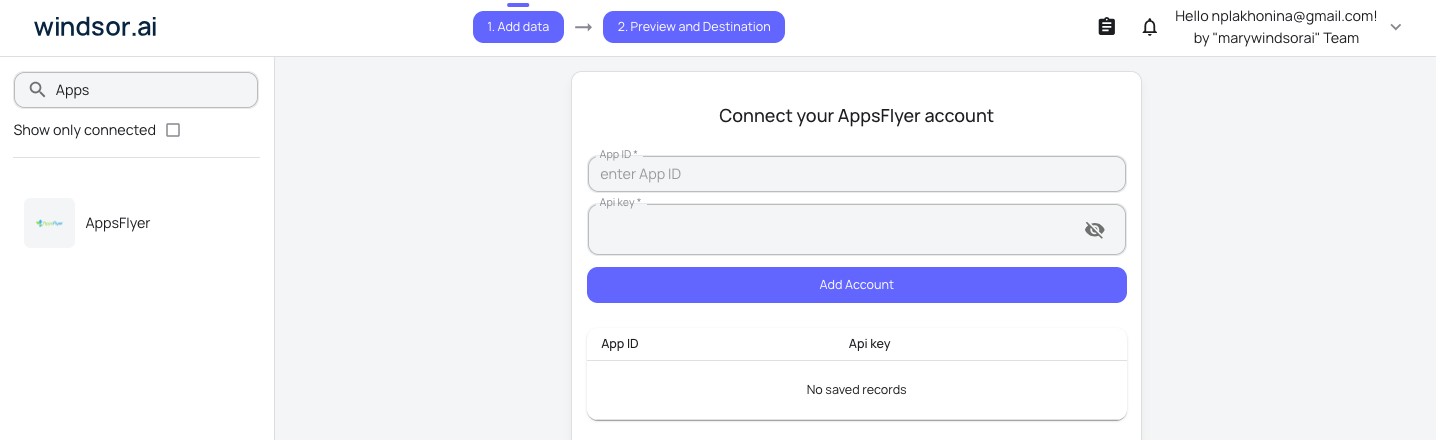
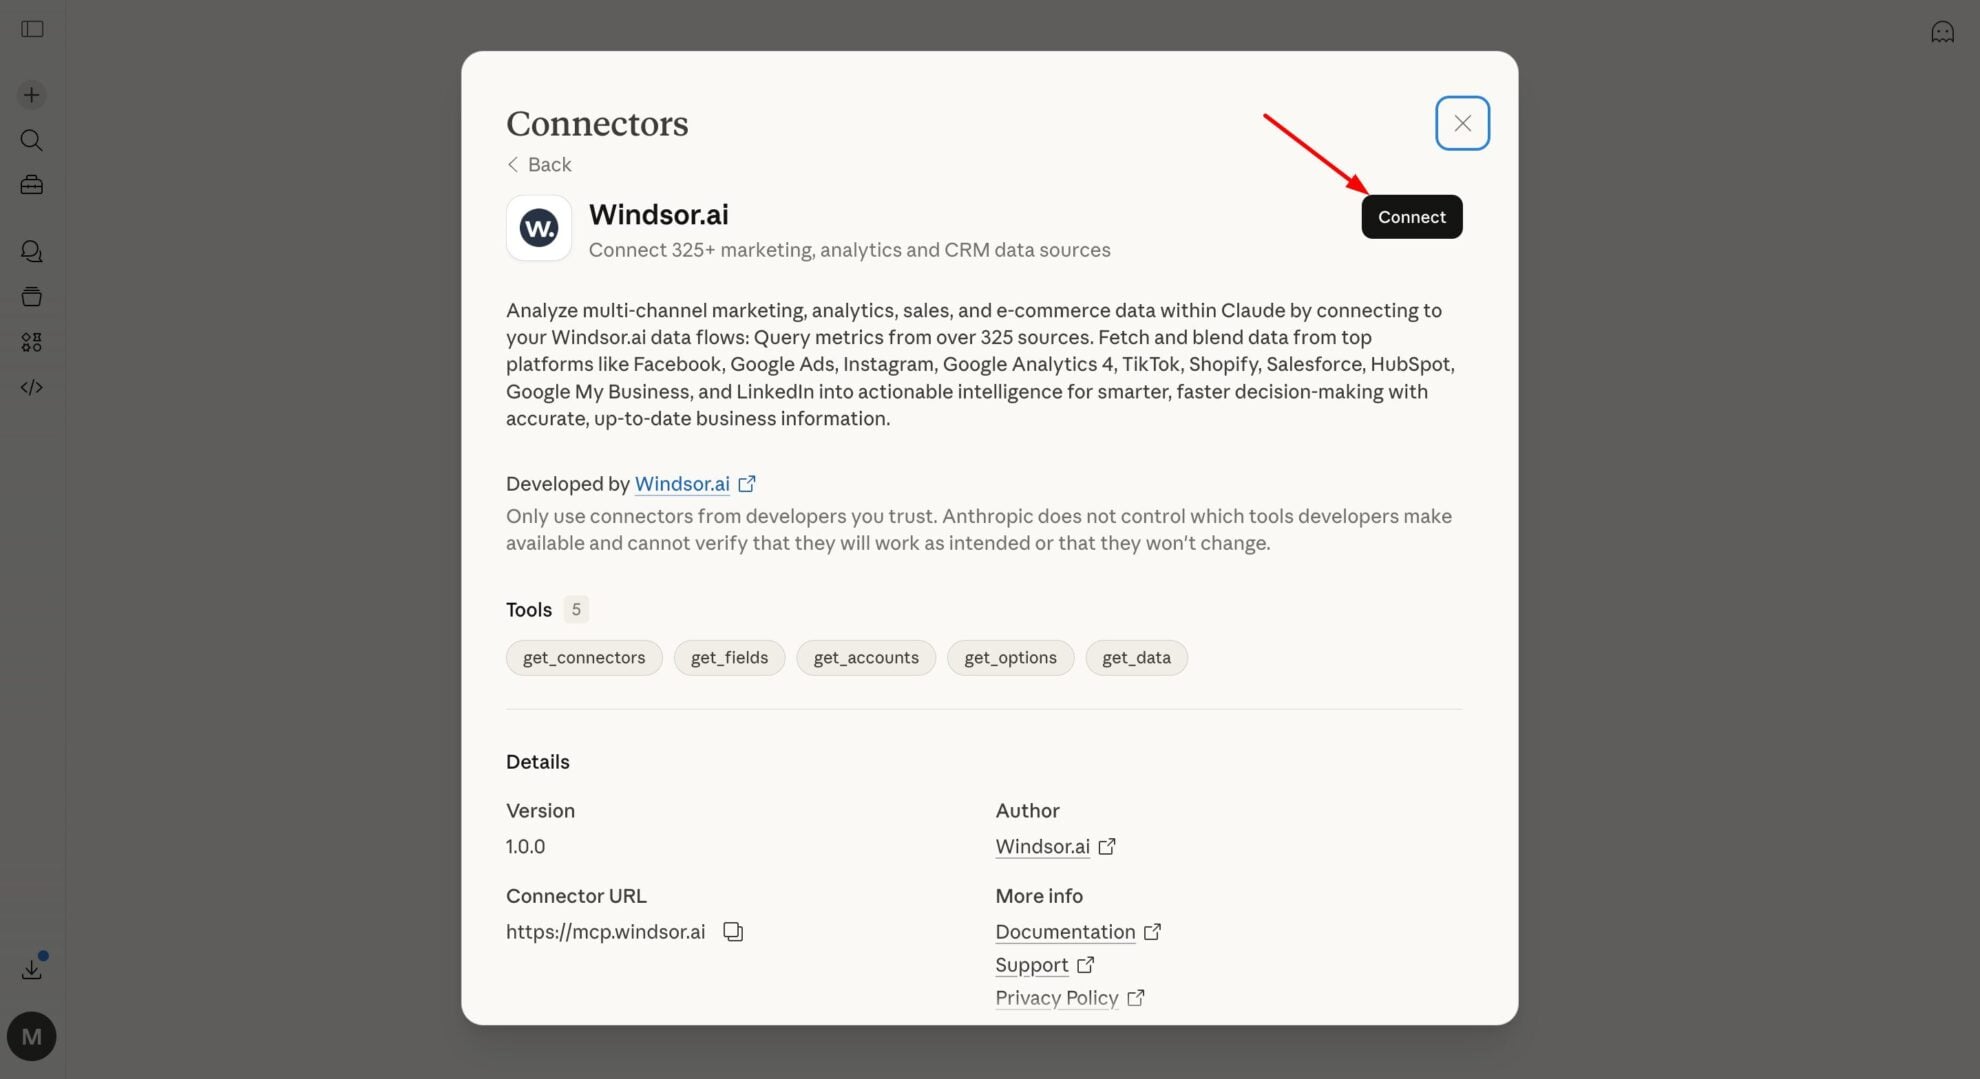
Install the Windsor.ai connector in Claude
In Claude, open Customize, then Connectors, search for Windsor and click Add. Sign in to your Windsor.ai account when prompted, and the connector appears in your Connectors list. You can also open the Windsor.ai listing in the Claude directory and click Connect.
Query your data in Claude
Start a new chat and ask Claude questions about your connected data: summarize KPIs, create client reporting dashboards, or run advanced analyses.

FAQs
What can I do with AppsFlyer data in Claude?
Once your AppsFlyer data is in Claude, you can:
- Analyze channel performance: Break down ROI, eCPI, and revenue across channels to see what’s actually driving value.
- Optimize budget allocation: Identify underperforming sources and reallocate spend to channels that deliver the highest returns.
- Evaluate user quality: Understand which campaigns bring high-LTV users based on ARPU and in-app behavior.
- Track funnel performance: Follow key events like registrations and purchases to identify drop-offs and conversion gaps.
- Detect trends and anomalies: Surface spikes, dips, and emerging patterns in installs, cost, and revenue.
- Get instant insights: Ask questions in plain language and get clear, actionable answers. No dashboards required.
- Drill into campaign data: Explore performance at the campaign and ad level to uncover scaling opportunities.
Find more details about Windsor MCP for Claude use cases in this guide: https://windsor.ai/how-to-use-windsor-mcp-examples-use-cases/.
Can Claude recommend budget reallocations based on AppsFlyer data?
Yes, by analyzing ROAS across channels, Claude identifies underperforming networks and recommends shifting budget toward the sources driving the most profitable installs.
Can Claude help me analyze user retention cohorts?
Yes. Claude can process cohort data from AppsFlyer to show you Day-1, Day-7, or Day-30 retention trends across different user segments.
Can Claude detect patterns in app uninstalls?
Definitely. By analyzing uninstall metrics alongside campaign data, Claude can help you pinpoint if a specific ad promise is leading to immediate user churn.
What prompts can I use when analyzing AppsFlyer data in Claude?
Use more specific, advanced prompts to extract deeper insights from your AppsFlyer data. For example:
-
Analyze our 'Uninstall Rate' across different ad sets and partners. Is there a specific media source that brings in a lot of installs but has a much higher-than-average uninstall rate shortly after? Tell me if these look like low-quality users.
-
Find the users who have a high number of 'sessions' but haven't 'initiated checkout' yet. Based on the campaigns they came from, what kind of re-engagement message should we send to push them toward their first purchase?
-
Cross-reference 'Event Revenue' with 'App Version' and 'OS Version.' Are users on older versions of the app or specific phone models spending significantly less? Identify if we have a technical bug or a performance issue that is costing us money.
-
Based on the 'ROI' and 'Loyal User Rate' from the last 30 days, if we had an extra $5,000 to spend next month, which specific campaign and country combination would likely give us the best return on that investment?
Can I blend AppsFlyer data with other sources like Meta Ads or Google Ads?
Absolutely. Windsor.ai supports data from 350+ sources. With Claude, you can compare AppsFlyer attribution with ad spend across platforms to calculate your cross-channel ROAS.
How much does it cost to integrate AppsFlyer into Claude using Windsor.ai?
Windsor.ai’s pricing for Claude data integration varies depending on the number of connected accounts and data sources. We offer absolutely transparent pricing plans for diversified business needs and budgets.
How long does it take to connect AppsFlyer to Claude?
With Windsor.ai’s easy-to-use connector, the integration process takes just a few minutes. No technical expertise is needed; syncing AppsFlyer to Claude is simple, straightforward, and completely code-free.
Do you have helpful links to get started with integrating AppsFlyer and Claude using Windsor.ai?
Yes, we have helpful resources to help you get started. You can explore our official documentation and tutorials for seamless AppsFlyer to Claude integration with Windsor.ai:
Tired of manual AppsFlyer data exports? Try Windsor.ai today to automate your reporting


