 AI insights
 About us
 Careers
 Security
 Customer reviews
 Contact us
 Affiliate program
 Solution partners
 Looker Studio templates
 Tableau templates
 Facebook Ads templates
 Google Ads templates
 Data fields & Metrics
 AI prompt library & Guides
 Product documentation
 API documentation
 Case studies
 Blog
Blog Data models
 Windsor vs Supermetrics
 Windsor vs Fivetran
 Windsor vs Portermetrics
 Last updated: 2 February 2026

Manually copying Instagram metrics into Google Sheets or uploading CSV files, fixing broken formulas, and reformatting columns quickly becomes a time-consuming task that pulls you away from analysis and strategy.
If you want reliable and streamlined Instagram reporting, automation is essential.
The fastest way to import Instagram data into Google Sheets automatically is to use a no-code connector like Windsor.ai. It pulls data directly from the Instagram API and keeps your spreadsheet updated on a schedule (daily, hourly, or every 15/30 minutes) without manual exports or CSV files. Your Instagram data arrives in a spreadsheet in a clean, structured format.
Whether you’re tracking Instagram organic performance, post-level metrics, or audience insights, Windsor.ai’s Instagram connector for Google Sheets removes the manual work from reporting and keeps your data up to date.
In this tutorial, you’ll learn how to connect Instagram data to Google Sheets using Windsor.ai. We’ll go through two available methods:
Method 1. Using Windsor.ai Google Sheets extension
Method 2. Creating a destination task in the Windsor.ai app
Let’s get started.
2 ways to automate Instagram reporting in Google Sheets with Windsor.ai
Windsor.ai offers two simple ways to automatically connect Instagram to Google Sheets: using the Google Sheets add-on or setting up a destination task in the Windsor.ai app. Both methods are completely no-code and keep your data refreshed automatically without manual intervention.
1) Using the Windsor.ai Google Sheets extension: With this option, the integration is set up directly inside Google Sheets.
This method is ideal if you:
- are building or updating reports hands-on
- prefer working entirely inside the Sheets interface
- need quick visibility into the data as you configure it
2) Creating a destination task in the Windsor.ai app: With this approach, the data sync runs in the background based on a destination task configured in the Windsor.ai application.
This method works best if you:
- manage multiple clients or accounts
- need quick, centralized control over many data syncs
- want less manual interaction with spreadsheets
📄 Step-by-step instructions: How to integrate data into Google Sheets using Windsor.ai.
Which method should you choose?
Both methods provide a fast and reliable way to sync Instagram data to Google Sheets without coding, manual exports, or data entry.
- Choose the Google Sheets add-on if you want hands-on control inside your spreadsheet.
- Choose the destination task in the app if you need to manage multiple integrations at scale or prefer centralized configuration.
Select the approach that best fits your reporting workflow and volume.
Method 1: Import Instagram data via the Windsor.ai Google Sheets add-on
This method uses the Windsor.ai Google Sheets add-on to connect Instagram Organic data (along with 325+ other data sources) directly to Google Sheets.
With this approach, your spreadsheet becomes a live reporting workspace. You install the Windsor.ai add-on, connect your Instagram account, and create a query by selecting the metrics and dimensions you want to track. The add-on then pulls clean, analysis-ready Instagram data straight into this sheet.
Once you set a refresh schedule, your spreadsheet updates automatically, keeping reports current without repetitive imports or manual work.
Prerequisites:
- An Instagram Business or Creator account with admin access
- A Windsor.ai account (free or paid)
- A Google Sheets file
- The Windsor.ai Google Sheets add-on
How to connect Instagram data to Google Sheets via the Windsor.ai add-on:
Step 1. Link your Instagram account to Windsor.ai
Although most of the setup happens inside Google Sheets, you first need to create a Windsor.ai account (30-day free trial) and connect your Instagram account(s).
Select Instagram Organic from the list of available data sources and authorize access. After that, you’ll see all Instagram pages associated with your account; choose only the ones you want to export data from.
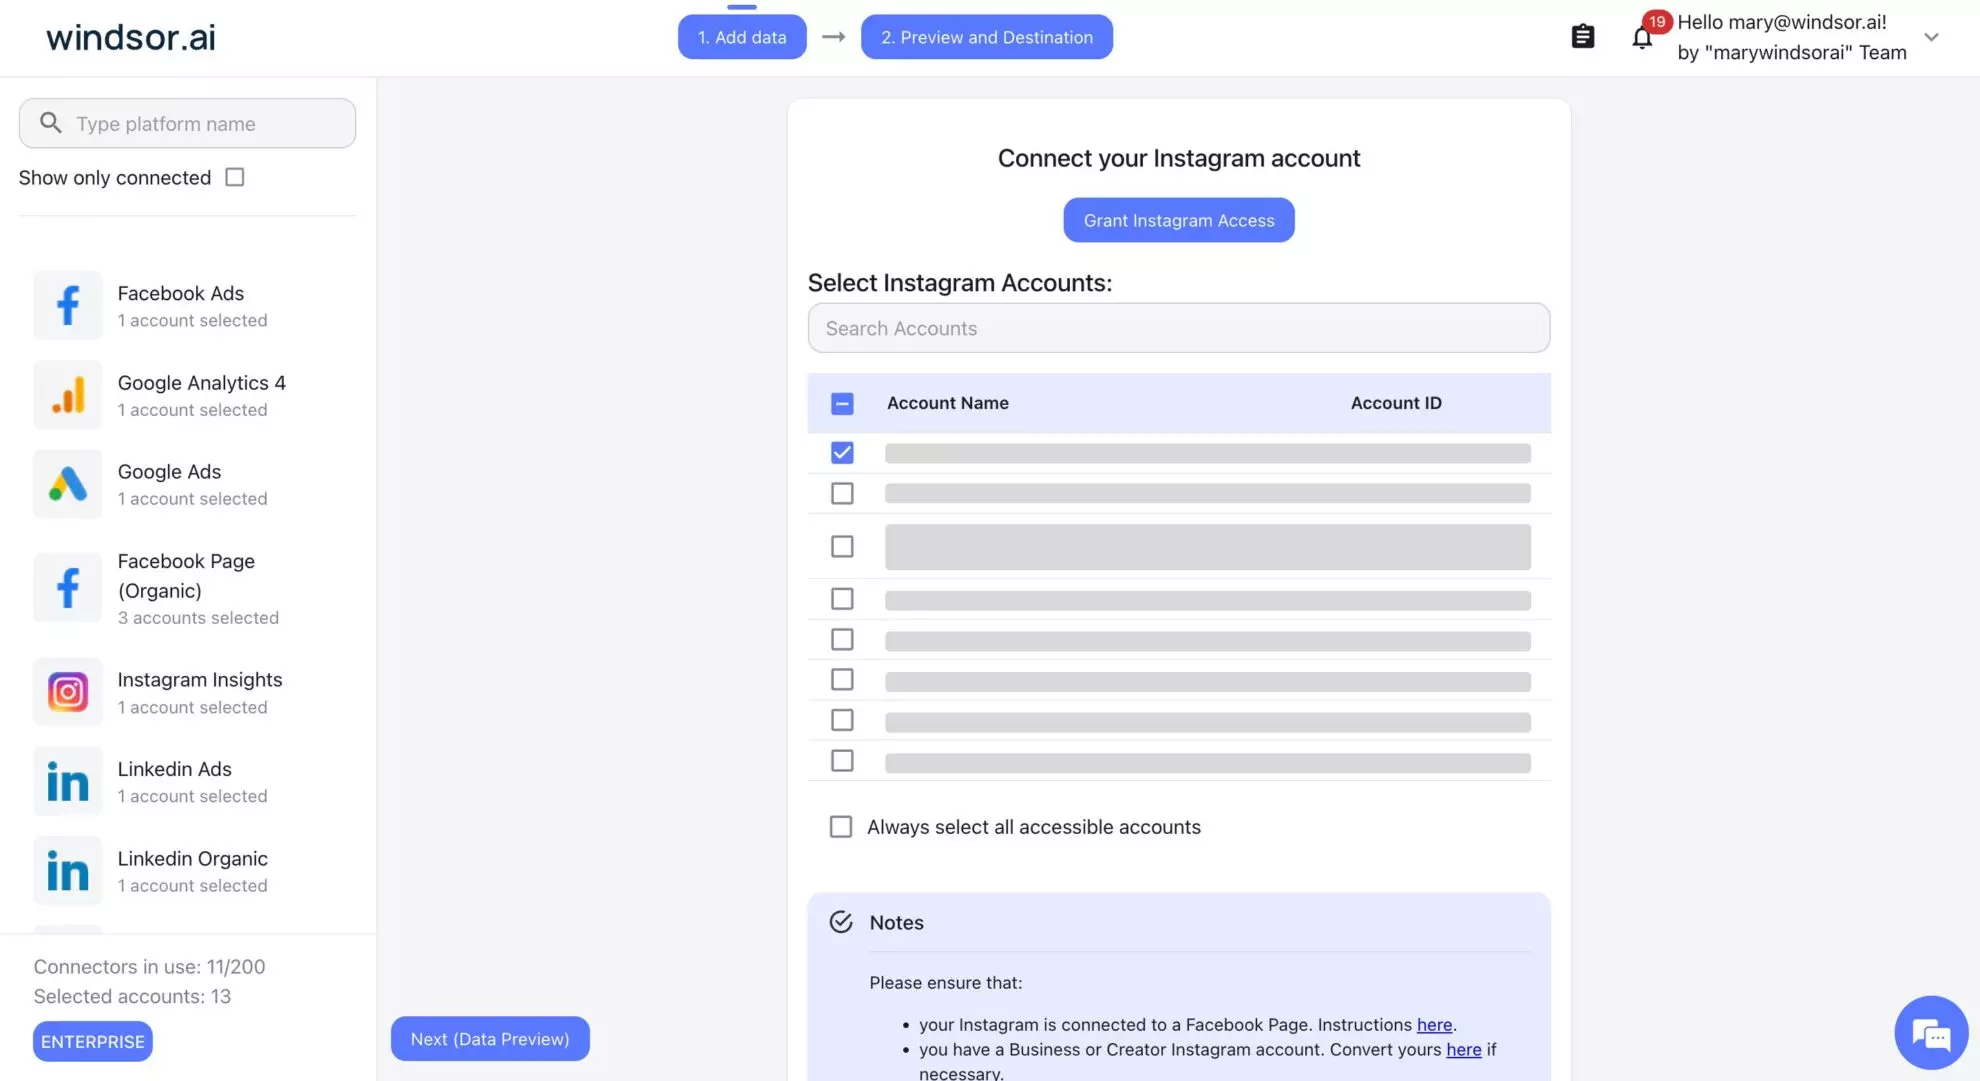
💡 Quick tip: You can immediately connect Instagram to Windsor, and your Windsor.ai account will be created automatically after the sync.
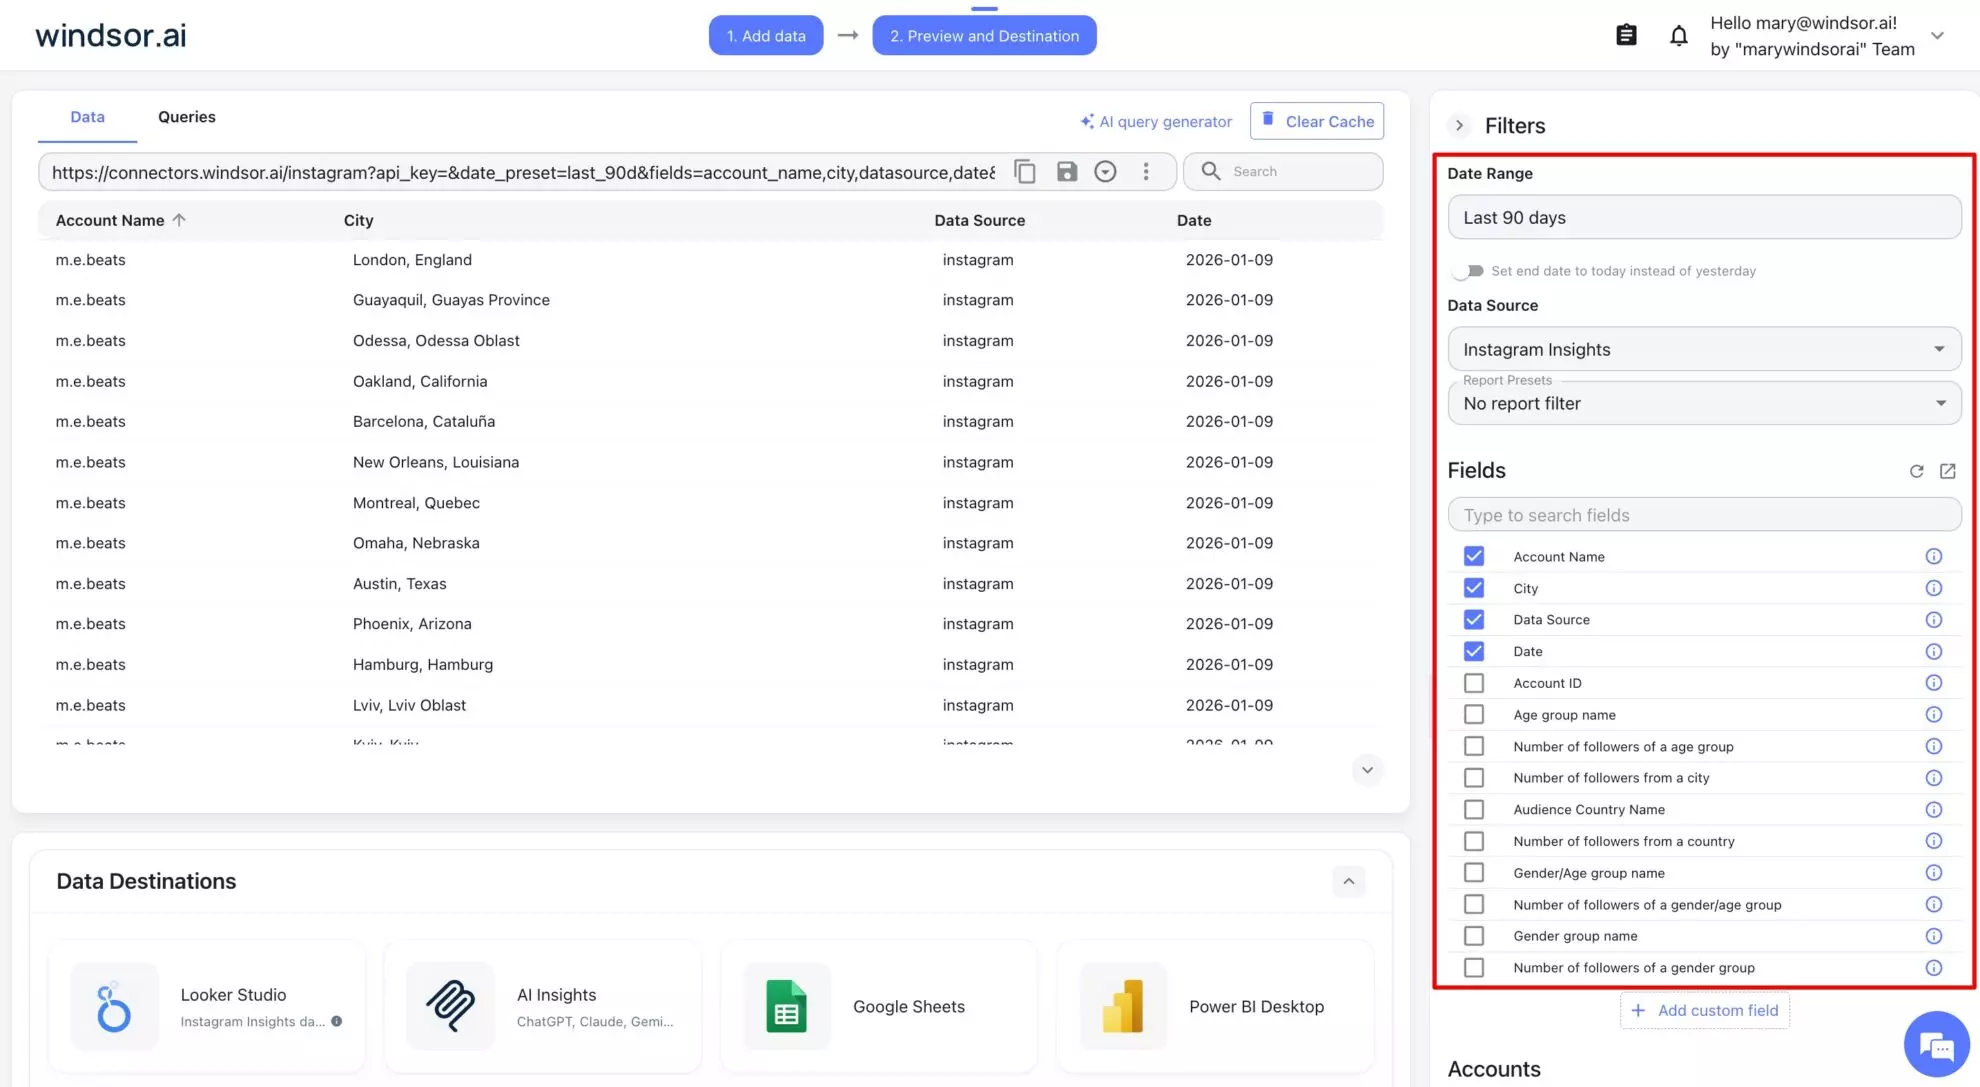
Step 2. Preview your Instagram data before import
Then, click Next to go to the Preview and Destination screen.
Here, you can verify that your Instagram data is correct by selecting a date range and choosing specific fields (post or story reach, views, reactions, and audience insights).
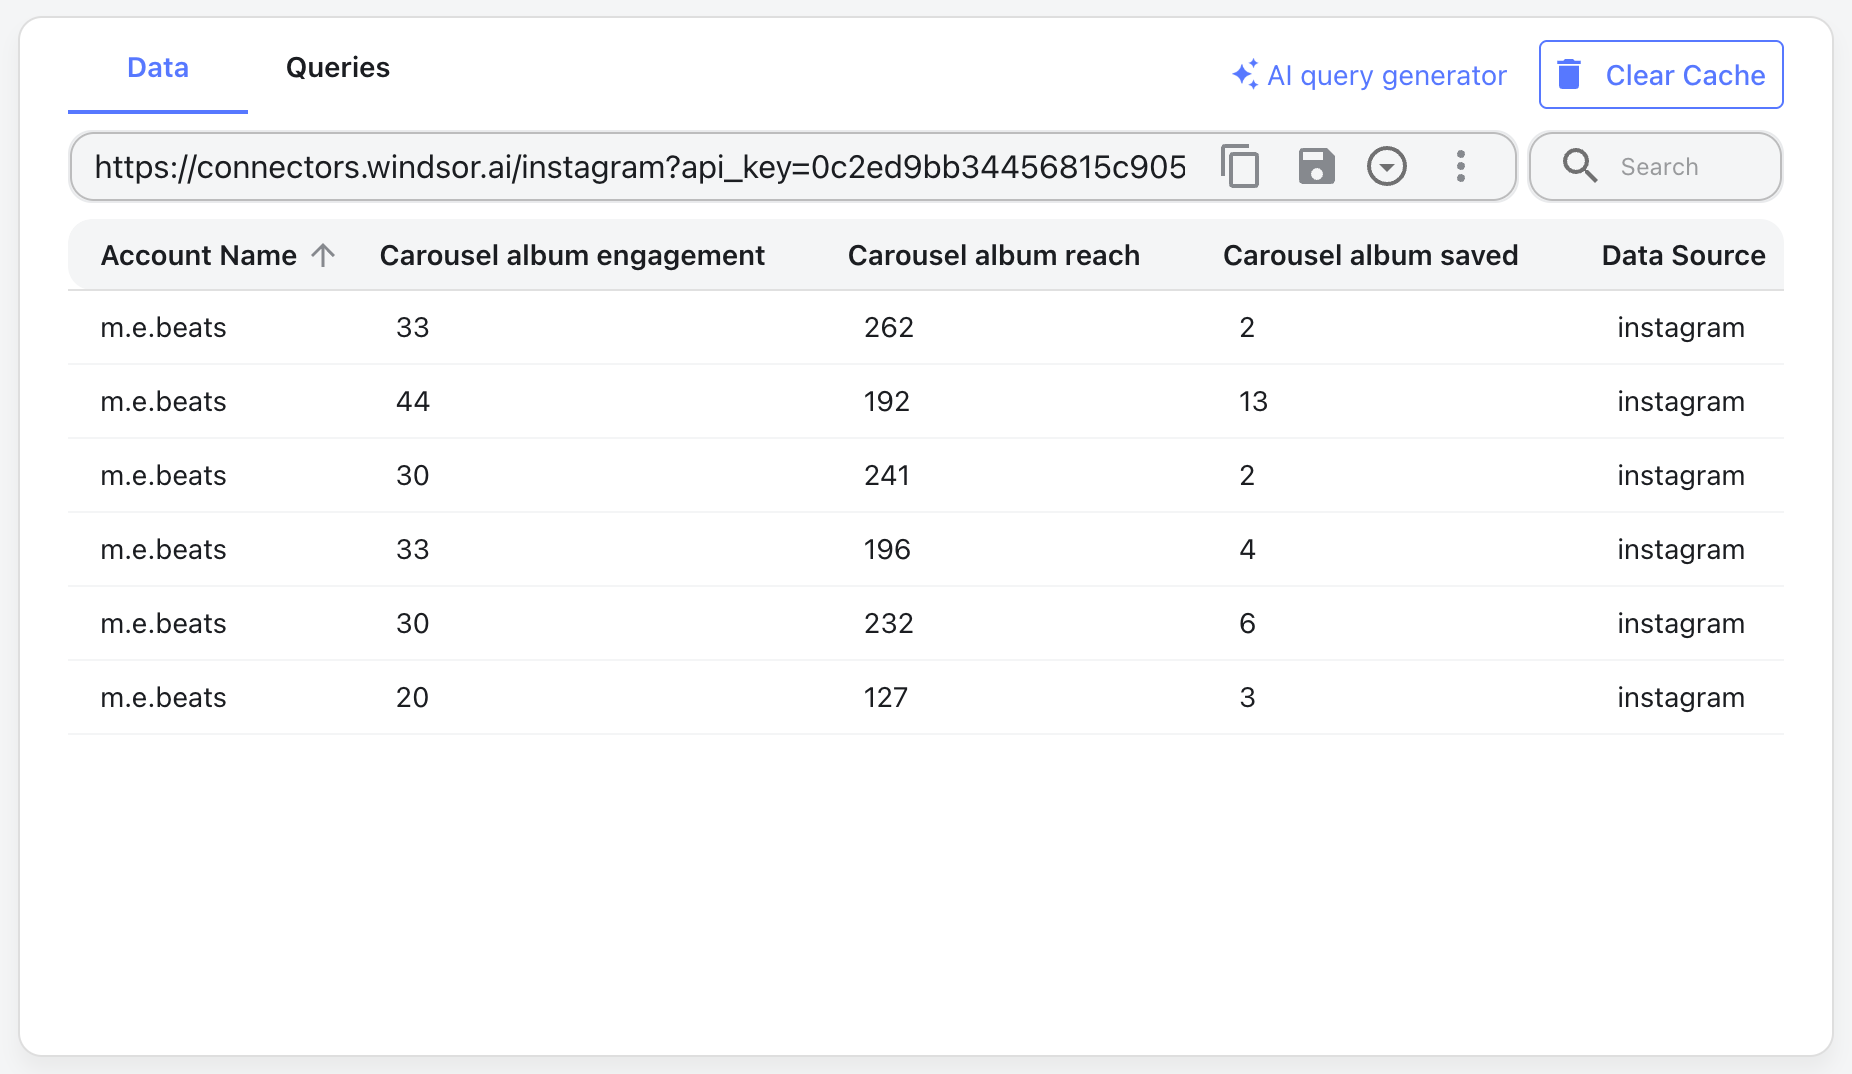
If the data appears as expected, the connection is successful, and your Instagram data has been extracted correctly.
Step 3. Open Google Sheets
Open the Google Sheets file where you want to load your Instagram data. We recommend creating a new spreadsheet or a new tab to keep your reporting setup clean and easy to manage.
💡 Quick tip: If you plan to combine data from multiple platforms in one spreadsheet, use a separate tab for each data source. This makes blending data later much clearer and simpler to maintain.
Step 4. Install the Windsor.ai add-on
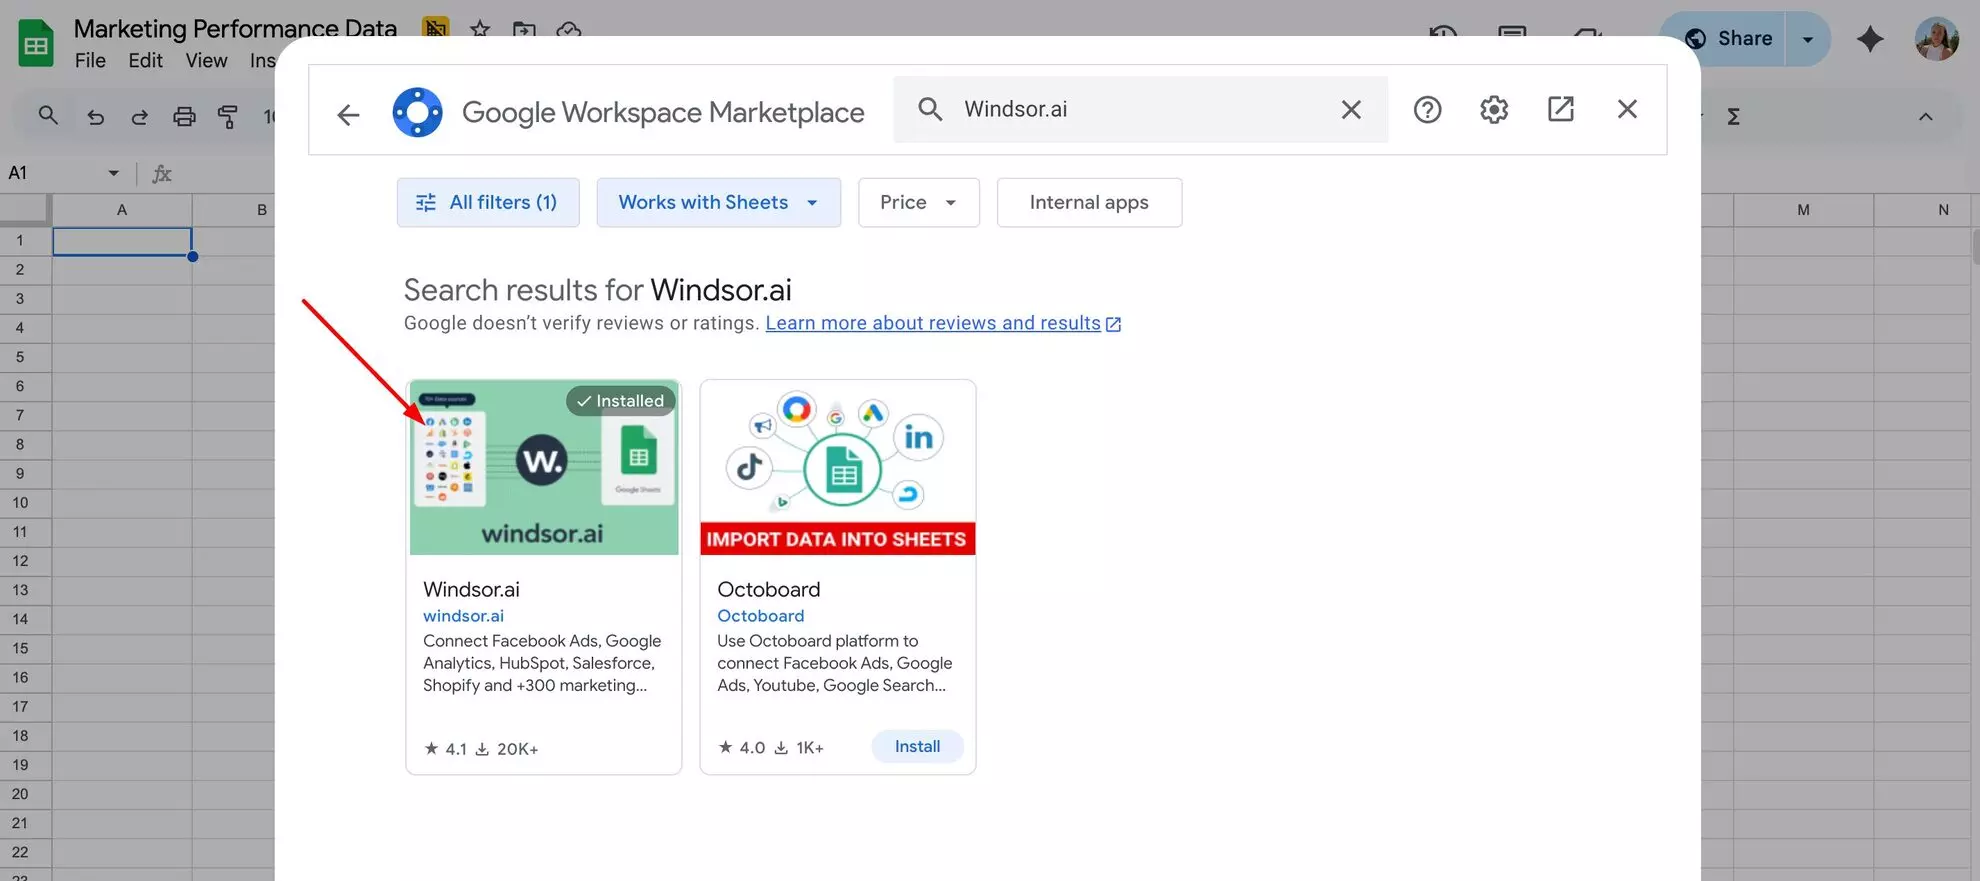
In Google Sheets, click Extensions → Add-ons → Get add-ons.

Search for Windsor.ai and install the add-on. When prompted, grant the required permissions.
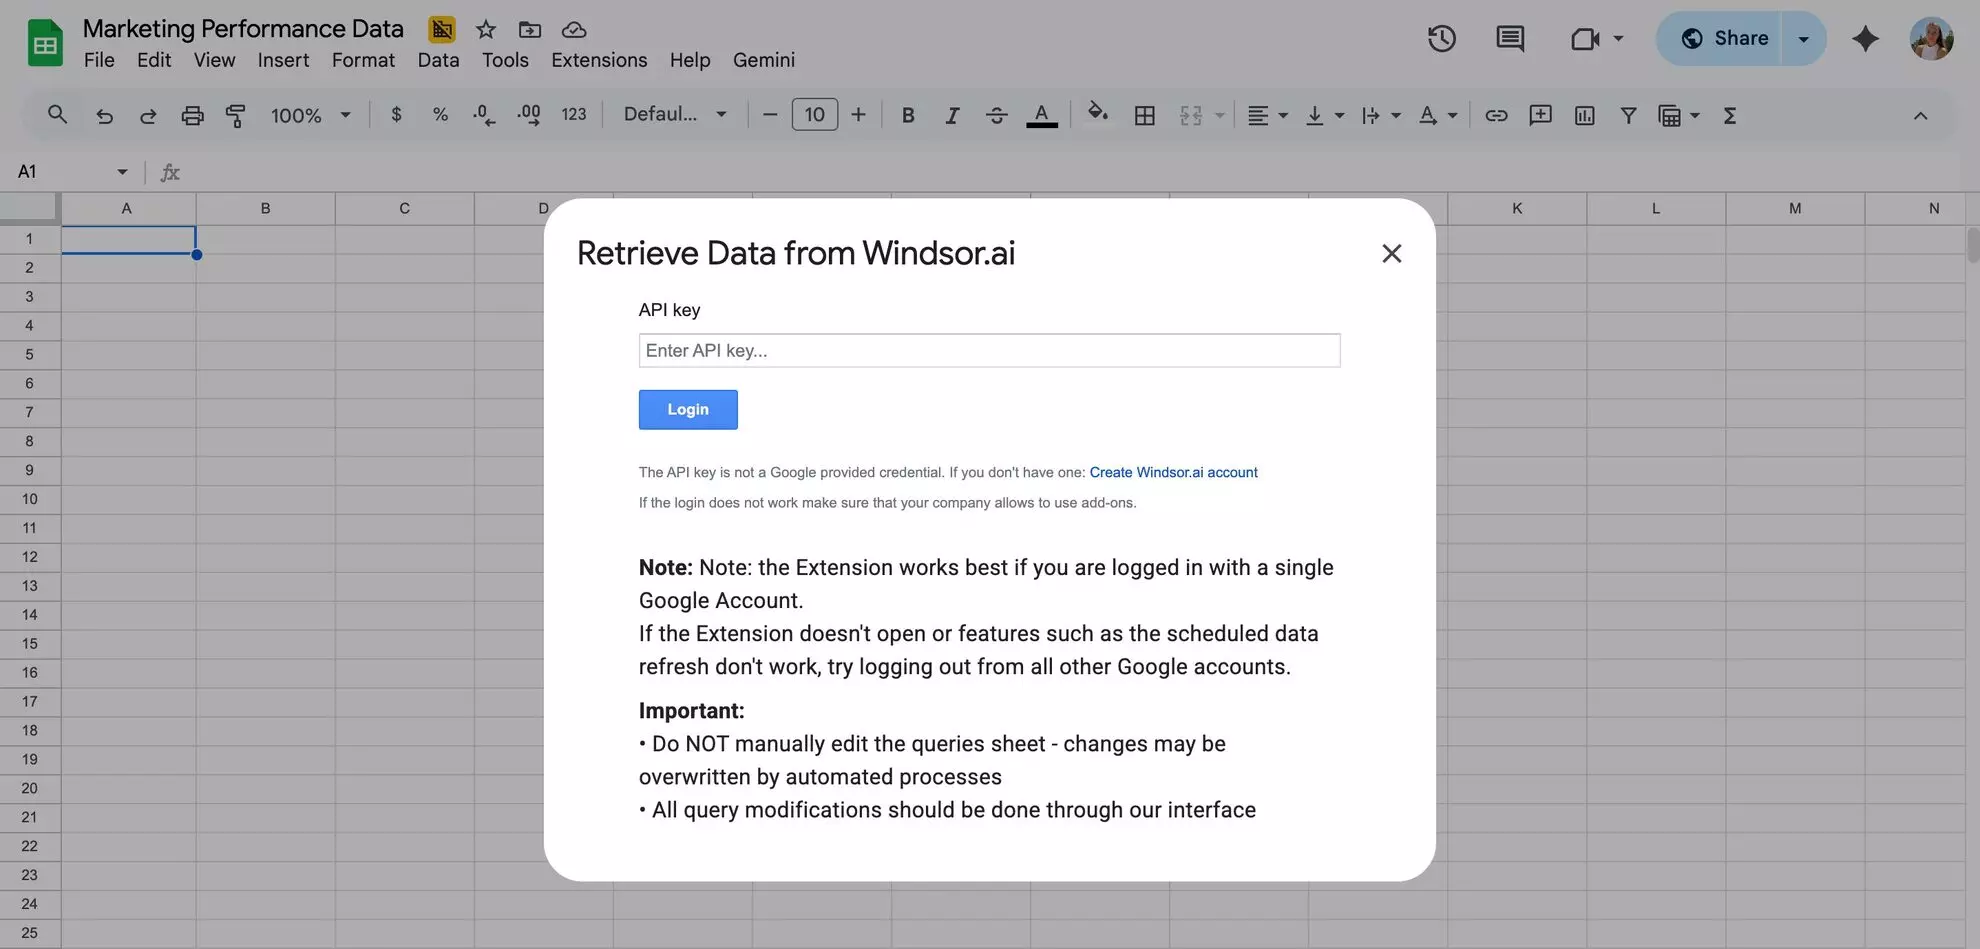
Step 5. Log in with your Windsor.ai API key
For your first data import, you need to log in to the Windsor.ai add-on.
Open Extensions → Windsor.ai → Login.
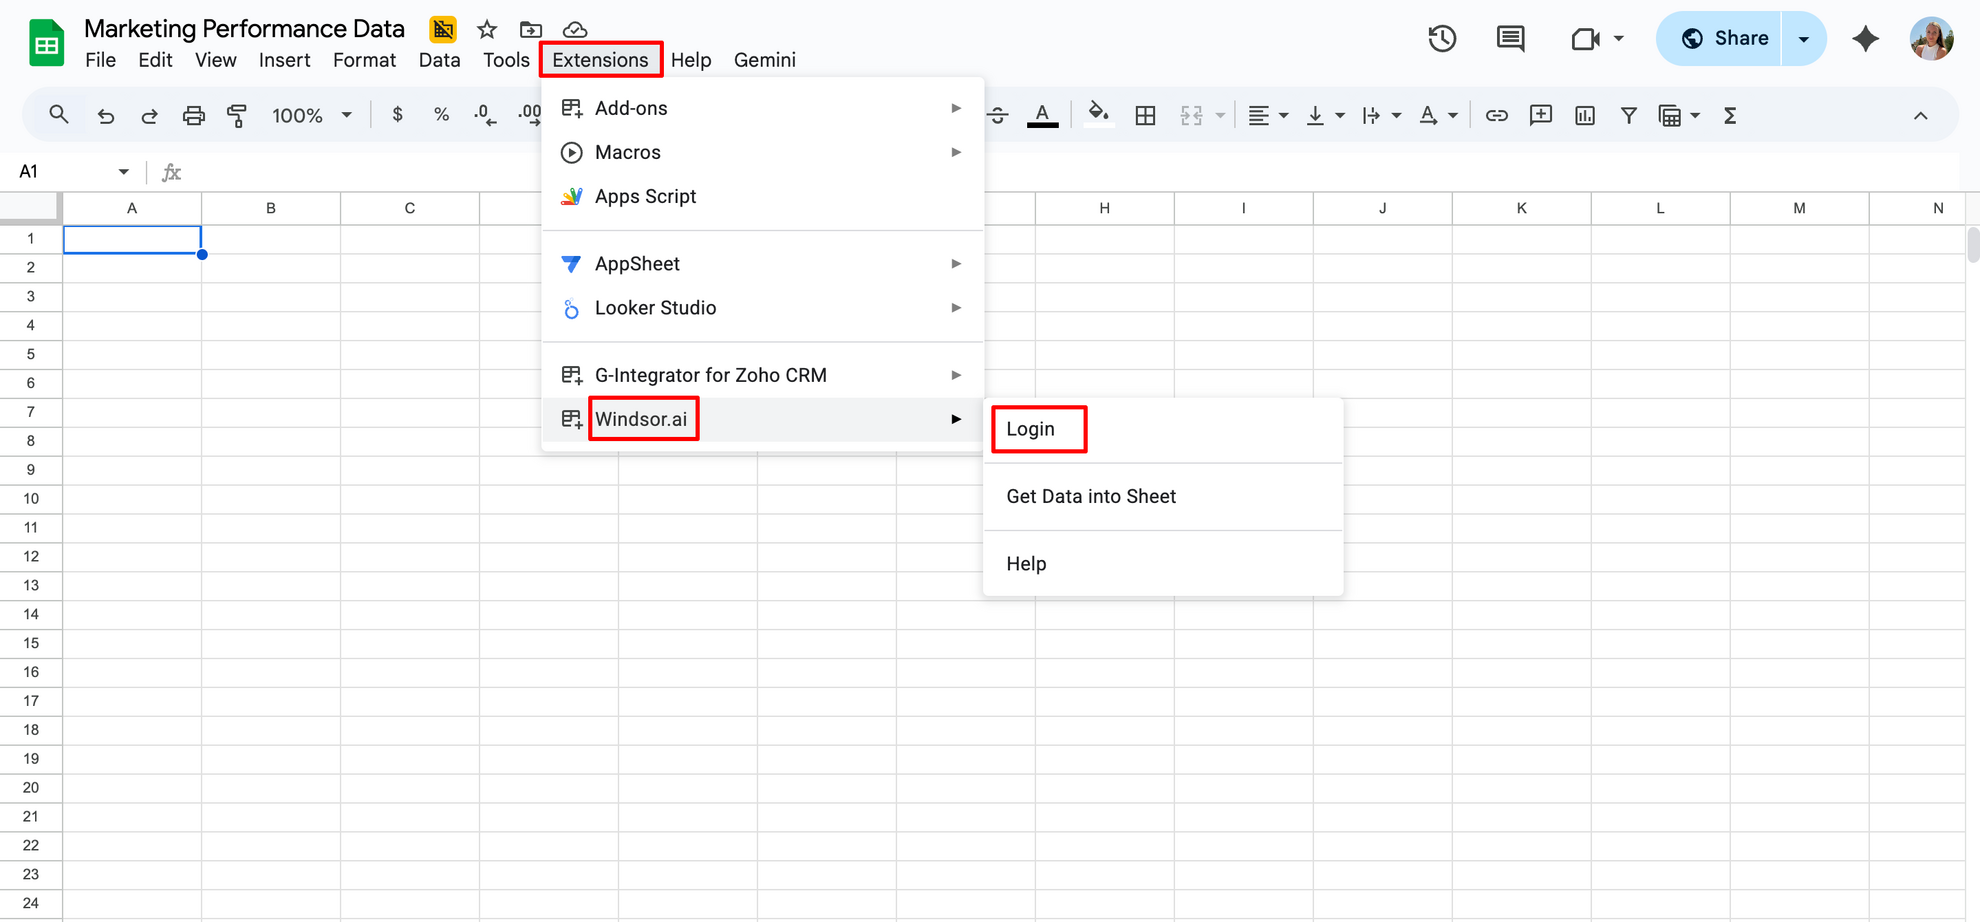
You’ll be prompted to insert your Windsor.ai API key. This special string is located in the Windsor.ai dashboard in the connector URL tab.
Insert the API key into the add-on login box to authorize the connection between Google Sheets and Windsor.ai.
Step 6. Create your first Instagram query
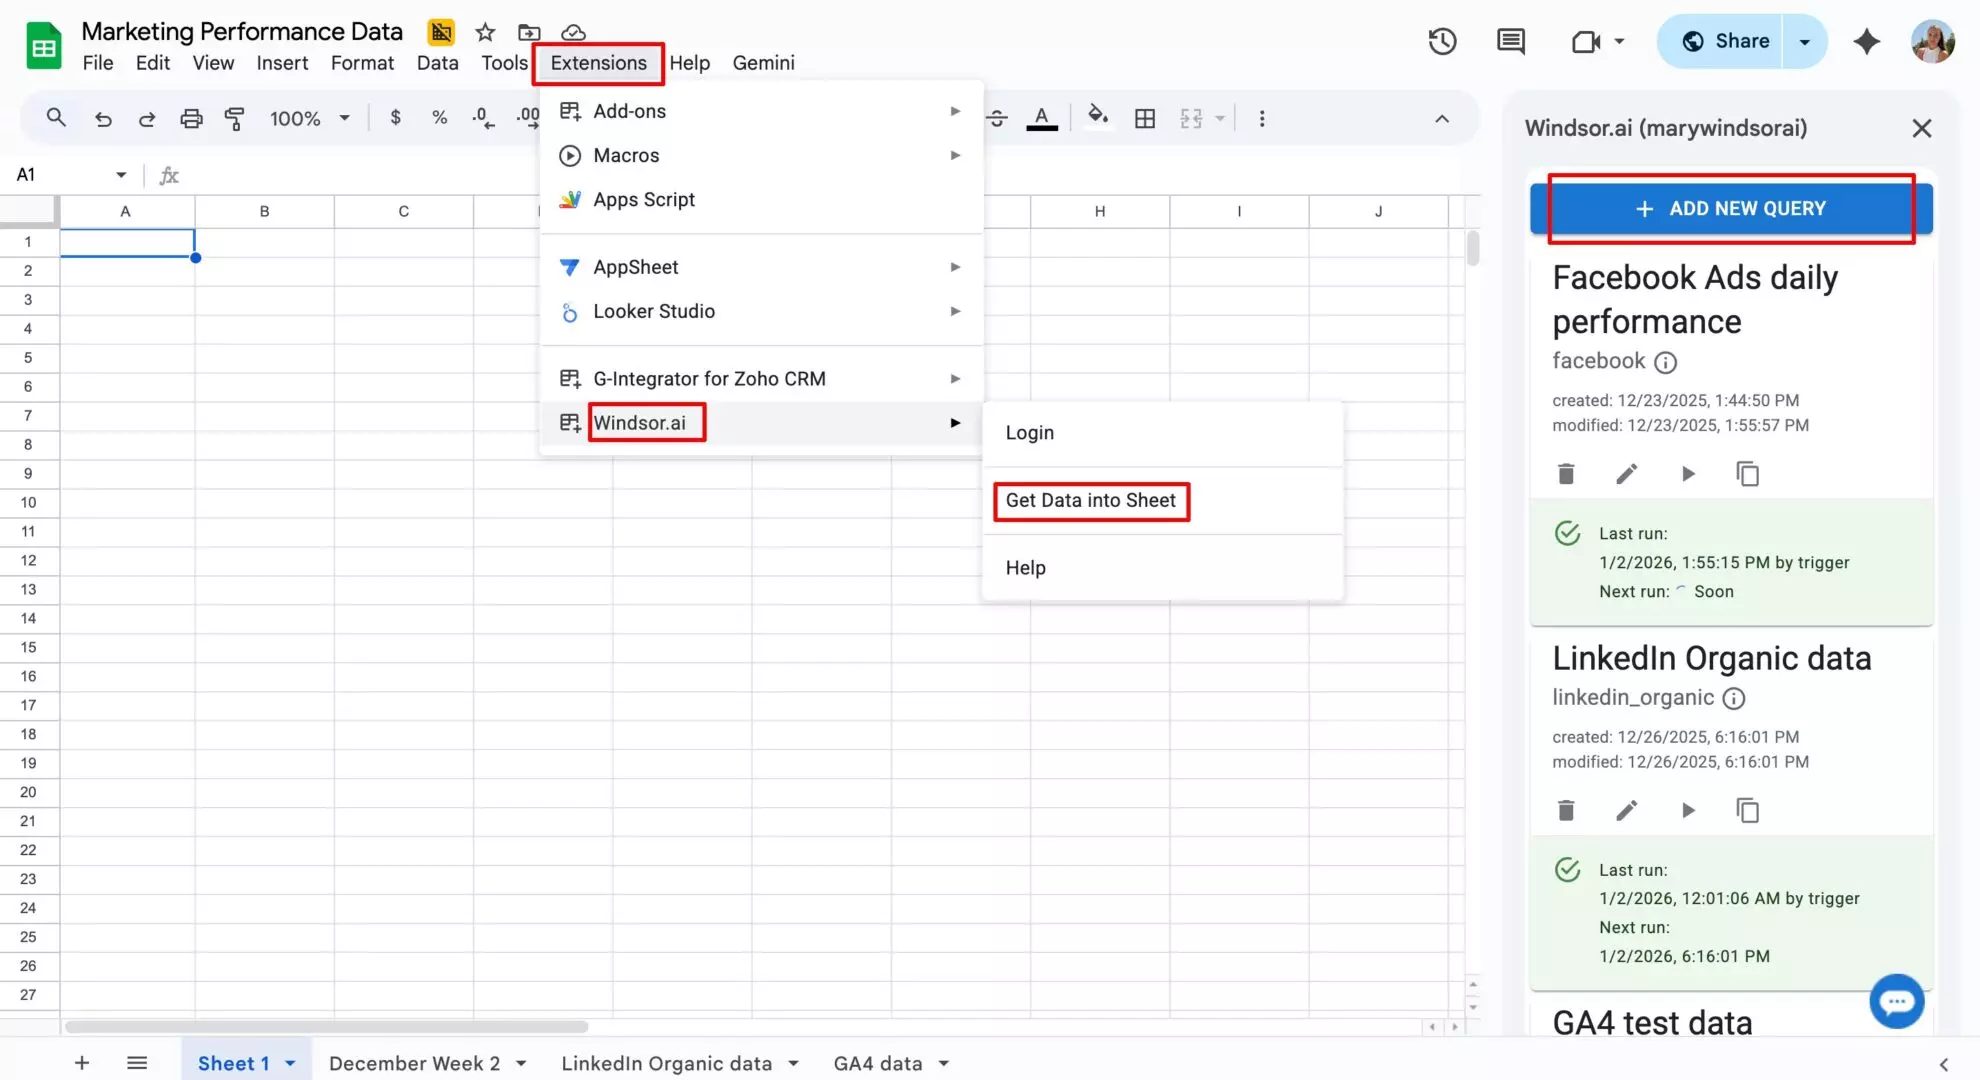
Now, you’re good to proceed with your first data import.
Navigate to Extensions → Windsor.ai → Get Data into Sheet.
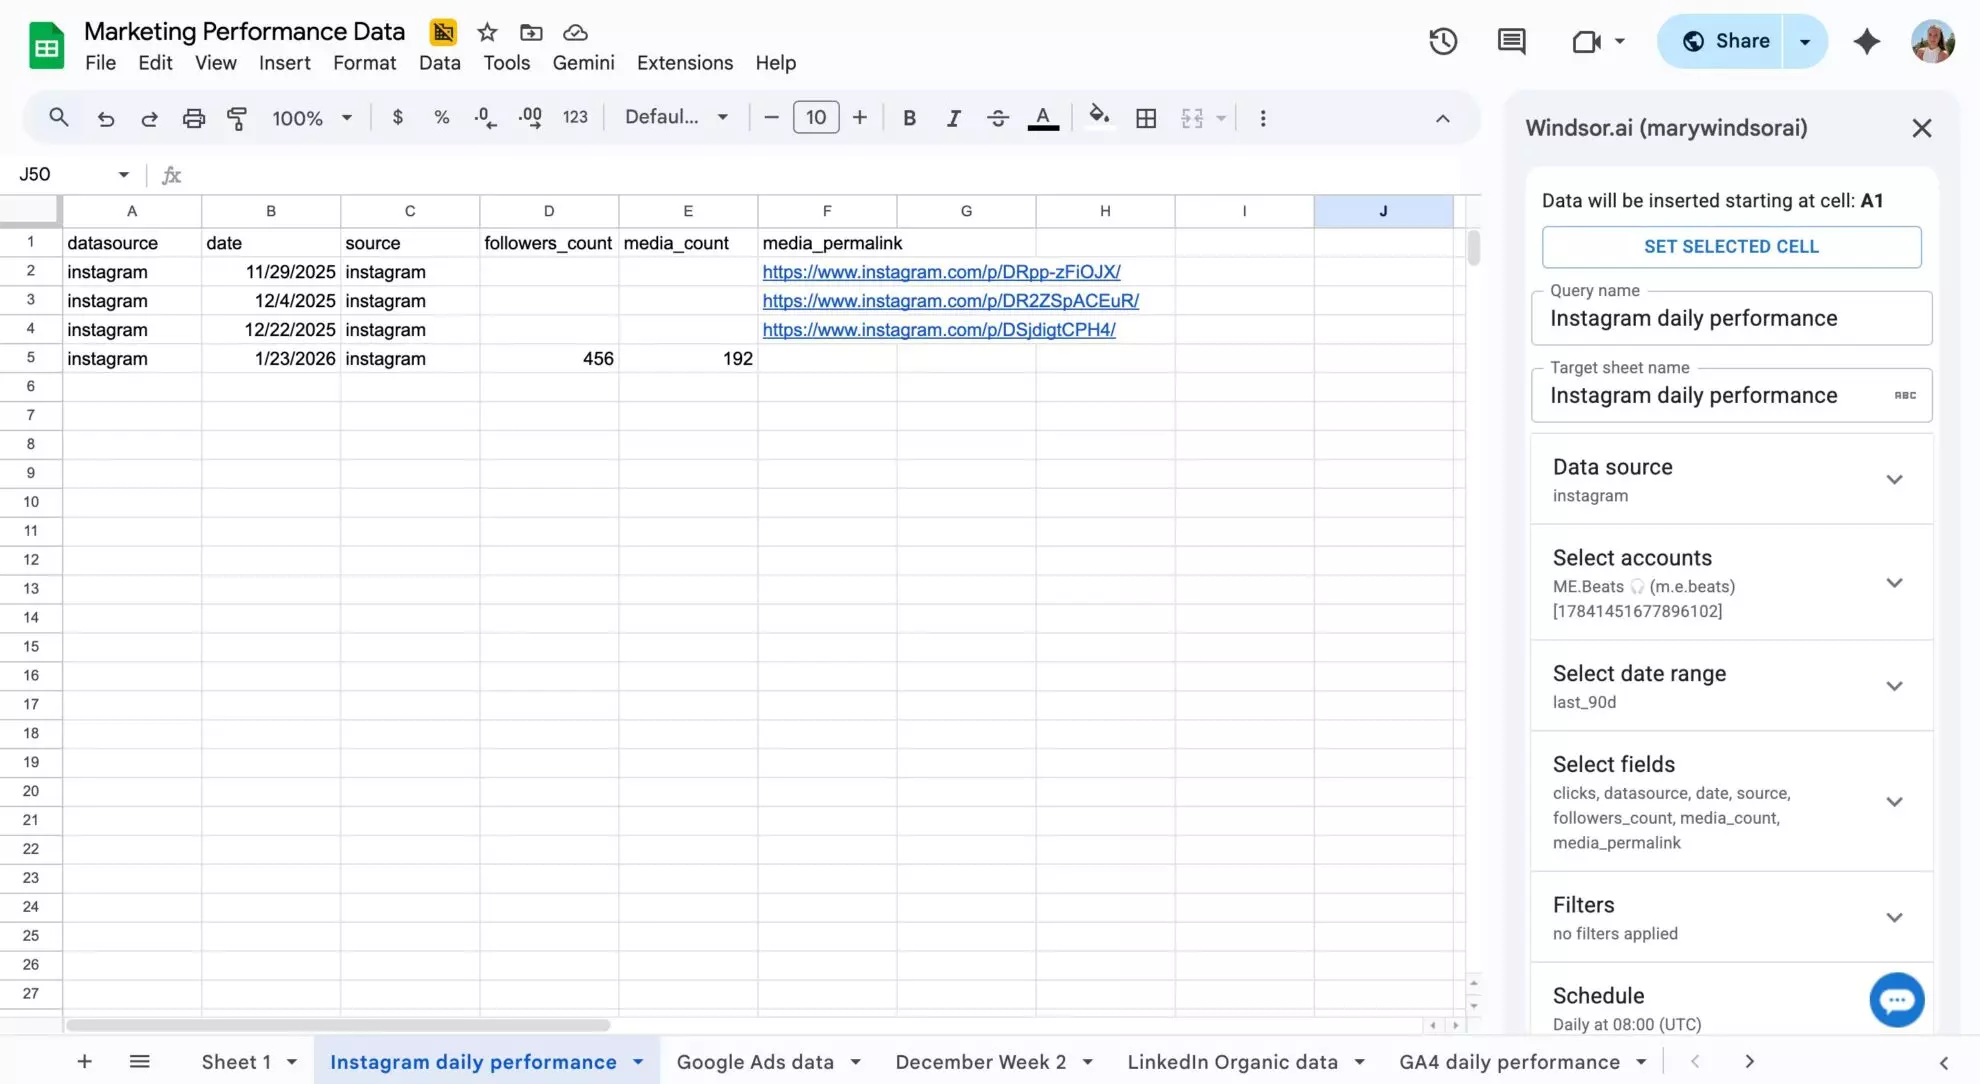
On the right-side panel, click the + Add new query button. This is a workspace where you set import settings.
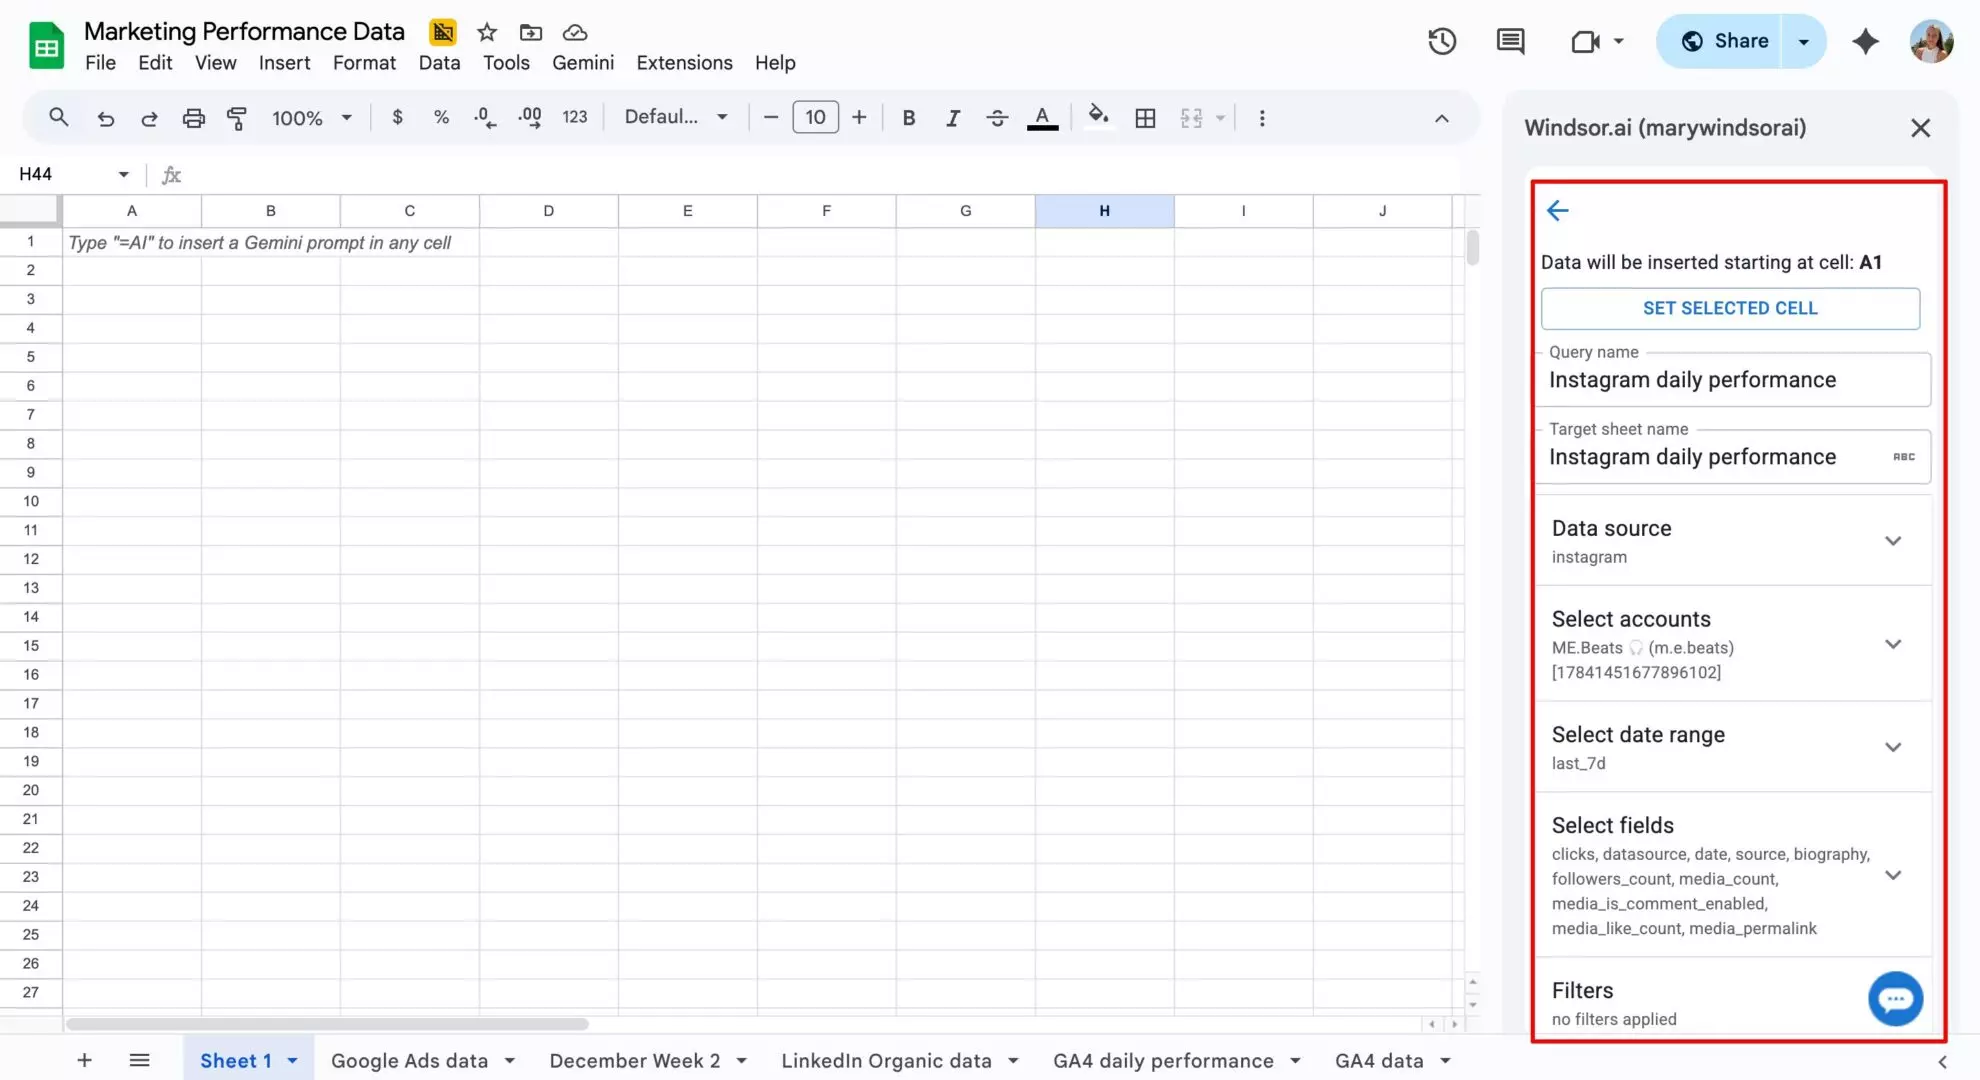
Configure the following query parameters:
- Query name (for example, Instagram daily performance)
- Target sheet name (select an existing sheet or create a new tab where the data should be loaded)
- Data source (choose Instagram)
- Accounts (select the account(s) you want to pull data from)
- Date range (define the reporting period)
- Fields (select the metrics and dimensions you need, such as post reach, story likes, audience age, etc.). Windsor.ai supports 50+ metrics and 48+ dimensions from the Instagram Insights API.
- Add filters if necessary to segment your data.
You can create multiple queries for different reports (e.g., profile stats, audience insights, top posts, etc.).
Step 7. Schedule auto-refresh
Choose how often you want your spreadsheet to update: daily, hourly, or every 15/30 minutes.
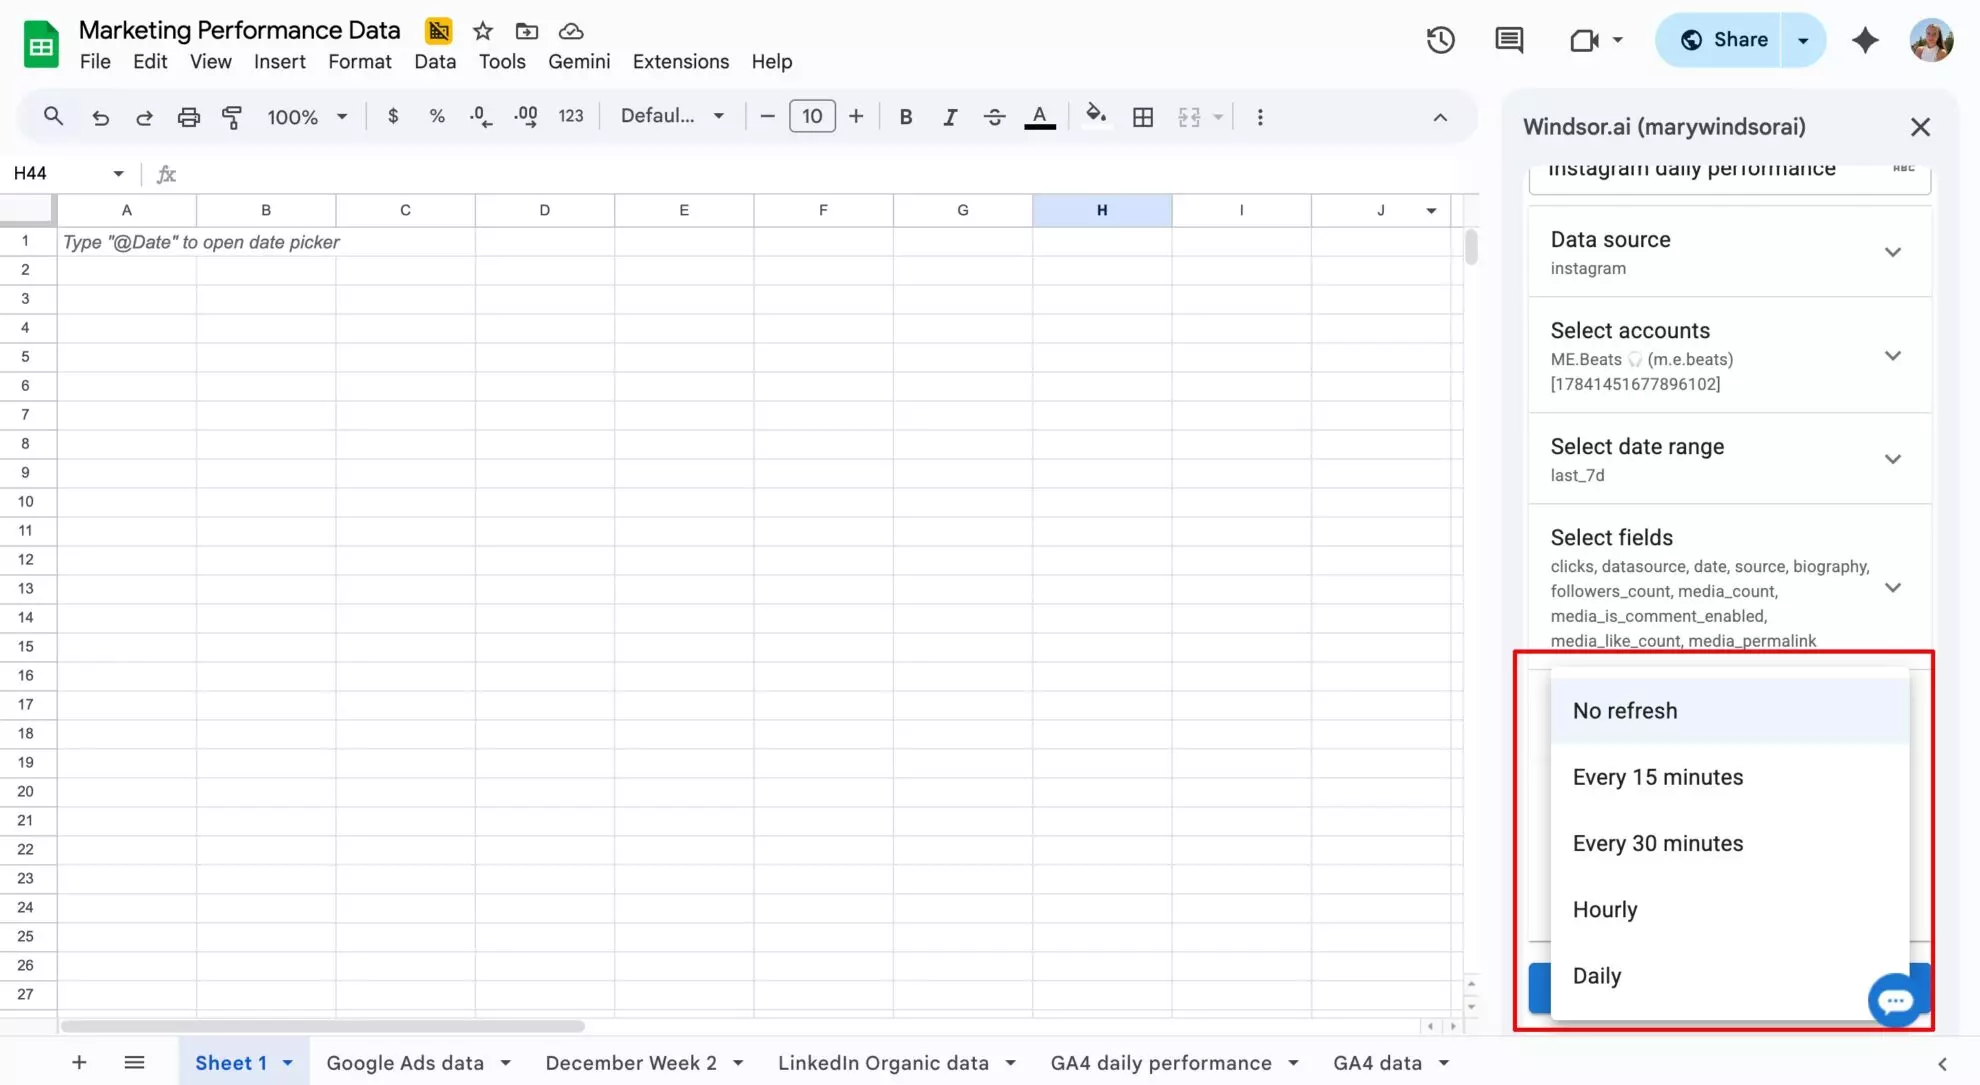
For active campaigns, shorter refresh intervals are preferred as they help you track performance closer to real time.
Once scheduled, your data refreshes automatically, so there’s no need to rerun exports manually. You can change the refresh schedule at any time, and updates take effect immediately.
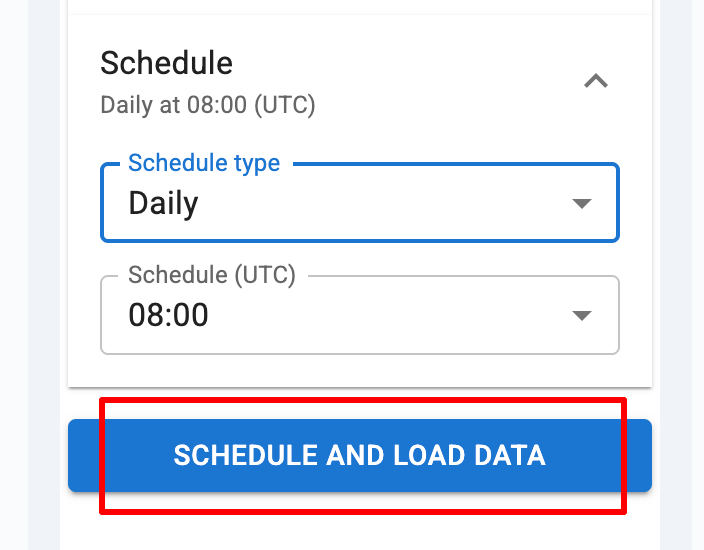
Step 8. Run the import
Double-check query settings and click Schedule and load data to run the sync.
Note: You may be prompted to authenticate with your Google account and grant Windsor.ai access to the target Google Sheets file. Allow the permissions to proceed. If you encounter an error after that, click Schedule and load data again.
Within a minute, your spreadsheet will populate with Instagram data using consistent naming and formatting.
Future syncs will keep your existing charts, formulas, and pivot tables intact. Data is only overwritten if you intentionally modify the query settings.
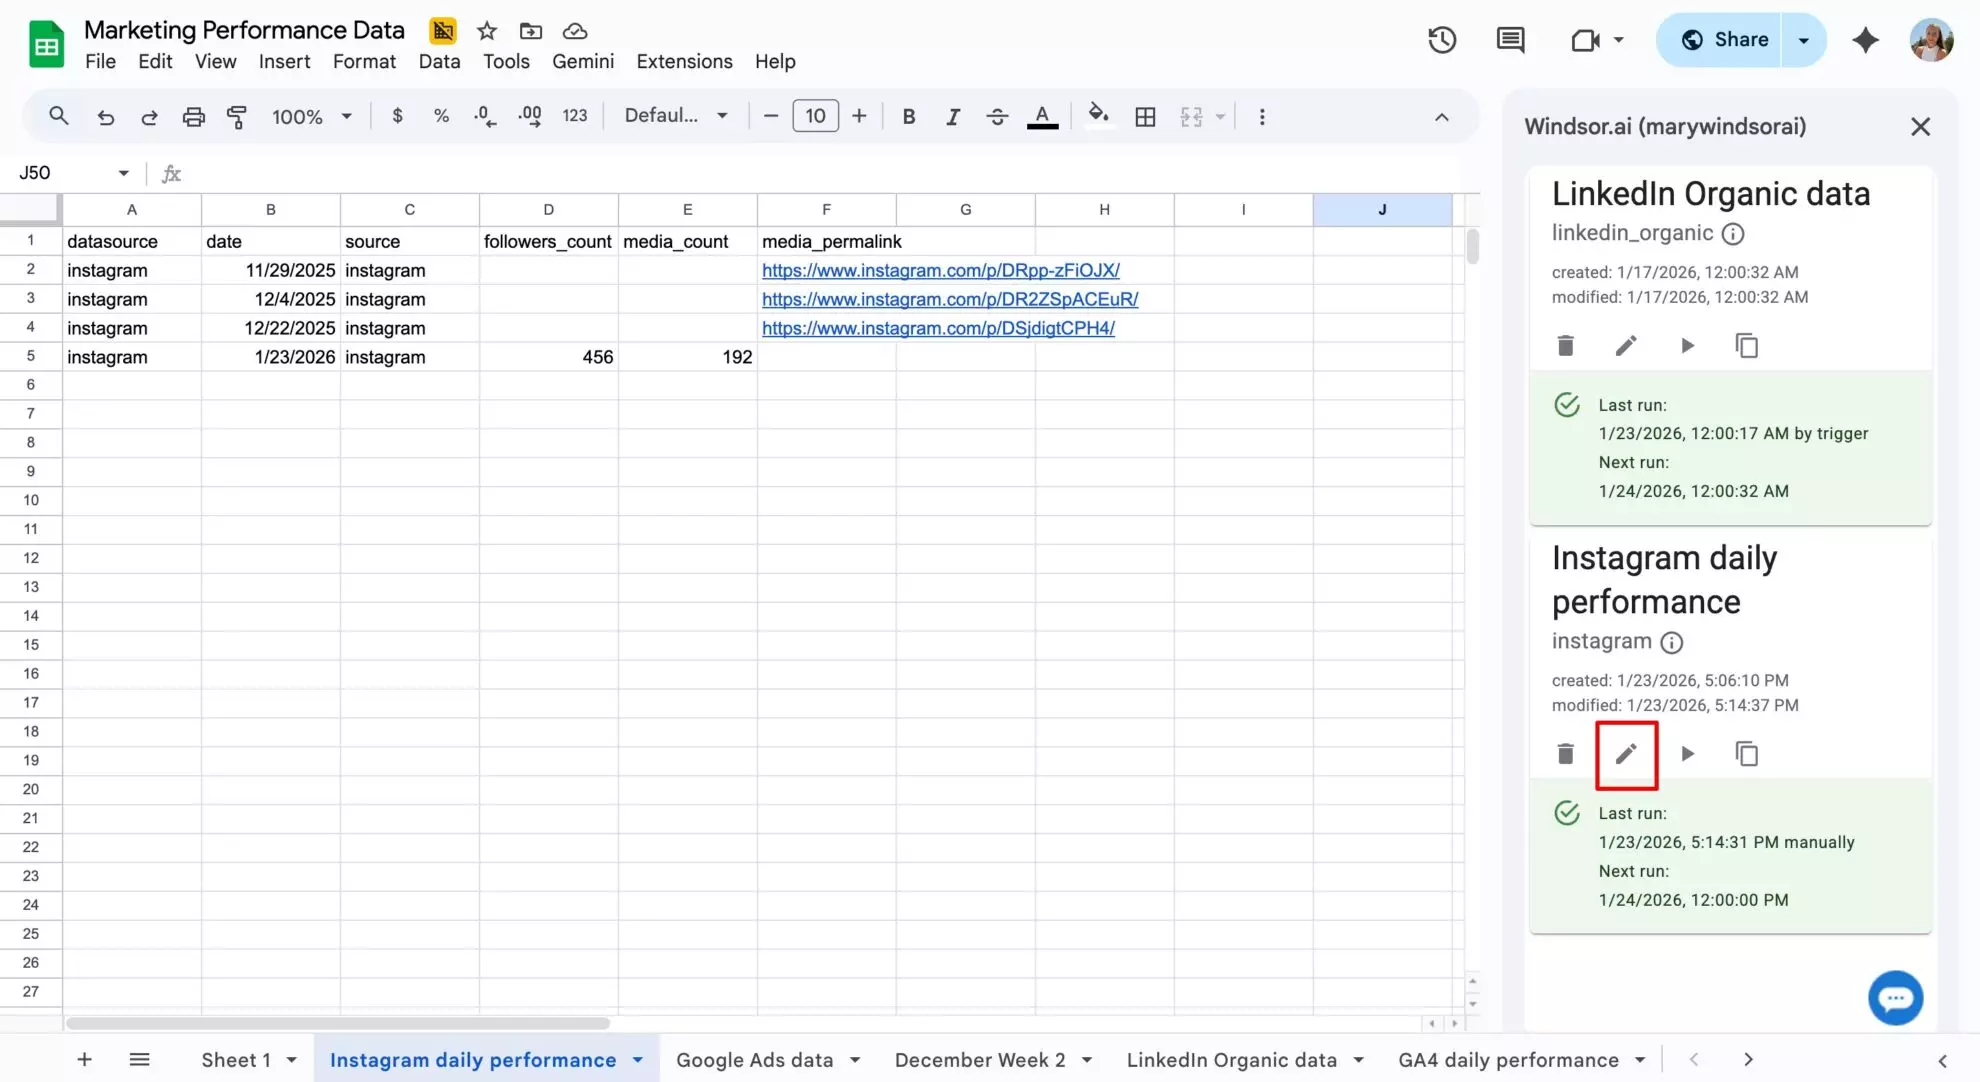
Step 9. Managing and editing the sync
After the import completes, your query is saved in the Windsor.ai Google Sheets add-on. You can edit the sync settings at any time by clicking the pencil icon on this query card.
If you enabled scheduled refreshes, the sync will also appear as a destination task in your Windsor.ai dashboard under the Google Sheets destination.
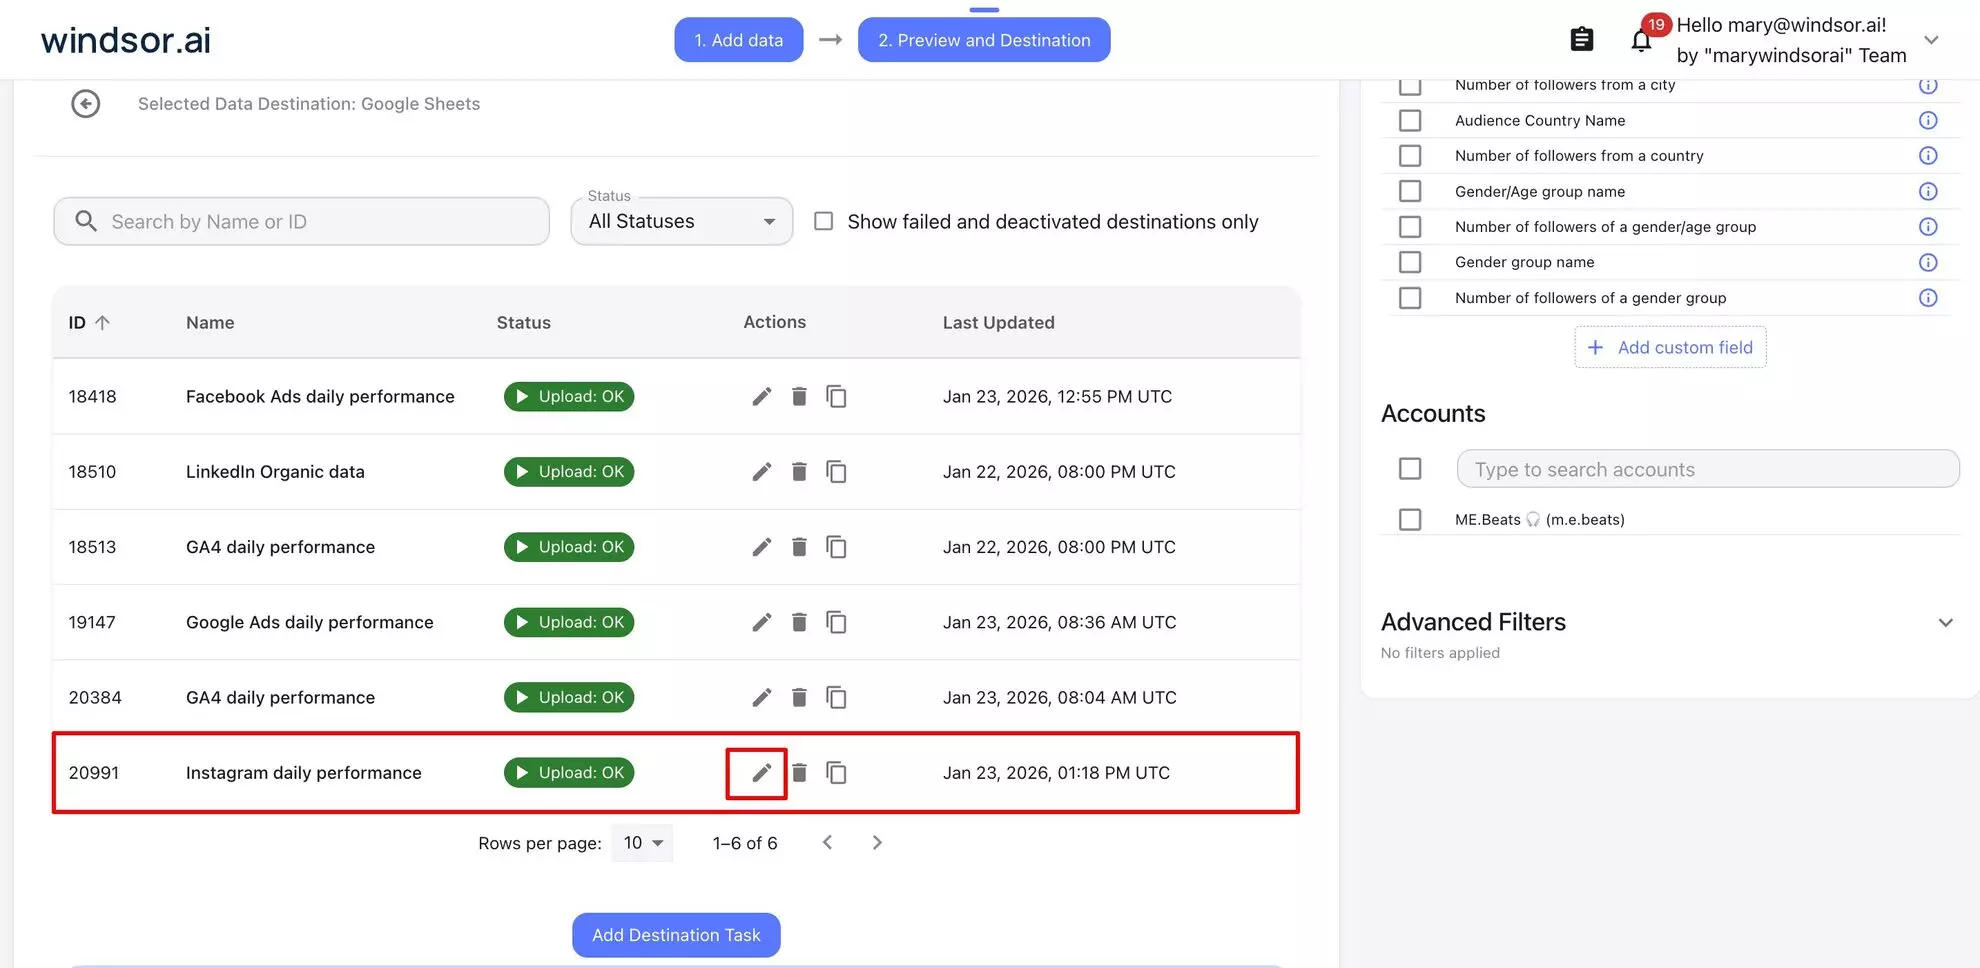
From there, you can also adjust refresh intervals or fields, even if the data was originally imported via the add-on.
This setup allows you to maintain long-term Instagram Organic reporting in Google Sheets with minimal effort. Your data always stays fresh automatically, without manual exports or rework.
Method 2: Import Instagram data via Windsor.ai destination task
In this method, you connect your Instagram data source, customize your query in the Windsor.ai dashboard, and configure an export task for Google Sheets through a simple form.
This integration method is handled through the Windsor.ai destination task and is recommended for scalable Instagram reporting. You configure import details and run the sync similar to Method 1 (by linking Instagram to Windsor, selecting metrics, scheduling a refresh), but the entire setup happens in the web application, through a convenient export form.
Prerequisites:
- An Instagram Business or Creator account with admin access
- A Windsor.ai account (free or paid)
- A Google Sheets file
How to stream Instagram data to Google Sheets via a destination task:
Step 1. Connect your Instagram data to Windsor
Just like in Method 1, you start by creating a Windsor.ai account and connecting your Instagram data. Select Instagram Organic as the data source and choose the account(s) you want to import data from.
Step 2. Prepare your dataset
Next, open the Preview and Destination page to configure the dataset you want to send to Google Sheets.
Here, you can:
- choose the data source (Instagram or Blended Data for cross-channel reporting)
- set a date range
- adjust reporting fields (metrics and dimensions)
- optionally apply filters (for example, include only video posts)
This step lets you tailor the dataset exactly to your reporting needs before the data is streamed.
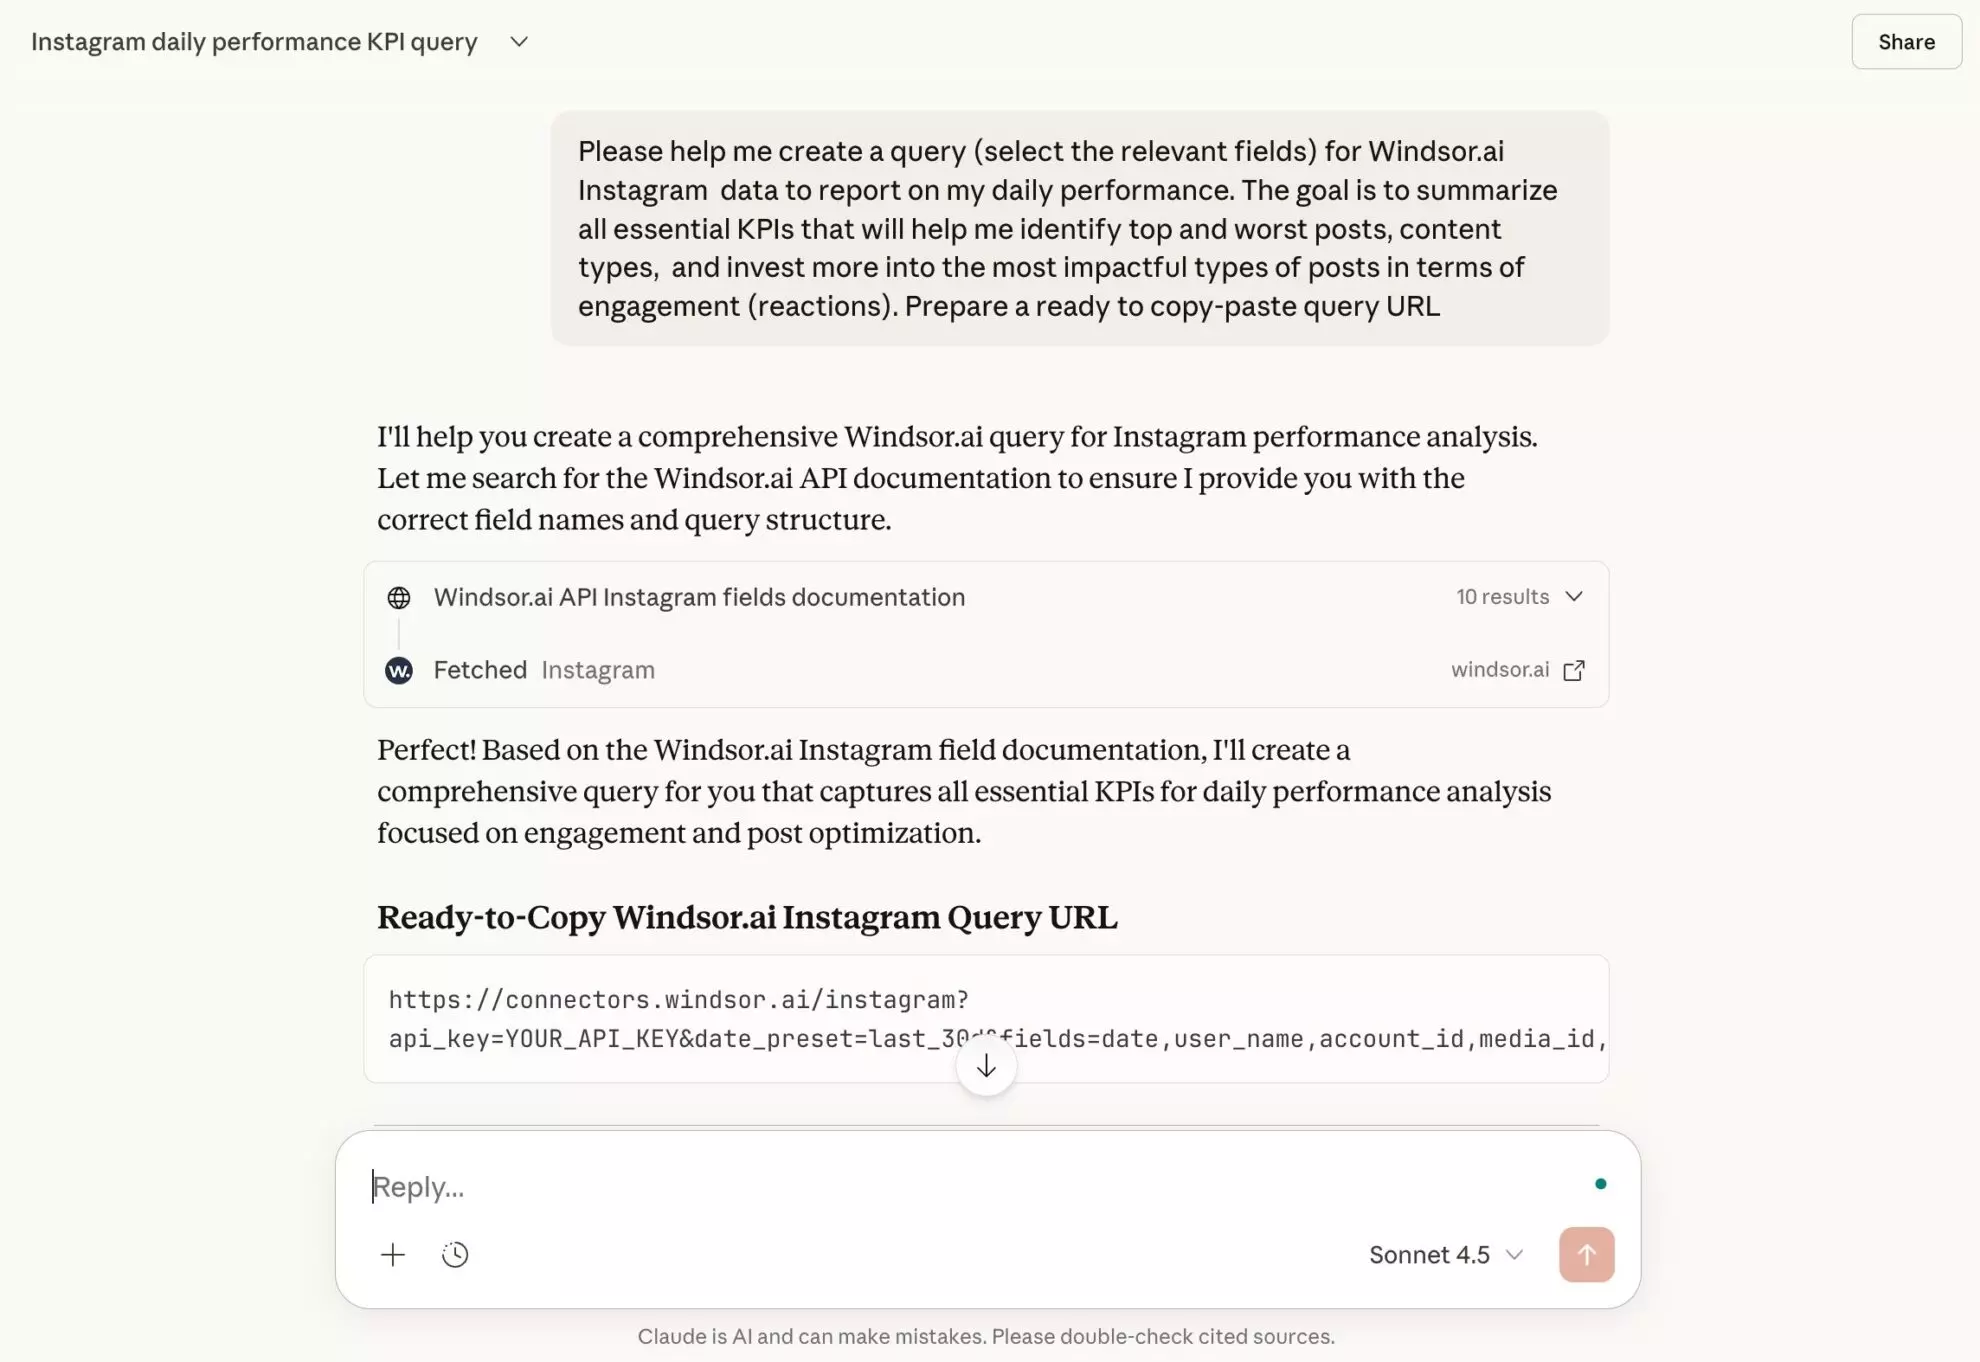
✨ Pro tip: If you’re unsure which fields to select, use Windsor MCP or AI-assisted guidance. It connects your Instagram data to AI tools like ChatGPT, Claude, and more, helping you identify the most relevant fields for your reporting use case.
Step 3. Select Google Sheets as the destination
Scroll down to the Data Destinations and select Google Sheets. That’s a dashboard for managing your Google Sheets syncs.

To stream your Instagram data to Google Sheets, click Add Destination Task.
First, you’ll be prompted to grant access to your Google account associated with Sheets and select the spreadsheet where you want to load the data.
Then, fill in the rest form details:
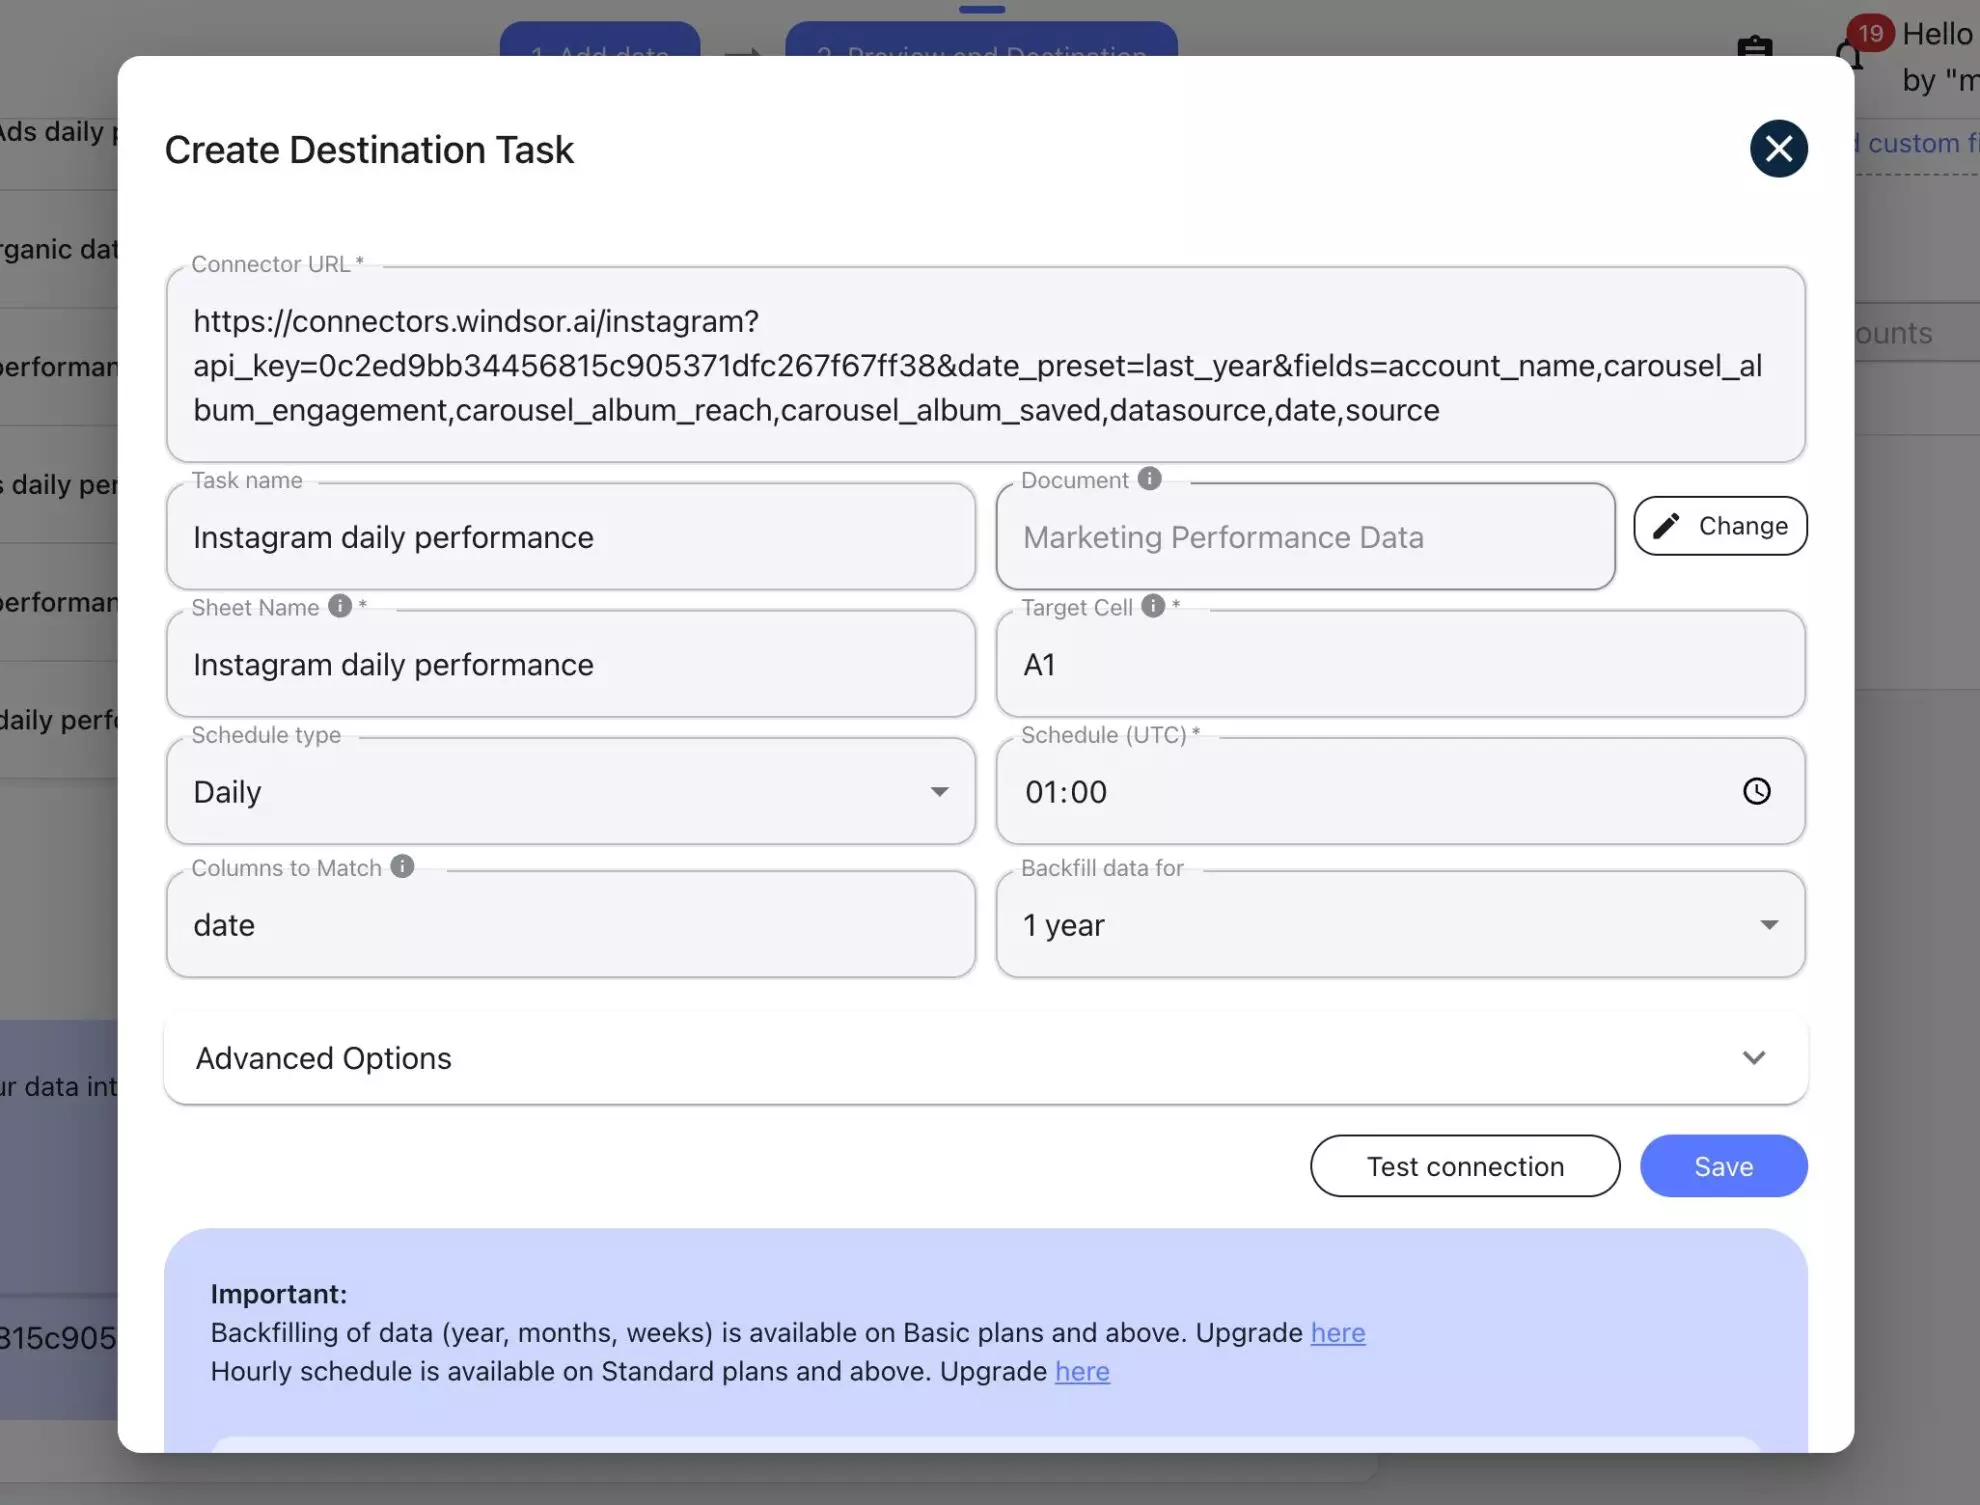
- Select the target spreadsheet and provide a name for the new sheet (tab). Windsor.ai will automatically create the tab with this name inside the selected file.
- Take a moment to review your query and confirm that all required fields and metrics are included.
- Next, enter a task name (for example, Instagram daily performance) and define the starting cell where the data should load.
- To automate updates, choose a refresh interval (daily, hourly, every 30 minutes, or every 15 minutes) and set the preferred run time.
You can also optionally enable:
- Column matching to keep existing fields aligned on every refresh
- Backfilling to pull historical data
Step 4. Activate the sync and verify your data in Sheets
After completing the setup form, click Test connection. Once the test is successful, click Save to start the sync.
The task will appear as active in the Google Sheets destinations section. A green Upload icon with an OK status confirms that the sync is running correctly.

Open your connected spreadsheet to verify that your Instagram data is loading as expected. Check that all fields are present and that the column order looks good.
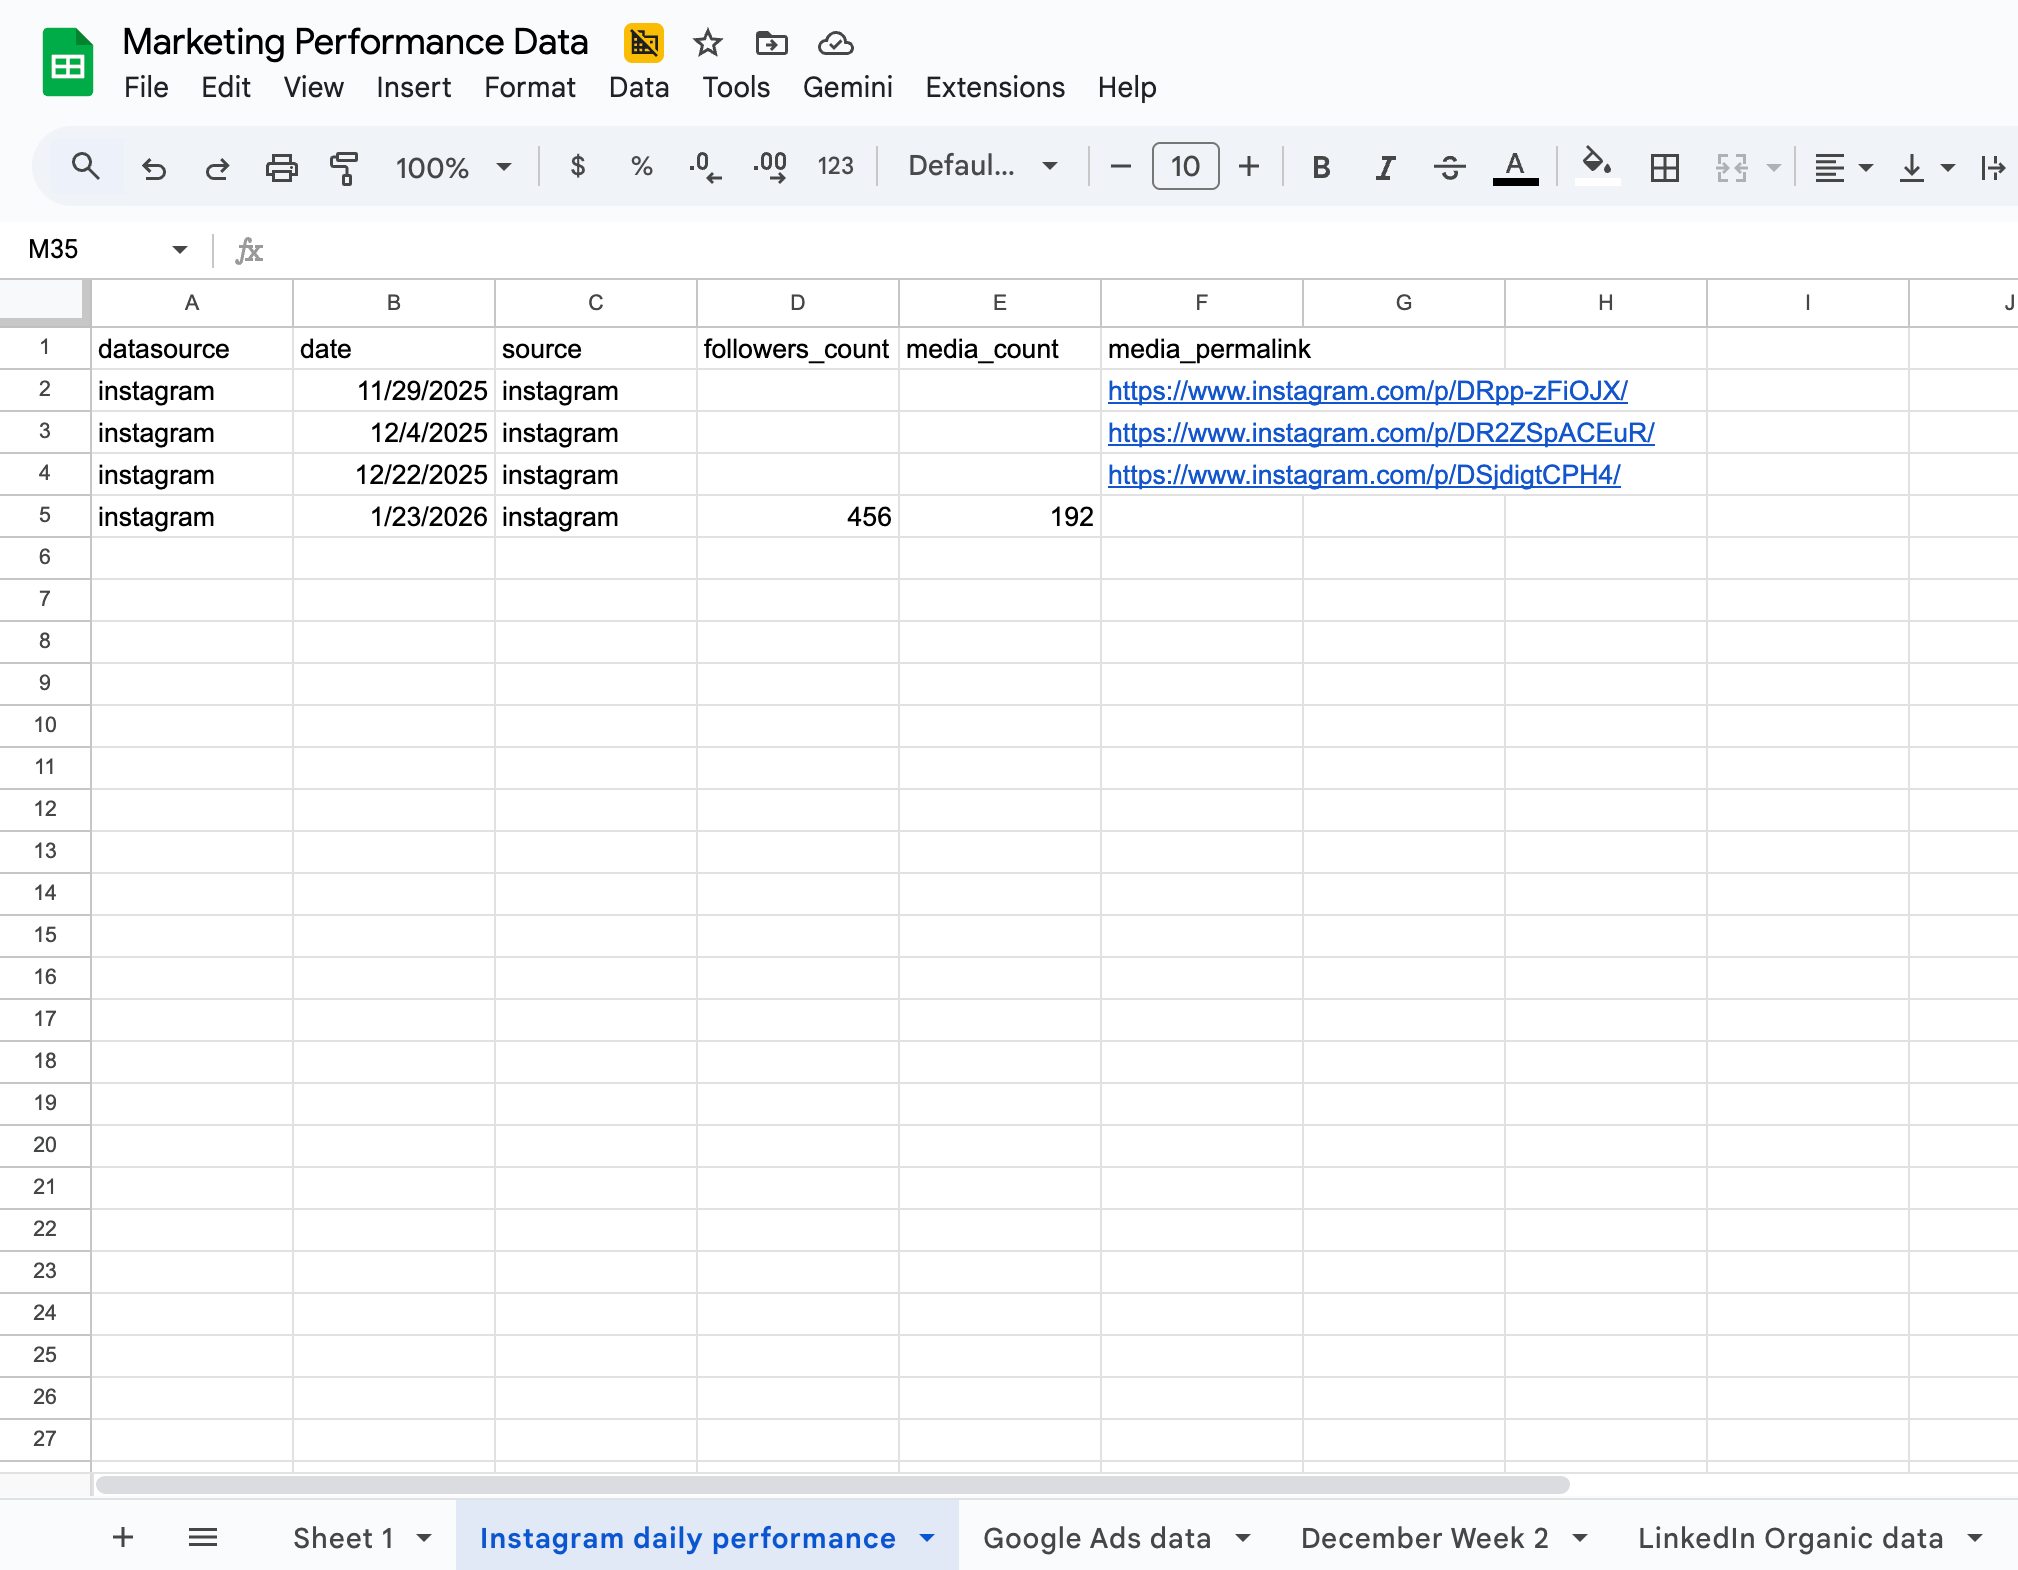
You can then create charts and graphs on top of this raw data in a separate tab. These visuals will update automatically with each scheduled sync, while preserving your pre-built structure and formulas.
Why use Windsor.ai to connect Instagram to Google Sheets
Windsor.ai removes the manual work and risk associated with Instagram reporting by providing a stable, automated data connection between Instagram and Google Sheets. Instead of copying metrics or managing CSV files, your reports stay accurate and up to date automatically through direct access to the official Instagram API.
Your data arrives in a clean, consistent structure, refreshes on a schedule you control, and includes access to historical data, making Windsor.ai an essential Instagram reporting tool. The platform’s no-code ETL/ELT approach ensures that teams without technical backgrounds can manage sophisticated data pipelines efficiently.
Key benefits of using Windsor.ai’s Instagram Google Sheets connector
- High data accuracy: Windsor pulls reach, impressions, and engagement data directly from the Instagram API, avoiding errors from manual exports and ensuring reliable reporting that matches native Instagram Insights.
- Consistent data schema: Windsor keeps column order and structure stable across refreshes, so formulas, pivot tables, and charts continue to work without rework or column-matching issues.
- Scheduled automatic refreshes: The connector updates Instagram data in a spreadsheet automatically on your schedule (every 15/30 minutes, hourly, or daily), eliminating manual reimports and reducing reporting lag.
- Historical data backfilling: You can retrieve years of past Instagram data, enabling long-term trend analysis and accurate year-over-year comparisons for strategic planning.
- Cross-channel data blending: Combine Instagram data with 325+ other platforms (Facebook Ads, Google Ads, GA4, Shopify, etc.) in the same spreadsheet for seamless cross-channel reporting and unified performance views.
All in all, instead of preparing data and maintaining spreadsheets, Windsor allows you to focus on analyzing performance and making decisions based on data you can trust.
Top Instagram metrics and dimensions to track
📝 Windsor.ai supports hundreds of Instagram metrics and dimensions directly from the Instagram API, including advanced post, story, reel, and audience insights. You can select exactly the fields you need and expand your reporting anytime without rebuilding your Google Sheets setup.
Below are the most commonly tracked metrics and dimensions, organized by category to help you build meaningful reports.
1. Account & profile metadata
Use these fields to identify the account and connect performance data to the right profile:
- Instagram user ID
- Instagram username
- Instagram user name (alias)
- Linked website
2. Time & date dimensions
These dimensions help you analyze performance trends, seasonality, and posting patterns over time:
- Day
- Week
- Month (Yearmonth)
- Year
- Day of week
- Week (ISO)
- Year–week (ISO)
3. Content performance (posts & reels)
These metrics show how individual posts perform and which content resonates best with your users.
- Post reach
- Post impressions
- Post likes
- Post comments
- Post saves
- Post shares
- Video views/plays
3. Story performance
Track how stories perform across views, interactions, and completion:
- Story impressions
- Story reach
- Story exits
- Story replies
- Story taps forward / back
- Story completion rate (derived)
4. Audience insights
Understand who your audience is and how it evolves over time.
- Follower count
- Follower growth
- Audience demographics (age, gender, city, country)
5. Real-time & current results
Useful when monitoring current performance or building live dashboards.
- Today
This list covers the most commonly used Instagram metrics, but it’s only a starting point.
Bonus: Use a pre-built Instagram Google Sheets template
A pre-built Google Sheets template helps you skip setup hassle and jump straight into reporting. The key Instagram metrics and visuals are already in place and easy to read and analyze. You just connect your data, schedule a refresh, and customize it further to fit your brand.
Don’t waste hours creating charts. Windsor.ai provides professional templates, which are instantly available for working with Instagram data in Google Sheets.
Available Windsor.ai’s Instagram Google Sheets template
🔗 Template link: Instagram Organic Google Sheets Dashboard Template.

This free Instagram Organic Google Sheets template helps you automatically track and visualize key performance metrics such as follower growth, reach, engagement, and post performance in one centralized, auto-refreshing spreadsheet.
The dashboard is structured into intuitive sections that cover audience growth, top-performing posts, content performance by format, and audience insights. This makes it easy to spot trends, understand what content drives engagement, and refine your Instagram strategy using reliable, up-to-date data directly inside Google Sheets.
How to use this template:
- Open the template and make a copy of this file.
- Connect your data by following the instructions in the tab Instructions.
- Sync a refresh and load data; get your real metrics replace the placeholders.
- Customize the dashboard with your colors and logo. You can also adjust the charts and raw metrics.
This is the fastest way to transfer Instagram data to Google Sheets in a ready-to-use dashboard.
Challenges of manual Instagram reporting
Manual Instagram reporting is fragile and poses continuous risks. Even minor mistakes can compound over time and undermine confidence in the information. Reports lag behind actual performance and hide significant changes.
Due to these manual Instagram reporting challenges, it takes marketing teams more time to fix dashboards than to generate insights:
- High risk of errors: Copying and pasting data leads to small mistakes that compound over time and may suddenly break an entire report, affecting downstream analysis and business decisions.
- Time wasted on manual operations: Teams spend more time exporting and cleaning data, organizing spreadsheets, and fixing dashboards than analyzing performance and optimizing decisions.
- Version control issues: Multiple copies of the same report exist across folders, making it unclear which version is the most recent one or which data is authoritative.
- Data latency: Manual exports quickly become outdated, hiding sudden spikes or drops in engagement and delaying critical reactions to performance changes or campaign shifts.
- Broken dashboards: Changes in CSV structure can break formulas, pivot tables, and charts without warning, requiring manual fixes and creating reporting blind spots.
- Authentication headaches: Users often encounter expired tokens, permission errors, and OAuth issues when reconnecting Instagram to third-party tools, disrupting reporting workflows.
Windsor.ai eliminates all these risks and inefficiencies by automating data integration directly from the Instagram API into Google Sheets. Your reports self-update on a schedule, maintain a consistent structure, and stay accurate without continuous manual exports or data cleanup.
Troubleshooting common issues
Even with automated connectors, occasional issues can occur during setup or refresh. Here are quick fixes for the most common problems when importing Instagram data into Google Sheets.
Authentication errors (401/403)
Cause: Expired access token, missing permissions, or insufficient account role.
Fix:
- Ensure your Instagram account is a Business or Creator account properly linked to a Facebook Page.
- In Windsor.ai, go to your Instagram data source and re-authenticate to refresh the token.
- During the Instagram login prompt, ensure all requested permissions are checked.
- If previously denied, remove the app integration in Facebook Settings -> Business Integrations and try again.
- Use an incognito/private browser window to avoid cache conflicts.
No data returned or empty query results
Cause: Incorrect date range, account with insufficient engagement, or metrics not available for the selected period.
Fix:
- Verify that the date range selected has active data (some metrics require at least 100 engagements in the period).
- Check that your Instagram account has posts and stories during the selected timeframe.
- For demographic metrics (audience age, gender), ensure the account meets Instagram’s minimum engagement thresholds (100+ interactions).
Data field changes or missing columns
Cause: Instagram deprecated certain metrics (e.g., “Reel plays” replaced by “Views” in 2025/2026).
Fix:
- Update your query to use the latest metric names (e.g., replace impressions with views).
- Review Windsor.ai’s updated field list in the connector to align with Meta’s latest API version.
Rate limits or API throttling
Cause: Too many requests in a short period (Instagram API has hourly rate limits).
Fix:
- Space out manual query runs or reduce refresh frequency temporarily.
- Windsor.ai manages rate limits automatically, but custom scripts or frequent manual refreshes may trigger throttling.
If you continue to experience issues, reach out to Windsor.ai support or check the Windsor.ai documentation for updated troubleshooting guides.
Conclusion
Automating Instagram reporting in Google Sheets gives you constant access to clean, structured, and reliable insights. Instead of chasing files or fixing broken reports, your data stays organized and ready for analysis, making near-real-time tracking and long-term performance reviews much easier.
Windsor.ai turns your Instagram data into a dependable reporting system through a direct connection to the official Instagram API. This ensures your setup remains accurate, stable, and scalable as your reporting needs grow.
Stop spending hours on manual exports and spreadsheet maintenance. Automate your Instagram reporting and make confident, data-driven decisions.
👉 Replace manual Instagram reporting with an automated, reliable pipeline using Windsor.ai. Try it now with a 30-day free trial: https://onboard.windsor.ai/app/instagram.
FAQs
How do I integrate Instagram data into Google Sheets automatically?
Use an automated data connector like Windsor.ai. It extracts data from the Instagram API under the hood and allows you to automatically load it into a spreadsheet through a simple Google Sheets add-on with a user-friendly interface.
Other Instagram to Google Sheets integration methods include manual CSV exports or custom API scripts, but these approaches are slower, error-prone, and harder to maintain.
Can I track the performance of reels, posts, and carousels?
Yes. Windsor fetches performance metrics for all media types. You can import diversified Instagram Insights into Google Sheets, including post and carousel engagements.
Is this solution beginner-friendly?
Yes. If you’re familiar with Google Sheets, you can set this up easily. The standard setup takes about four minutes and involves no code.
How often does data refresh?
You control the refresh schedule when importing Instagram data into Google Sheets. Most teams refresh daily, but you can schedule updates hourly or every 15/30 minutes.
Can I customise the dashboards with the loaded data?
Yes. This is one of the main advantages of using Google Sheets. You can modify charts, formulas, layouts, and formatting to match your reporting needs. Windsor preserves the structure of all your pre-built elements without breaking things.
Is historical data supported?
Yes. Windsor lets you backfill historical Instagram data, enabling analysis of trends from previous months or even years.
Does this connector include paid ads?
Windsor.ai’s Instagram Insights connector focuses on organic Instagram data. To access Instagram Ads data, you have to use our Meta Ads connector. You can further combine organic and paid data in a single blended report.
Is Windsor.ai secure?
Yes. Windsor.ai uses OAuth 2.0 for authentication and does not store or access your Instagram or Facebook passwords. The platform follows industry-standard security practices.
Can multiple accounts be connected?
Yes. Windsor offers multi-account support for agencies. You can connect multiple Instagram accounts and import them into one or separate spreadsheets.
Are Windsor.ai’s templates free to use?
Yes. All our templates are free to use. You only need a Windsor.ai account to keep the data synced, and you can start with a trial to test it.

