 AI insights
 About us
 Careers
 Security
 Customer reviews
 Contact us
 Affiliate program
 Solution partners
 Looker Studio templates
 Tableau templates
 Facebook Ads templates
 Google Ads templates
 Data fields & Metrics
 AI prompt library & Guides
 Product documentation
 API documentation
 Case studies
 Blog
Blog Data models
 Windsor vs Supermetrics
 Windsor vs Fivetran
 Windsor vs Portermetrics
 Last updated: 15 April 2026

Google Sheets is a core reporting and analytics tool for many teams, supporting performance monitoring and client-ready dashboards in a flexible, collaborative environment.
However, most Google Sheets reporting workflows still rely on CSV exports, which become difficult to manage as the number of data sources and accounts grows. Manual updates introduce delays, increase the risk of errors, and demand ongoing maintenance.
A more efficient approach is to automate Sheets data integration using no-code connectors. The Supermetrics Google Sheets add-on is a popular choice, but as reporting scales, its limitations, particularly high costs, become apparent.
This leads many users to seek Supermetrics alternatives for Google Sheets, with Windsor.ai emerging as a top solution.
In this guide, we’ll compare the Supermetrics and Windsor.ai Google Sheets add-ons side-by-side, examining features, setup complexity, and cost-to-value ratio, helping you choose the best-fit tool for your needs.
What is Supermetrics for Google Sheets?
Supermetrics is a data integration platform that provides a Google Sheets add-on for importing data from marketing and analytics platforms into spreadsheets.
The core value of Supermetrics lies in automating repetitive data pulls that would otherwise require manual data aggregation and CSV exports. Once the pipeline is configured, data is refreshed directly inside Google Sheets based on the selected schedule and plan limits.
How does the Supermetrics Google Sheets add-on work?
Supermetrics handles data import right inside Google Sheets through a native Supermetrics Google Sheets add-on (extension).
The process involves authenticating data sources before the import and connecting them to spreadsheets through the add-on.
Users configure data sync through the Supermetrics extension by building queries, where they select data sources, metrics, dimensions, date range, and refresh interval. The add-on then pulls data directly into cells based on the defined query and refresh schedule.

How to integrate data into Google Sheets using the Supermetrics connector
Users can connect their data to Google Sheets with Supermetrics by following these steps:
- Install the Supermetrics Google Sheets extension from the Google Workspace Marketplace.
- Authenticate one or more platforms from the sidebar.
- Create queries by selecting metrics, dimensions, and filters, and load the data into a spreadsheet.
- Set up a data refresh and triggers.
Common use cases of the Supermetrics Google Sheets connector
Supermetrics for Google Sheets is typically used for the following reporting scenarios:
- Creating marketing performance reports to track spend, conversions, and ROI across channels.
- Building campaign monitoring dashboards that self-update automatically and show the latest KPIs.
- Generating client-facing reports to support collaboration, performance evaluation, and data-driven decision-making.
These use cases are effective in basic reporting setups, but may require reevaluation as the number of data sources, accounts, or transformations grows.
Architectural scope
Supermetrics follows an add-on–based, Sheets-first architecture. All data extraction, transformation, and refresh logic is managed inside Google Sheets itself. There is no centralized layer where datasets are prepared once and reused across multiple destinations.
This approach aligns well with spreadsheet-driven workflows but can become restrictive as reporting setups grow in complexity or require reuse across teams and tools.
Supported platforms
Supermetrics integrates with several categories of platforms that are commonly used for marketing and performance reporting, including:
- Advertising platforms, such as paid media and campaign management tools.
- Analytics tools used for traffic, engagement, and conversion tracking.
- Social media platforms used for content performance and audience reporting.
- Other tools related to e-commerce, accounting, sales, CRM, HR, and additional business functions.
The availability of specific connectors varies by pricing tier, with certain data sources accessible only on Enterprise plans.
Pricing and plan limits
Supermetrics relies on the tiers + paid add-ons pricing model, where access and capacity increase as you move up tiers. Each plan is designed to support a specific level of reporting complexity and usage.

Superemtrics’ plans include clear limits that define how much data and how many users the setup can support, applied across several dimensions:
- Data sources (connectors): Lower-tier plans provide access to a limited pool of data sources, while many premium connectors are available only on the Enterprise plan.
- Accounts per data source: Each data source supports a limited number of connected accounts by default.
- Account changes: Changes to connected accounts are capped at up to 10 per data source, regardless of the selected plan.
- Users: The number of users who can access and manage reports is restricted across all plans, including the Pro tier.
- Destinations: Google Sheets is included as a core destination on all plans. Access to additional destinations is limited, with database and data warehouse destinations (such as BigQuery or Snowflake) available only to Enterprise clients.
- Data refresh frequency: Hourly data refreshes are supported only on Pro and Enterprise plans, with lower tiers offering weekly or daily updates.
Adding additional connectors, accounts, or users generally involves plan upgrades or add-on costs. Although Google Sheets is available as a core destination, the majority of data sources and destinations are restricted to higher-tier plans.
For example, access to data warehouses is gated behind enterprise-level plans. This structure means that scaling beyond Google Sheets or consolidating data across multiple tools typically requires higher-tier subscriptions rather than incremental adjustments within the same plan.
As reporting requirements grow in complexity, these structural limitations often prompt teams to reassess whether Superemtrics pricing for Google Sheets remains the best fit. In particular, organizations managing multiple data sources, destinations, and client accounts tend to prioritize flexibility and predictable scaling costs.
For this reason, many marketing and data teams explore more flexible ELT platforms, such as Windsor.ai, which enable more cost-efficient scaling while providing broader functionality for Google Sheets integrations.
👉 Learn more: Why marketing and data teams are switching from Supermetrics to Windsor.ai.
🔎 Case study: How Omnicom Media Group Hong Kong replaced Supermetrics with Windsor.ai and saved 35K+ annually: https://windsor.ai/case-studies/omnicom-media-group-hong-kong/.
What is Windsor.ai for Google Sheets?
Windsor.ai is a no-code ELT/ETL data integration platform that automates the collection of data from 325+ sources and delivers it to reporting & analytics tools in a normalized, analysis-ready format.

It is designed for teams looking to eliminate manual data handling while maintaining predictable costs as data sources, accounts, and destinations scale.
This flexibility comes from treating Google Sheets as one destination within a broader data pipeline. Data is extracted from source platforms, normalized within Windsor.ai, and then delivered to Google Sheets or other supported tools.
As a result, teams can keep reporting workflows simple and consistent while distributing the same data to Google Sheets and additional destinations without duplicating setup or reprocessing logic.
Platform positioning
Windsor.ai is positioned as a general-purpose data pipeline platform for marketers and data teams rather than a spreadsheet-only add-on. It handles data extraction, normalization, and delivery without requiring custom scripts or engineering work, making it suitable for both basic and advanced reporting setups.
Because data pipelines are built centrally, Windsor.ai can support spreadsheet-first workflows while also expanding them into warehouses, BI tools, and AI-driven environments.
Core capabilities
Windsor.ai supports 325+ data sources, covering categories such as advertising platforms, analytics tools, CRM systems, and other data sources widely used by modern businesses.
That data can then be delivered to more than 20 supported destinations, including:
- Google Sheets for operational reporting, dashboards, and collaboration.
- Databases and data warehouses for centralized storage and advanced analysis.
- BI tools for visualization and dashboarding outside spreadsheets.
- AI platforms for conversational analytics and instant AI-powered insights.
How Windsor.ai handles Google Sheets integrations
Windsor.ai supports automated data import into Google Sheets in two ways:
- Using the Windsor.ai Google Sheets add-on: Users can pull data directly into spreadsheets using the Windsor.ai add-on, where they build queries right in the Google Sheets interface. The workflow is very similar to Supermetrics, which makes it straightforward for teams familiar with Supermetrics to migrate to Windsor.ai.
- Using the in-app destination tasks: Google Sheets can also be configured as one of multiple destinations within Windsor.ai’s centralized data pipeline. In this setup, the same dataset can be delivered simultaneously to Sheets and other destinations, ensuring consistent data across various reporting tools.
💡 This dual approach allows Windsor.ai to operate both as a Google Sheets add-on and as a complete data pipeline platform. Teams can begin by delivering data to Google Sheets and later scale to additional destinations without needing to rebuild integrations. This flexibility is often sought by teams exploring Supermetrics alternatives for Google Sheets.
How to import data into Google Sheets using Windsor.ai
Method 1: Using the Windsor.ai Google Sheets add-on
This method uses a native Google Sheets add-on to pull data directly into spreadsheets. The process is similar to Supermetrics and is designed for teams that prefer to work entirely inside Google Sheets.
Because everything runs inside Google Sheets, users control data selection, placement, and refresh behavior directly from the spreadsheet. This keeps setup and ongoing report management within a Sheets environment.

Setup steps
A standard setup using the Windsor.ai Google Sheets add-on follows a clear sequence:
- First, install the Windsor.ai Google Sheets add-on from the Google Workspace Marketplace.
- Next, connect the required data source(s) in the Windsor.ai app and select the account(s) from which you want to export data into Google Sheets.
- Then, open the Windsor.ai extension in Google Sheets and add a new query: select the data source(s), account(s), metrics, dimensions, date range, and optionally filters, to include in the report.
- Schedule an automatic refresh (daily, hourly, every 15/30 minutes) to keep the spreadsheet up to date.
- Load the selected data into Google Sheets.
Method 2: Using the in-app destination task → Google Sheets
The second method uses Windsor.ai’s in-app destination tasks to configure data pipelines outside the spreadsheet. Data sources, transformations, and delivery rules are defined centrally in the Windsor.ai application, with Google Sheets selected as one of the output destinations.
Setup steps
Windsor allows you to send your data from one or multiple channels right from the app in a few simple steps:
- Connect your desired data source(s) in the Windsor.ai app and select the account(s) for reporting.
- Customize your dataset before export by defining the date range, selecting data fields, and applying optional filters. You can also use a Blended Data source to send the unified data from multiple channels.
- Choose Google Sheets as the data destination and create a destination task. Fill in the following details:
- Task name: Any descriptive name (e.g., Facebook Ads Audience Insights).
- Document: Specify the existing spreadsheet or select it via the pencil button.
- Sheet name: Choose an existing tab or create a new one.
- Target cell: Select the starting cell for data insertion (A1 notation).
- Schedule type (refresh period): Set how often data should update (e.g., hourly, daily, every 15/30 minutes).
- Columns to match: Choose unique columns (e.g., id, date, campaign) so that each sync updates the corresponding row, preventing duplicates.
- Backfill: Optionally backfill historical data for long-term analysis.
- Advanced options (optional) – Google Sheet Query ID: Automatically generated when a query is created in your Google Sheets document.
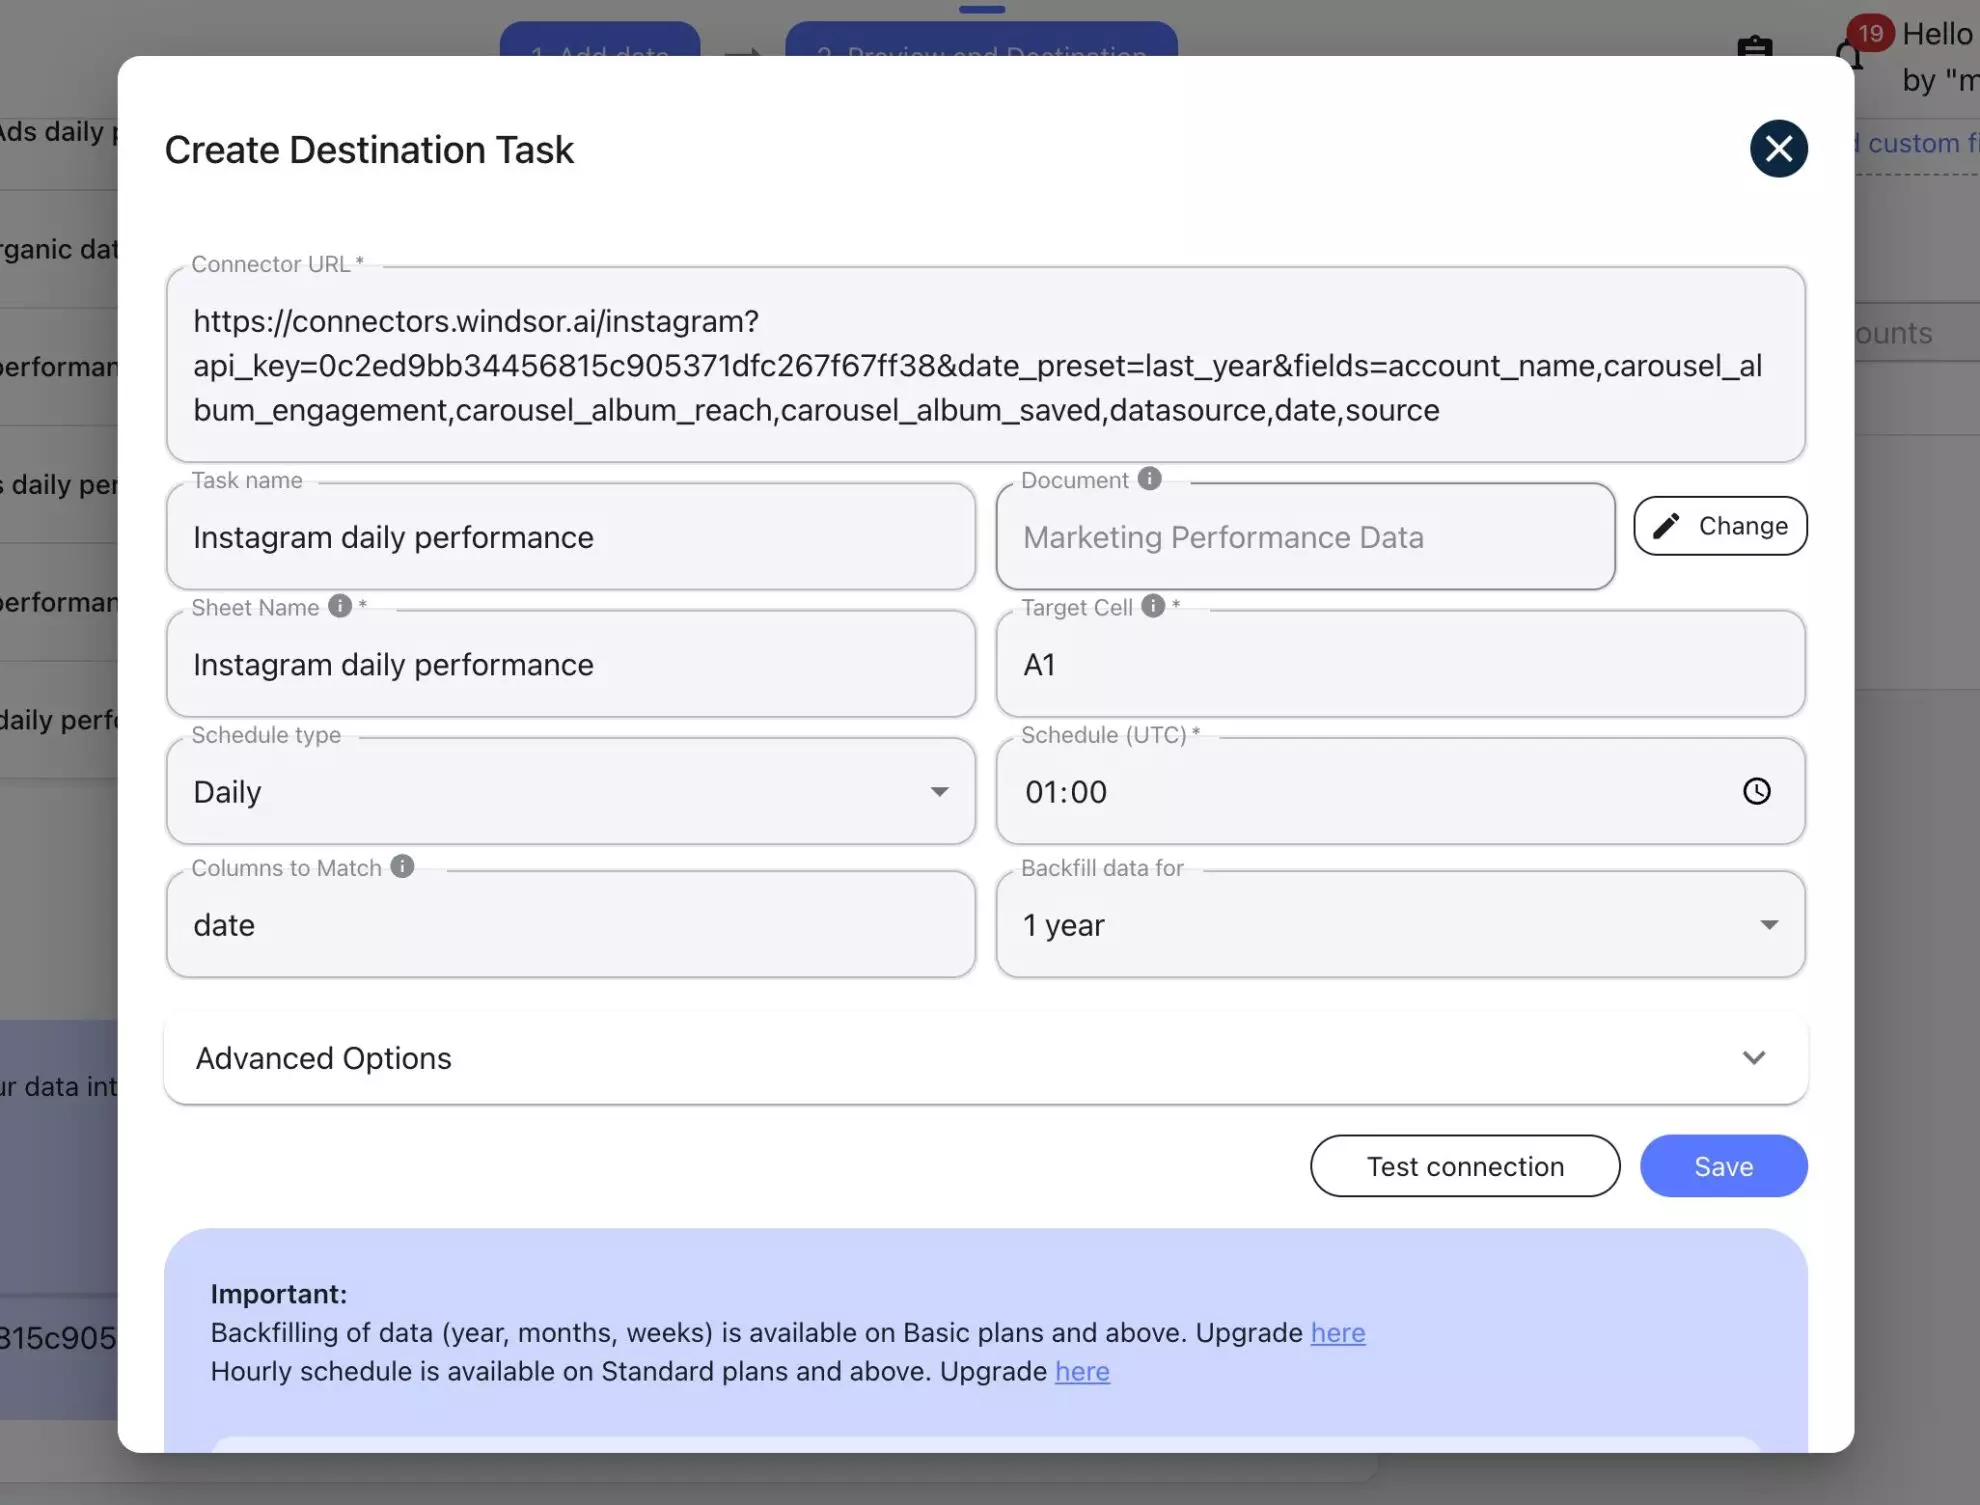
Save the task and see the data start auto-populating in your connected spreadsheet.
Once configured, the same pipeline sends data to Google Sheets automatically, without requiring queries to be built inside the spreadsheet. You can make changes to sync configurations (whether modify the fields, data range, or refresh interval) right in this task anytime.
This shifts report management out of individual sheets and into a centralized dashboard as usage grows.

This setup is well-suited for agencies and larger teams that manage multiple accounts, and for teams comparing Windsor.ai vs Supermetrics for Google Sheets when delivering data to more than one destination.
Supportive documentation and guides
Windsor.ai provides official documentation that explains how to integrate data into Google Sheets in both ways, covering setup, configuration, and refresh options.
For practical examples, there is also a step-by-step guide that walks through importing Facebook Ads data into Google Sheets, showing the full process from account connection to scheduled updates.
You can also watch a video tutorial for visual guidance and walkthroughs:

Feature comparison: Windsor.ai vs Supermetrics for Google Sheets
This section compares Windsor.ai and Supermetrics specifically for Google Sheets data integration. The focus is on features that affect setup, cost, and scalability, rather than on individual connectors or niche use cases.
When teams evaluate Google Sheets data integration tools, the following factors typically determine long-term fit:
- Starting price and overall pricing model
- Number of supported data sources and how access varies by plan
- Google Sheets support and add-on availability
- Data refresh frequency options
- User and account limits
- Support for additional destinations
- Availability of a free plan or trial
- How limits apply as usage grows across users, accounts, and clients
- Social proof and user reviews
Let’s compare Windsor and Supermetrics based on these essential parameters now.
Pricing model and starting price
Windsor.ai offers a predictable pricing model where all connectors and destinations are included in every plan, starting at $19 per month. All plans include unlimited users and generous account limits with no need to purchase paid add-ons as your reporting needs grow.
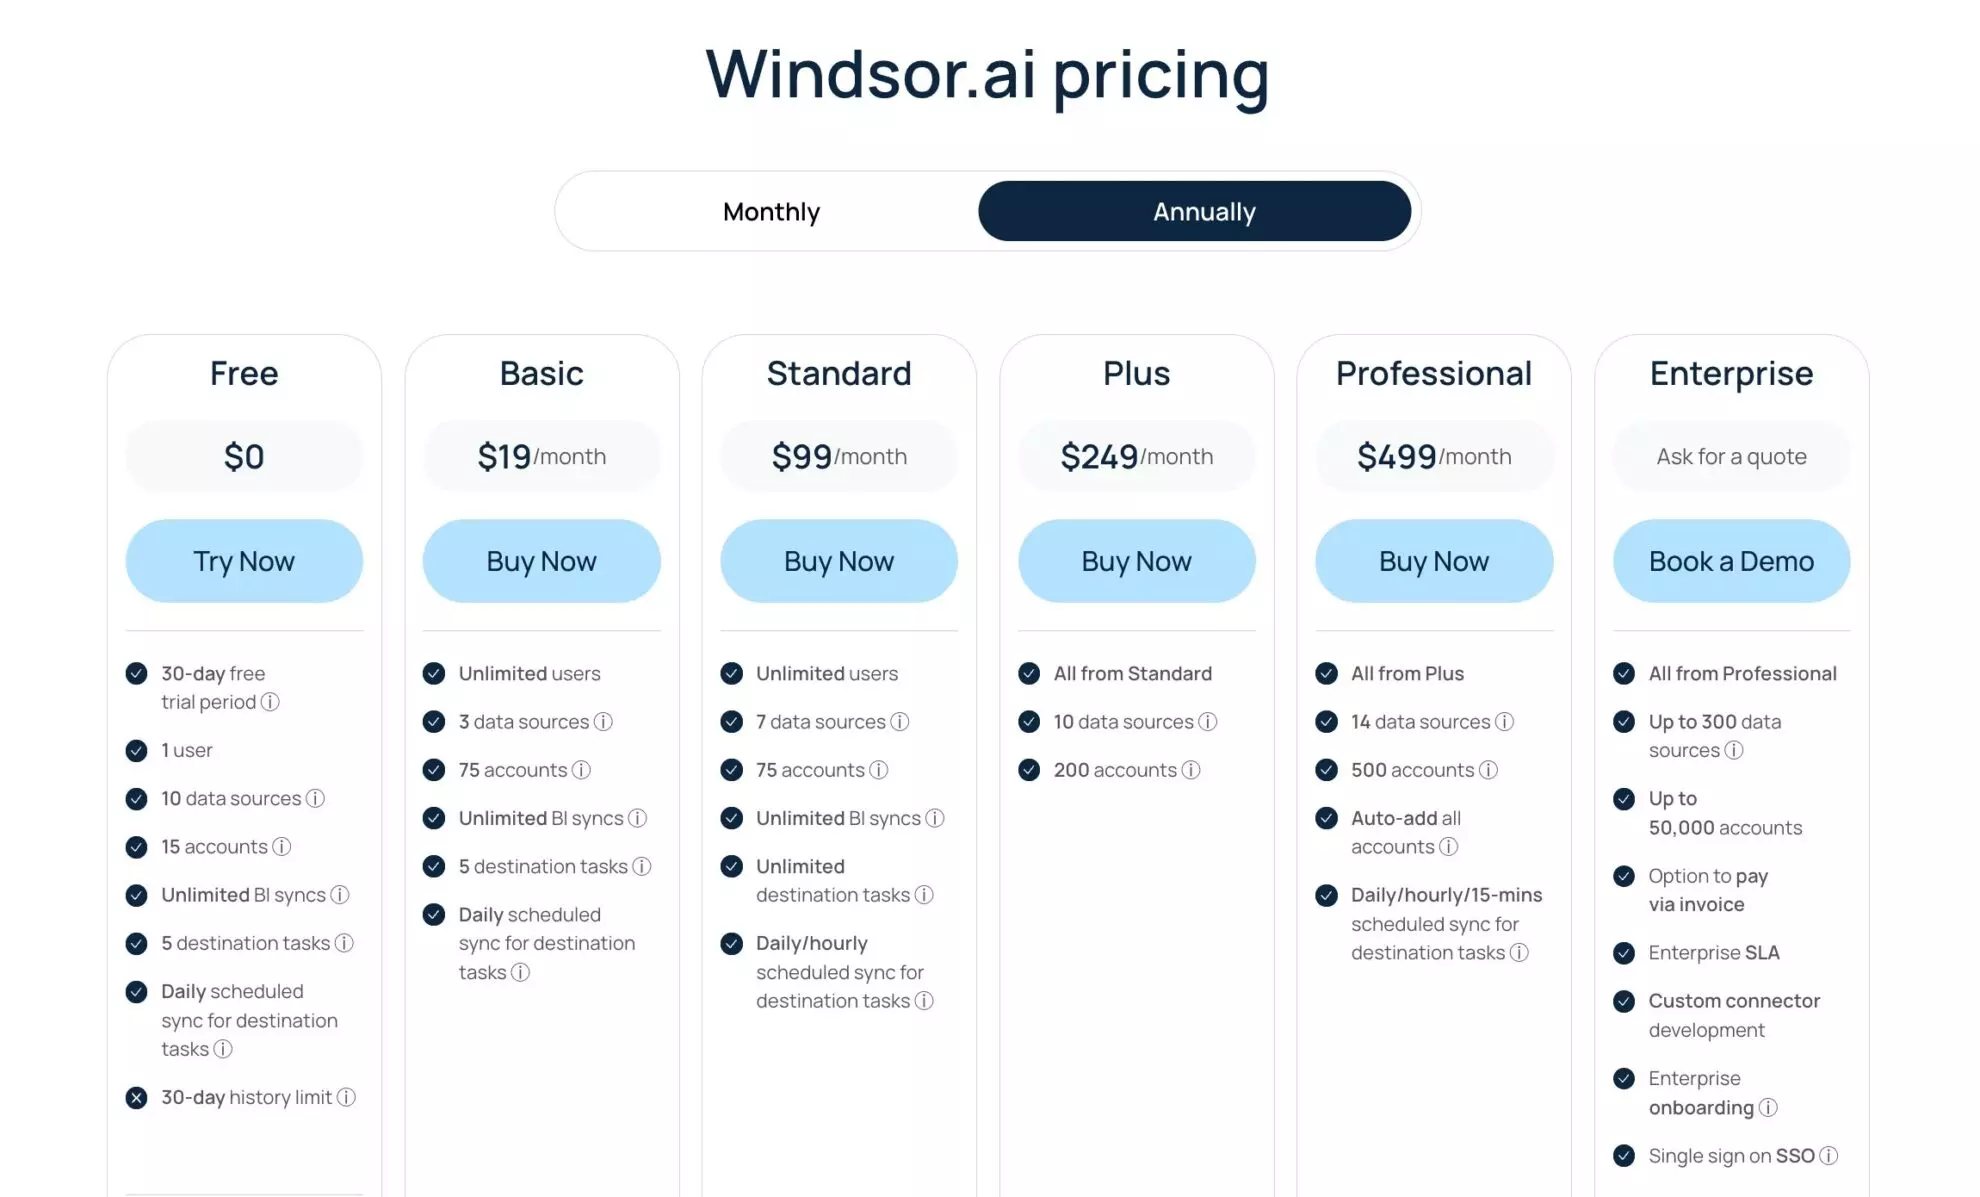
Supermetrics uses a tiered pricing structure with stricter limits and numerous paid add-ons. As reporting scales, adding connectors, increasing refresh frequencies, supporting more users, or accessing advanced destinations usually require upgrading to higher-priced plans, which can affect both cost and flexibility over time.
Free plan or trial availability
Both platforms provide a free trial to evaluate the service before committing to a paid plan:
- Supermetrics: 14-day free trial
- Windsor.ai: 30-day free trial
👉 Start your Windsor.ai free trial and get automated Google Sheets reporting in minutes: https://onboard.windsor.ai/.
How limits apply as usage scales
Supermetrics and Windsor.ai differ significantly in how access and capacity are structured across plans, which can impact scaling, multi-account reporting, and team workflows.
Supermetrics:
- Data source access: Varies by plan, with some premium connectors available only on the Enterprise tier.
- Accounts per data source: Limited (up to 10), which can constrain multi-account and client reporting.
- User access: Capped by plan, restricting how many team members can manage or edit reports.
- Refresh frequency: Determined by plan; low-tier plans may offer only weekly refreshes, while higher frequencies require higher-tier plans.
- Database destinations: Access to data warehouses is restricted to Enterprise-level plans.
Windsor.ai:
- Full connector access: All plans include the entire catalog of connectors.
- User access: Unlimited across all plans.
- Accounts per data source: No limits, with unrestricted account changes in every connector.
- Refresh frequency: Starts from daily, with advanced options for hourly or near-real-time (every 15–30 minutes).
- Destinations: All destinations, including data warehouses, are available in every plan.
- Multi-account and multi-client reporting: Managed centrally through destination tasks, eliminating the need for individual spreadsheet queries.
These structural differences are particularly important for agencies and larger teams evaluating Supermetrics or Windsor.ai for Google Sheets reporting, especially as reporting needs grow and workflows become more complex.
Social proof/ user reviews
Both tools have established user bases and verified reviews on G2.
Windsor.ai holds an average rating of 4.6 out of 5, with user reviews frequently pointing to predictable pricing, broad connector coverage, and support for multi-account reporting without repeated plan upgrades.
Supermetrics, on the other hand, has an average rating of 4.4 out of 5, with reviews commonly highlighting its spreadsheet-focused workflow and noting that plan limits become more restrictive as usage expands.
Windsor vs Supermetrics for Google Sheets: Summary comparison table
| Feature | Supermetrics | Windsor.ai |
|---|---|---|
| Google Sheets add-on | Yes | Yes |
| Centralized Google Sheets pipelines (in-app flow) | No | Yes |
| Data sources | 170+; availability varies by plan, as there are many premium connectors | 325+ data sources available across all plans |
| Pricing model | Tiered + paid add-ons | Predictable, flat pricing |
| Refresh frequency | Weekly, daily, hourly | Daily, hourly, every 15/30 minutes |
| Database destinations | Available on the custom Enterprise plans | Included in all plans |
| User limits | Limited by plan | Unlimited users; designed for team use |
| Account limits | Account limits apply per plan and per data source (up to 10 account changes) | Supports unlimited accounts and account changes per data source |
| Starting price | $37/month | $19/month |
For teams evaluating Supermetrics add-on alternatives for Google Sheets, this comparison highlights the differences in pricing structure, usage limits, and scaling behavior, especially important as reporting grows beyond a small number of spreadsheets or accounts.
Windsor vs Supermetrics real-world use cases (Google Sheets focused)
The examples below illustrate how Google Sheets reporting is handled via Windsor.ai and Supermetrics in different real-world setups, highlighting differences in cost and provided functionality.
Use case 1: Solo marketer (or a small team) using a few Google Sheets dashboards
A PPC specialist tracks campaign performance across multiple platforms (Meta Ads, Google Ads, TikTok Ads) and 30 accounts (approximately 10 per data source) using Google Sheets dashboards for daily monitoring.
| Feature/consideration | Windsor.ai | Supermetrics |
|---|---|---|
| Plan & cost | Basic plan: $19/month | Pro plan: $475/month (or add-ons for lower tiers) |
| Data sources | Access to all three platforms is included | Lower-tier plans may restrict connectors; full access requires Pro or add-ons |
| Accounts per data source | Reporting covers up to 75 accounts | Limited to 7 per data source on lower tiers; higher tiers required for more accounts |
| Refresh frequency | Daily refreshes included | Weekly refreshes on lower tiers; higher frequencies require Pro plan |
| Setup & management | Straightforward; accounts and destinations managed directly via the platform or Google Sheets add-on | Setup constrained by plan limits; requires separate queries or add-ons to manage multiple accounts and platforms |
Use case 2: Agency managing 100+ client accounts
An agency of seven people manages reporting in Google Sheets for dozens of clients, each with multiple ad accounts across different platforms and requiring hourly data refreshes.
As the client base grows, maintaining separate queries in each spreadsheet becomes increasingly time-consuming and costly. Reporting logic is often duplicated across dozens of individual sheets, making updates difficult and increasing the risk of errors.
A more efficient approach uses a centralized data source that connects multiple accounts at once, with predictable pricing and scalable refresh schedules. This setup centralizes reporting logic, reduces manual work, and minimizes errors.
| Feature/consideration | Windsor.ai | Supermetrics |
|---|---|---|
| Multi-account reporting | Supports up to 200 accounts per data source; the central pipeline allows a single setup for dozens of clients | Limited accounts per data source (up to 10); requires separate queries for additional clients |
| Users | Unlimited users allowed | Up to 3 users, even on the Pro plan |
| Centralized reporting logic | In-app destination tasks consolidate pipelines; changes apply across all connected reports | Reporting often requires individual sheet queries; updates must be applied per spreadsheet |
| Cost | Plus plan: $249/month | $500+/month |
| Refresh frequency | Hourly refreshes | Hourly refreshes are only available on the Pro plan |
| Setup complexity | One-time pipeline setup supports multiple destinations and accounts | Setup grows increasingly complex as clients/accounts increase; duplicate queries are needed per sheet |
| Error reduction/ maintenance | Centralized management reduces manual errors | Manual duplication increases the potential for errors |
Use case 3: Enterprise using Sheets and BigQuery
An enterprise team relies on Google Sheets for operational reporting and collaboration, while using BigQuery for advanced analytics and long-term data storage.
Google Sheets provides day-to-day visibility for teams, while BigQuery supports deeper analysis, dashboards, and historical reporting.
Using a shared data pipeline ensures both tools draw from the same underlying dataset, avoiding duplicated setups and maintaining consistent data across platforms.
| Feature/consideration | Windsor.ai | Supermetrics |
|---|---|---|
| Multi-destination support | Google Sheets, BigQuery, and all other destinations are included in all plans | Database destinations such as BigQuery are available only on Enterprise plans |
| Centralized reporting logic | Single pipeline feeds multiple destinations; changes propagate automatically | Reporting logic must often be duplicated between Sheets and BigQuery |
| User access | Unlimited users supported across plans | Limited by plan; enterprise plans are required for large teams |
| Account limits | Unlimited accounts per data source | Enterprise plans are required for scaling beyond default account limits |
| Refresh frequency | Hourly or near-real-time refreshes available | Hourly or advanced refreshes only on Enterprise plans |
| Setup complexity | One centralized pipeline manages multiple destinations and accounts | Setup is more complex, often requiring separate configurations for Sheets vs BigQuery |
| Cost | Depends on data volume and refresh frequency: Standard ($118), Plus ($249), Pro ($499), or Enterprise (custom quote) | Enterprise-level plans required, typically $1,500–$2,500/month |
Conclusion: Which Google Sheets add-on should you choose?
Both Supermetrics and Windsor.ai offer native Google Sheets connectors, but they are built on different architectures.
Supermetrics is optimized for spreadsheet-only reporting, with plan-based limits that govern the number of users, accounts, connectors, and destinations. This approach works well for contained setups but introduces constraints as reporting needs expand.
For teams seeking a Supermetrics-style Google Sheets add-on with more flexible pricing, broader connector access, and a scalable, centralized architecture, Windsor.ai provides a stronger solution.
As reporting grows, the difference becomes clear: removing connector gating, user limits, and destination restrictions makes Windsor.ai a better fit for agencies and organizations that need to scale efficiently across multiple clients, accounts, and destinations.
🚀 Experience scalable, centralized Google Sheets reporting with Windsor.ai, start your free trial today: https://onboard.windsor.ai/.
FAQs
What are the top tools for automated data import into Google Sheets?
Windsor.ai and Supermetrics are two of the most commonly used tools for automated data import into Google Sheets. Supermetrics focuses on spreadsheet-first reporting through its add-on, while Windsor.ai combines a Google Sheets add-on with centralized data pipelines. Teams typically choose between them based on pricing structure and scalability.
What are the best Supermetrics alternatives for Google Sheets?
Windsor.ai is one of the strongest Supermetrics alternatives for Google Sheets, especially for teams that need more connectors, more accounts, unlimited users, and predictable pricing. Unlike Supermetrics, Windsor.ai includes all data sources and destinations in every plan. This makes it easier to scale Google Sheets reporting without repeated upgrades.
Does Windsor.ai offer a Google Sheets add-on like Supermetrics?
Yes, Windsor.ai offers a Google Sheets add-on similar to Supermetrics. Users can pull data directly into Google Sheets using a familiar add-on workflow. In addition, Windsor.ai also supports sending data to Google Sheets from centralized pipelines outside the spreadsheet.
Which tool is better for agencies using Google Sheets?
For agencies using Google Sheets to manage multiple clients, Windsor.ai is generally a better fit than Supermetrics. Windsor.ai supports unlimited users and accounts, while Supermetrics applies plan-based limits. This difference matters as client count and reporting volume grow.
How does Windsor.ai’s pricing for Google Sheets differ from Supermetrics’?
Windsor.ai offers more predictable pricing for Google Sheets than Supermetrics. All connectors and destinations are included starting at a lower base price, while Supermetrics pricing increases as users, accounts, and connectors are added. The cost difference becomes more noticeable at scale and when you need to export data into multiple destinations.
Can Windsor.ai replace Supermetrics for Google Sheets reporting?
Yes, Windsor.ai can replace Supermetrics for Google Sheets reporting in most use cases. It supports the same spreadsheet-based workflows while also enabling centralized data management. Many teams switch when Supermetrics limits begin to affect reporting flexibility.
Does Windsor.ai support more data sources than Supermetrics?
Yes, Windsor.ai supports more data sources than Supermetrics overall. Windsor.ai offers access to 325+ data sources, while Supermetrics supports 176+ connectors with availability varying by plan. This difference is important for teams consolidating data into Google Sheets from many platforms.
How do refresh schedules compare between Windsor.ai and Supermetrics?
In Supermetrics, refresh frequency depends on the selected plan and tier, starting from the weekly refresh interval on the Starter plan. Windsor.ai allows daily and hourly refresh scheduling without gating behind premium plans. For Google Sheets reporting that often requires frequent updates, this structural difference can be a critical factor
Can I sync Google Sheets and a data warehouse at the same time?
Yes, with Windsor.ai, the same dataset can be sent to Google Sheets and a data warehouse at the same time. Supermetrics primarily focuses on spreadsheet destinations, with warehouses gated to higher-tier plans and requiring a separate setup. This makes Windsor.ai more flexible for hybrid reporting setups.
Which tool scales better for multi-client reporting in Google Sheets?
Windsor.ai scales better than Supermetrics for multi-client Google Sheets reporting. Unlimited users, unlimited accounts per data source, and centralized pipelines reduce operational overhead. Supermetrics works well for basic setups, but scaling introduces additional limits and plan upgrades.

