 Destinations
 Data sources
 AI insights
 About us
 Careers
 Security
 Customer reviews
 Contact us
 Affiliate program
 Solution partners
 Template gallery
 Looker Studio templates
 Power BI templates
 Excel templates
 Google Sheets templates
 Tableau templates
 Facebook Ads templates
 Google Ads templates
 Data fields & Metrics
 AI prompt library & Guides
 Product documentation
 API documentation
 Case studies
 Blog
Blog Data models
 Windsor vs Supermetrics
 Windsor vs Funnel.io
 Windsor vs Fivetran
 Windsor vs Rivery
 Windsor vs Portermetrics
 Windsor vs Coupler.io
 Last updated: 1 September 2026




The fastest way to connect Datadog to ChatGPT is through the native Windsor.ai app: connect your Datadog account to Windsor once, then install the free Windsor.ai app inside ChatGPT and ask questions about your monitors, downtimes, SLOs, and dashboards in plain language. No code, no manual log exports, and no custom GPT actions to configure.
Checking on monitoring status the usual way means logging into the Datadog UI, clicking through monitors and downtime schedules one at a time, or exporting audit logs just to answer a simple question like “what changed last night.” Once Datadog is connected through Windsor, you can ask ChatGPT directly instead, and if you track other operational or business data too, it becomes one place to ask questions across all of it rather than switching between tools.
2 steps to connect Datadog to ChatGPT
Takes under a minute, no code or manual log exports required.
For the full walkthrough, see how to integrate data into ChatGPT.
Prerequisites
- A Windsor.ai account (free forever plan, no credit card, or paid from $19/month)
- A Datadog account or organization with monitors, downtimes, SLOs, or dashboards already set up
- A ChatGPT account
Step 1. Connect Datadog to Windsor.ai
- Create a free Windsor.ai account, or log in if you already have one
- Go to onboard.windsor.ai/app/datadog and select Datadog
- Authorize Windsor to access your Datadog organization
- Connect more than one Datadog organization if you monitor several environments
Step 2. Connect the Windsor.ai app in ChatGPT
In ChatGPT, open the connectors settings, search for Windsor.ai, and install it as a native app. Approve the requested access, and Windsor’s connected data sources, including Datadog, become available to query from inside your chat.
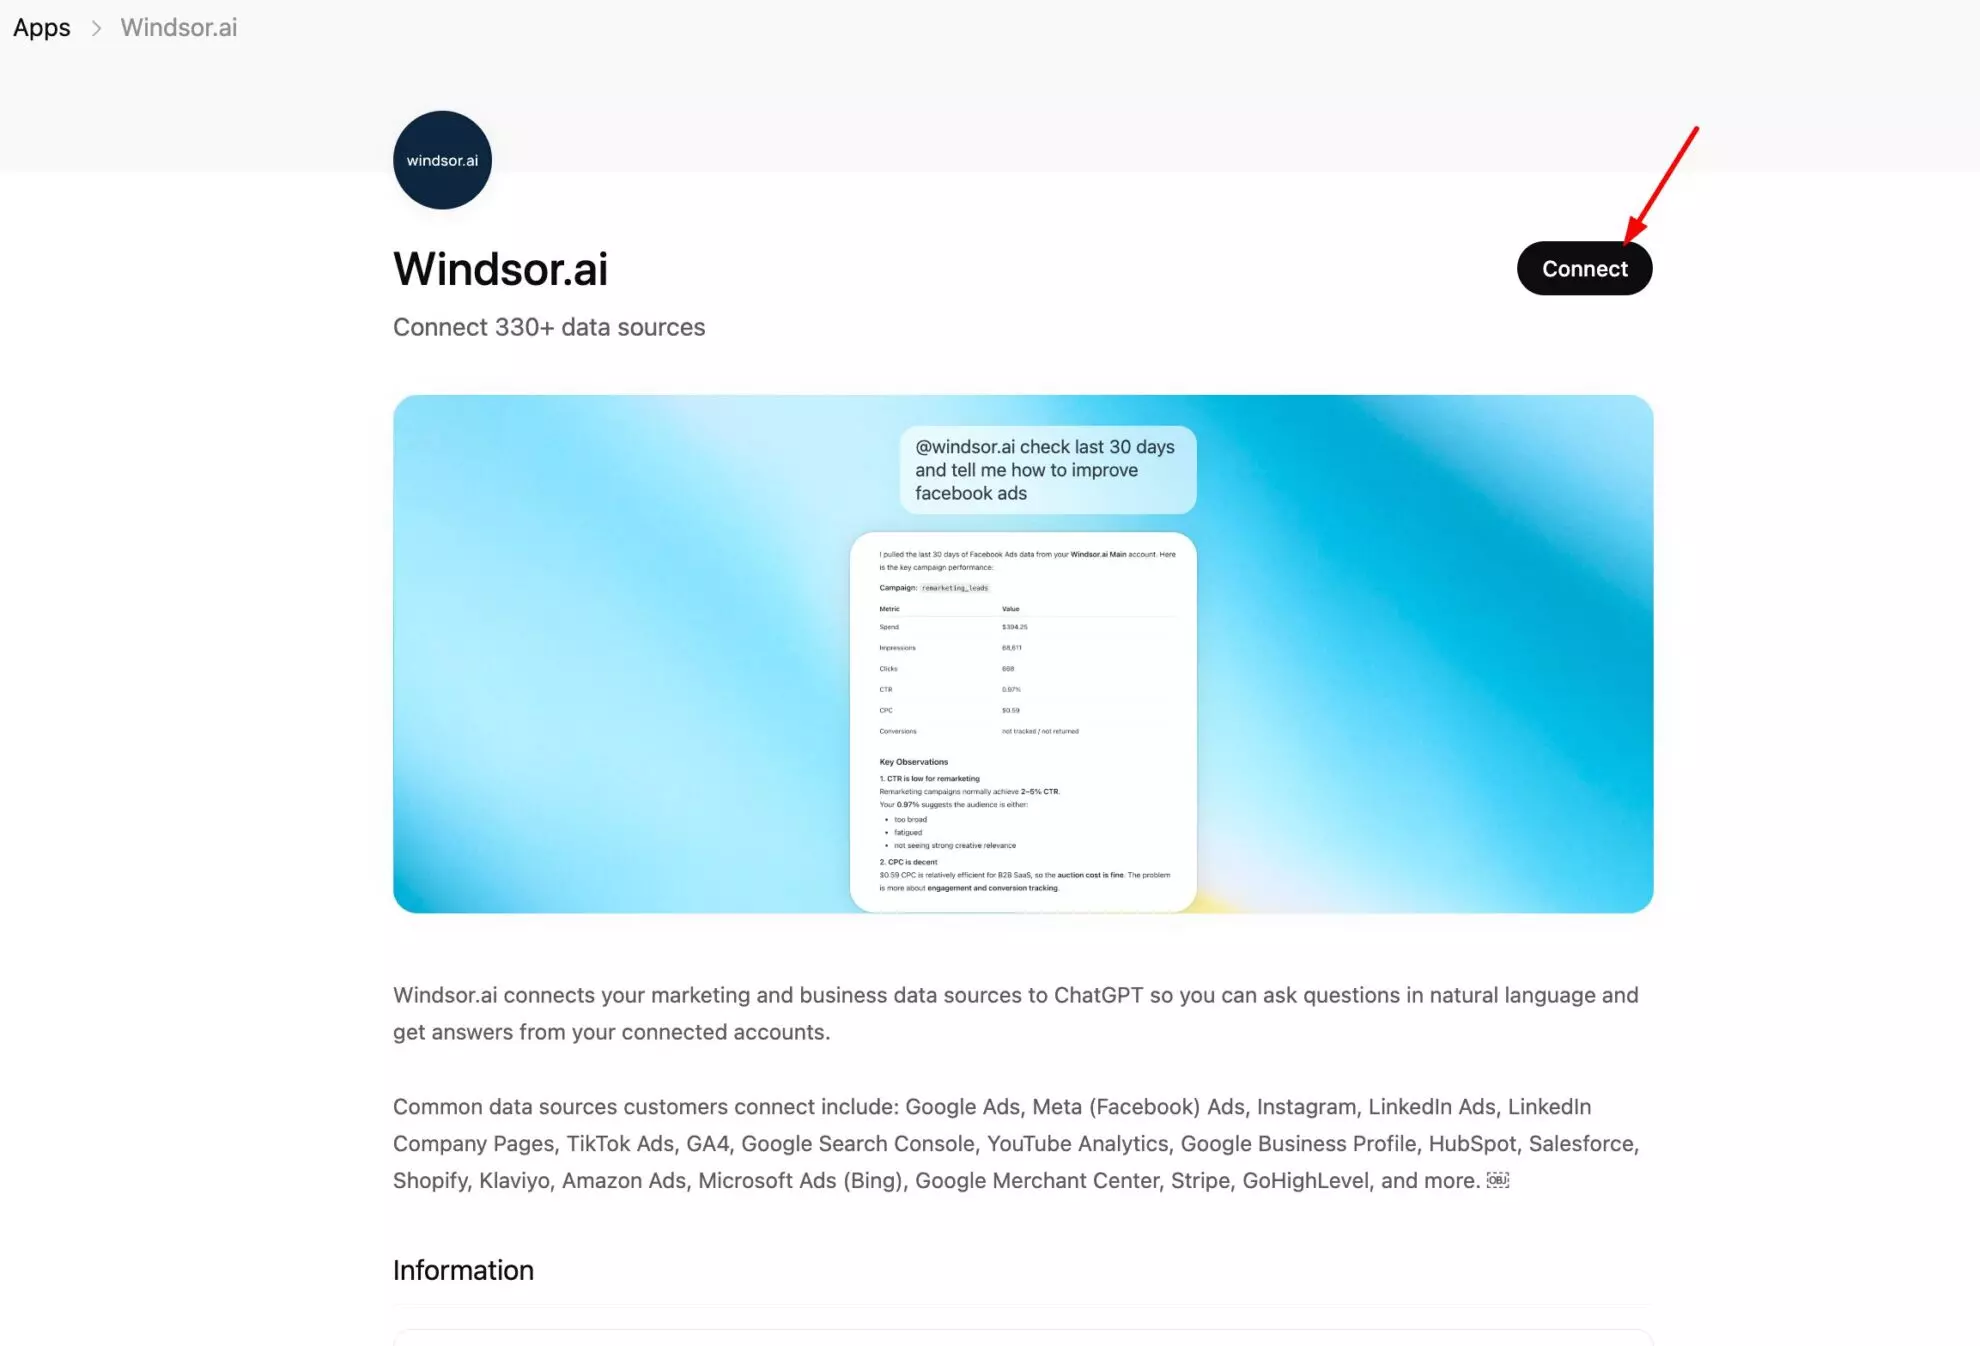
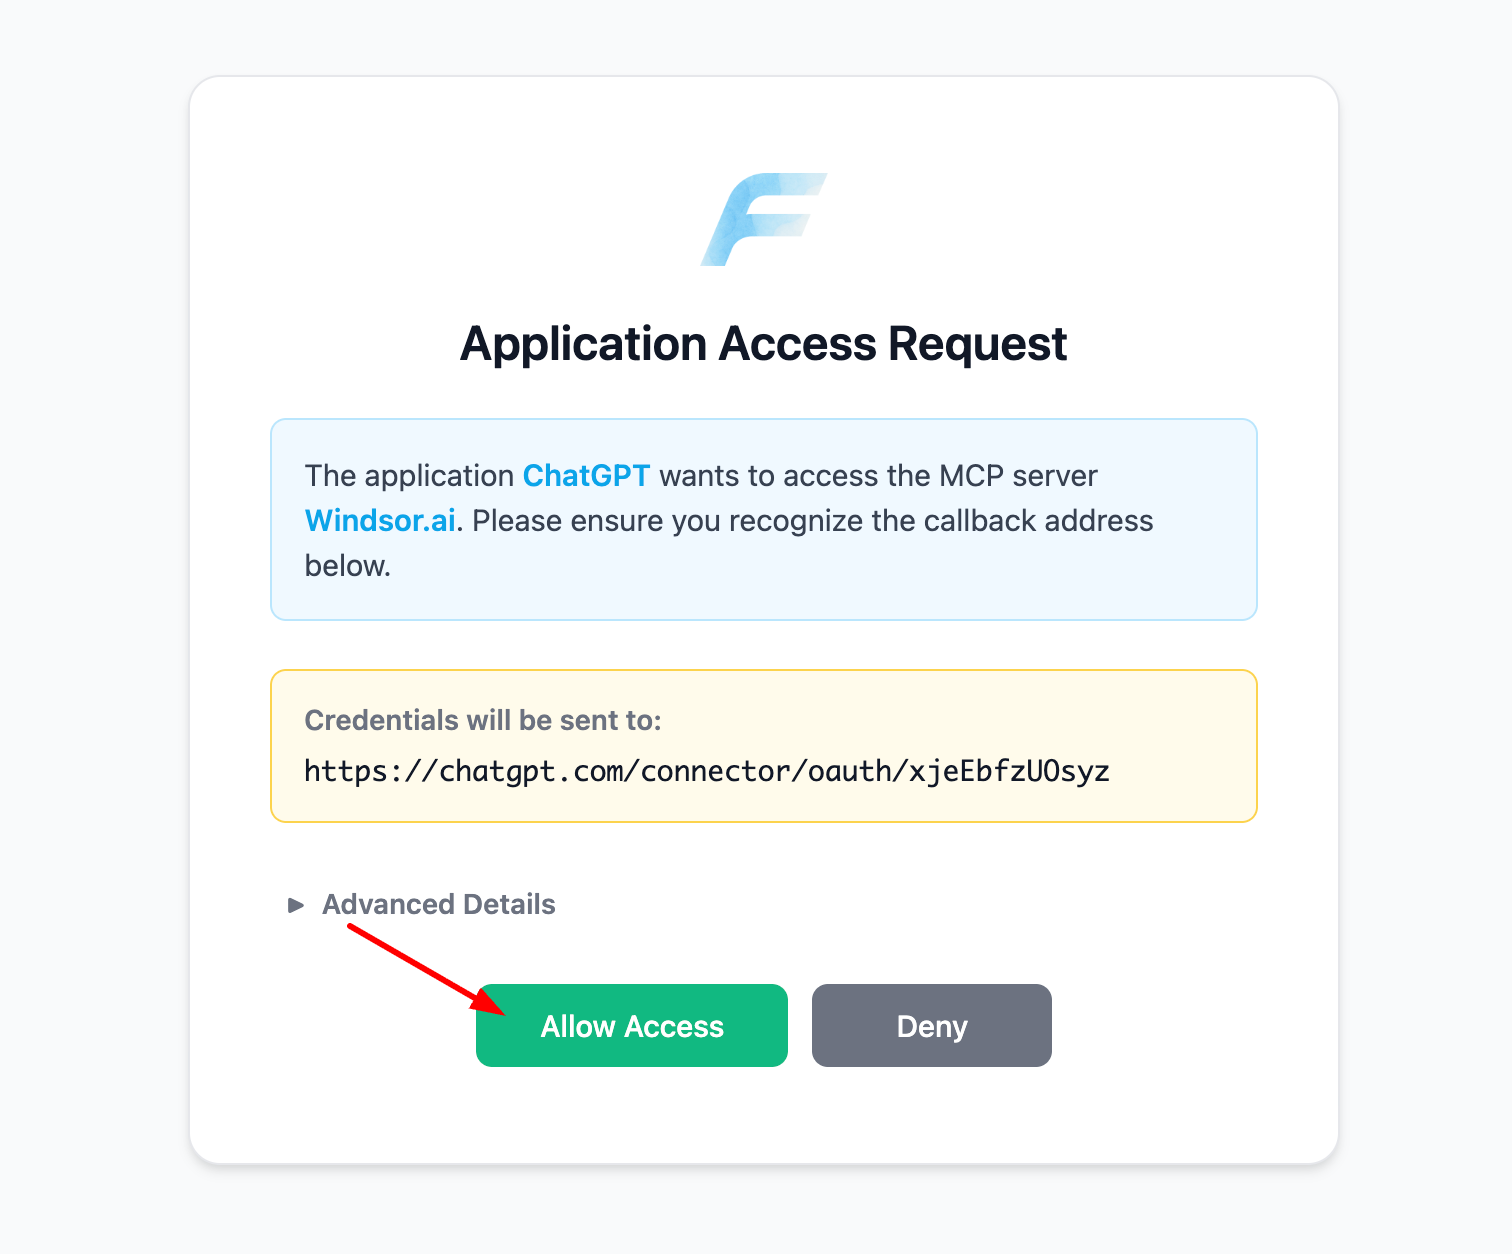
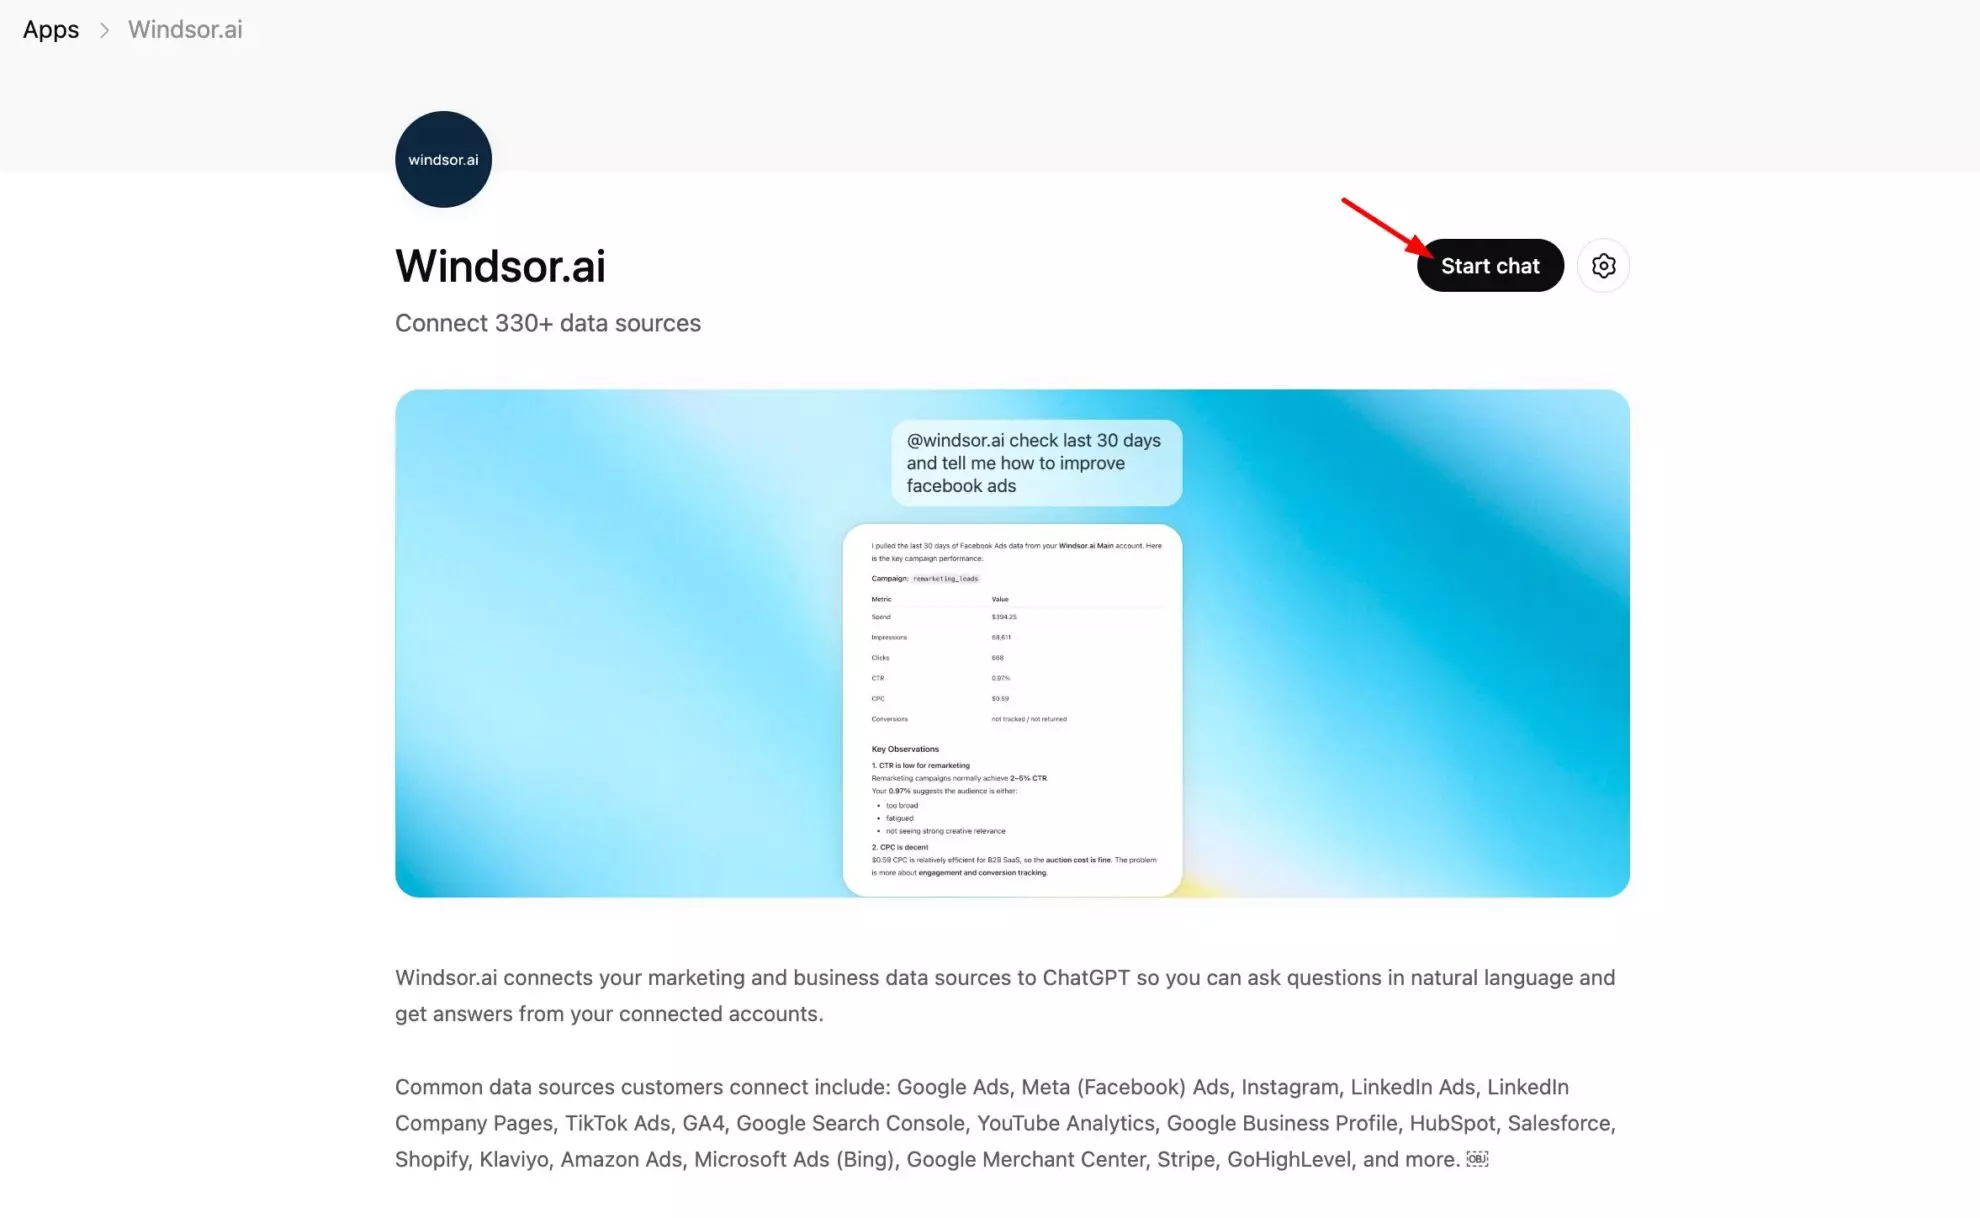
Once installed, confirm the connection is live:
List the data sources connected to my Windsor account. Do you see Datadog there?Once ChatGPT confirms Datadog is connected, you’re ready to ask about your monitoring setup in natural language.
The metrics that matter for Datadog
| Metric | What it tells you |
|---|---|
| monitors.overall_state | Whether a monitor is currently OK, Alert, Warn, or No Data, the fastest signal of what’s actually broken right now. |
| monitors.priority | The priority level assigned to a monitor, so you know which alerts to act on first when several fire at once. |
| monitors.tags | The tags attached to a monitor, such as service, team, or environment, useful for filtering alerts by ownership. |
| downtimes.scope | Which monitors or tags a downtime applies to, so you can see exactly what’s being muted and why. |
| downtimes.status | Whether a downtime is currently active, scheduled, or canceled, telling you if an alert is being suppressed right now. |
| downtimes.monitor_id | The specific monitor a downtime is tied to, linking every mute window back to the alert it silences. |
| service_level_objectives.target_threshold | The SLO goal you’ve committed to, the number your error budget is measured against. |
| service_level_objectives.timeframe | The rolling window an SLO is measured over, which sets how much room you have left before a breach. |
| synthetic_tests.status | Whether a synthetic test is currently passing or failing, a stand-in for whether a user-facing flow actually works. |
| synthetic_tests.locations | Which geographic locations a synthetic test runs from, so you can tell if an issue is regional or global. |
| dashboards.modified_at | When a dashboard was last edited, useful for knowing whether a view still reflects your current setup. |
| audit_logs.type | The kind of action recorded in an audit log entry, so you can track configuration changes over time. |
What to ask ChatGPT: prompt ideas
Monitoring and alert status
Which monitors are currently in an alert state, and how long have they been unhealthy?
List all monitors with downtimes scheduled this week, and who scheduled them.
Service-level objectives and synthetic tests
Show our SLOs with their target and warning thresholds, and flag any that are close to breach.
Which synthetic tests failed recently, and which monitor is each one tied to?
Dashboards and audit activity
Which dashboards were modified in the last 30 days, and by whom?
This connection is read-only, so ChatGPT can report on your monitors, downtimes, SLOs, and dashboards, but it can’t silence a monitor, acknowledge an alert, or resolve an incident in Datadog.
Other ways to connect Datadog to ChatGPT
Manual export
You can export monitors, downtimes, or audit logs from Datadog into a spreadsheet or CSV. That gives you a snapshot of your monitoring setup at one point in time, but it goes stale the moment anything changes and has to be re-exported manually to stay current.
Zapier or Make
Zapier or Make can pass Datadog events into other tools as part of an automated workflow. That’s useful for triggering actions elsewhere, but it means building and maintaining a workflow rather than being able to ask a direct question about your monitoring data whenever you need to.
Neither approach gives you the live, queryable view that connecting Datadog to Windsor does.
Conclusion
Connecting Datadog to ChatGPT through Windsor.ai takes two steps and a couple of minutes: link your Datadog account to Windsor, then install the Windsor.ai app in ChatGPT. From there, you can ask about monitors, downtimes, SLOs, and dashboards without opening the Datadog UI, and blend that data with any of Windsor’s other 350+ sources if you need a fuller operational picture.
🚀 Ready to connect Datadog to ChatGPT? Connect Datadog to Windsor.ai free and start asking ChatGPT about your monitoring data today.
FAQs
What's the fastest, most native way to connect Datadog to ChatGPT?
The native Windsor.ai app is the fastest way. It’s a one-click install inside ChatGPT, with no custom actions, scripts, or manual data transfers to set up.
Do I need to write any code to connect Datadog to ChatGPT?
No. Connecting Datadog to Windsor and installing the Windsor.ai app in ChatGPT are both no-code steps done through account authorization and a native app install.
Can ChatGPT analyze my Datadog monitoring data?
Yes. Once connected, ChatGPT can answer questions about your monitors, downtimes, SLOs, dashboards, and audit logs in plain language.
Can I connect more than one Datadog organization?
Yes, Windsor supports connecting multiple Datadog organizations if you monitor more than one environment.
What Datadog data is available once it's connected?
Windsor pulls monitor records, downtime and mute windows, SLO thresholds and types, synthetic test to monitor mappings, audit log entries, and dashboard metadata such as author, layout type, and modification dates.
How much does Windsor.ai cost?
Windsor has a free forever plan with no credit card required, and paid plans starting from $19/month for higher usage or more connectors.
Is connecting Datadog to Windsor better than exporting data manually?
A manual export or CSV only reflects your monitoring setup at the moment you pulled it. Connecting Datadog to Windsor keeps the data live, so ChatGPT always answers from current monitors, downtimes, and SLOs instead of a stale snapshot.
Can I combine Datadog with other data sources in ChatGPT?
Yes. Windsor connects Datadog alongside 350+ other sources, so you can blend monitoring data with other operational or business data for a single source of truth instead of checking each tool separately.
Is the connection secure, and can ChatGPT silence a monitor or resolve an incident through it?
The Datadog connection through Windsor is read-only. ChatGPT can analyze and report on your monitoring data, but it cannot create, edit, silence a monitor, or resolve an incident in Datadog.


