 AI insights
 About us
 Careers
 Security
 Customer reviews
 Contact us
 Affiliate program
 Solution partners
 Looker Studio templates
 Tableau templates
 Facebook Ads templates
 Google Ads templates
 Data fields & Metrics
 AI prompt library & Guides
 Product documentation
 API documentation
 Case studies
 Blog
Blog Data models
 Windsor vs Supermetrics
 Windsor vs Fivetran
 Windsor vs Portermetrics
 Last updated: 3 June 2026

You don’t need a million orders to feel the pain of manual analysis. Whether you are doing ten sales a day or ten thousand, the challenge is the same: Shopify’s standard reports show you what happened, but they rarely tell you why or what to do next to improve your margins.
What if you could treat Claude as your fractional COO who identifies exactly where you are losing money or where your next growth lever is hidden?
By connecting Shopify to Claude, you move past static charts and spreadsheets. You can ask Claude to calculate your true Customer Lifetime Value (LTV), identify high-churn segments, or optimize your inventory velocity.
To answer how to connect Shopify to Claude, you essentially have two paths:
1) The manual way: Exporting dozens of CSV files, cleaning data in Excel, and uploading them to Claude.
2) The automated way: Using the Windsor MCP (Model Context Protocol) to create a live, real-time bridge between your Shopify data and Claude.
🚀 Stream your Shopify data into Claude in seconds, start for free: https://onboard.windsor.ai/.
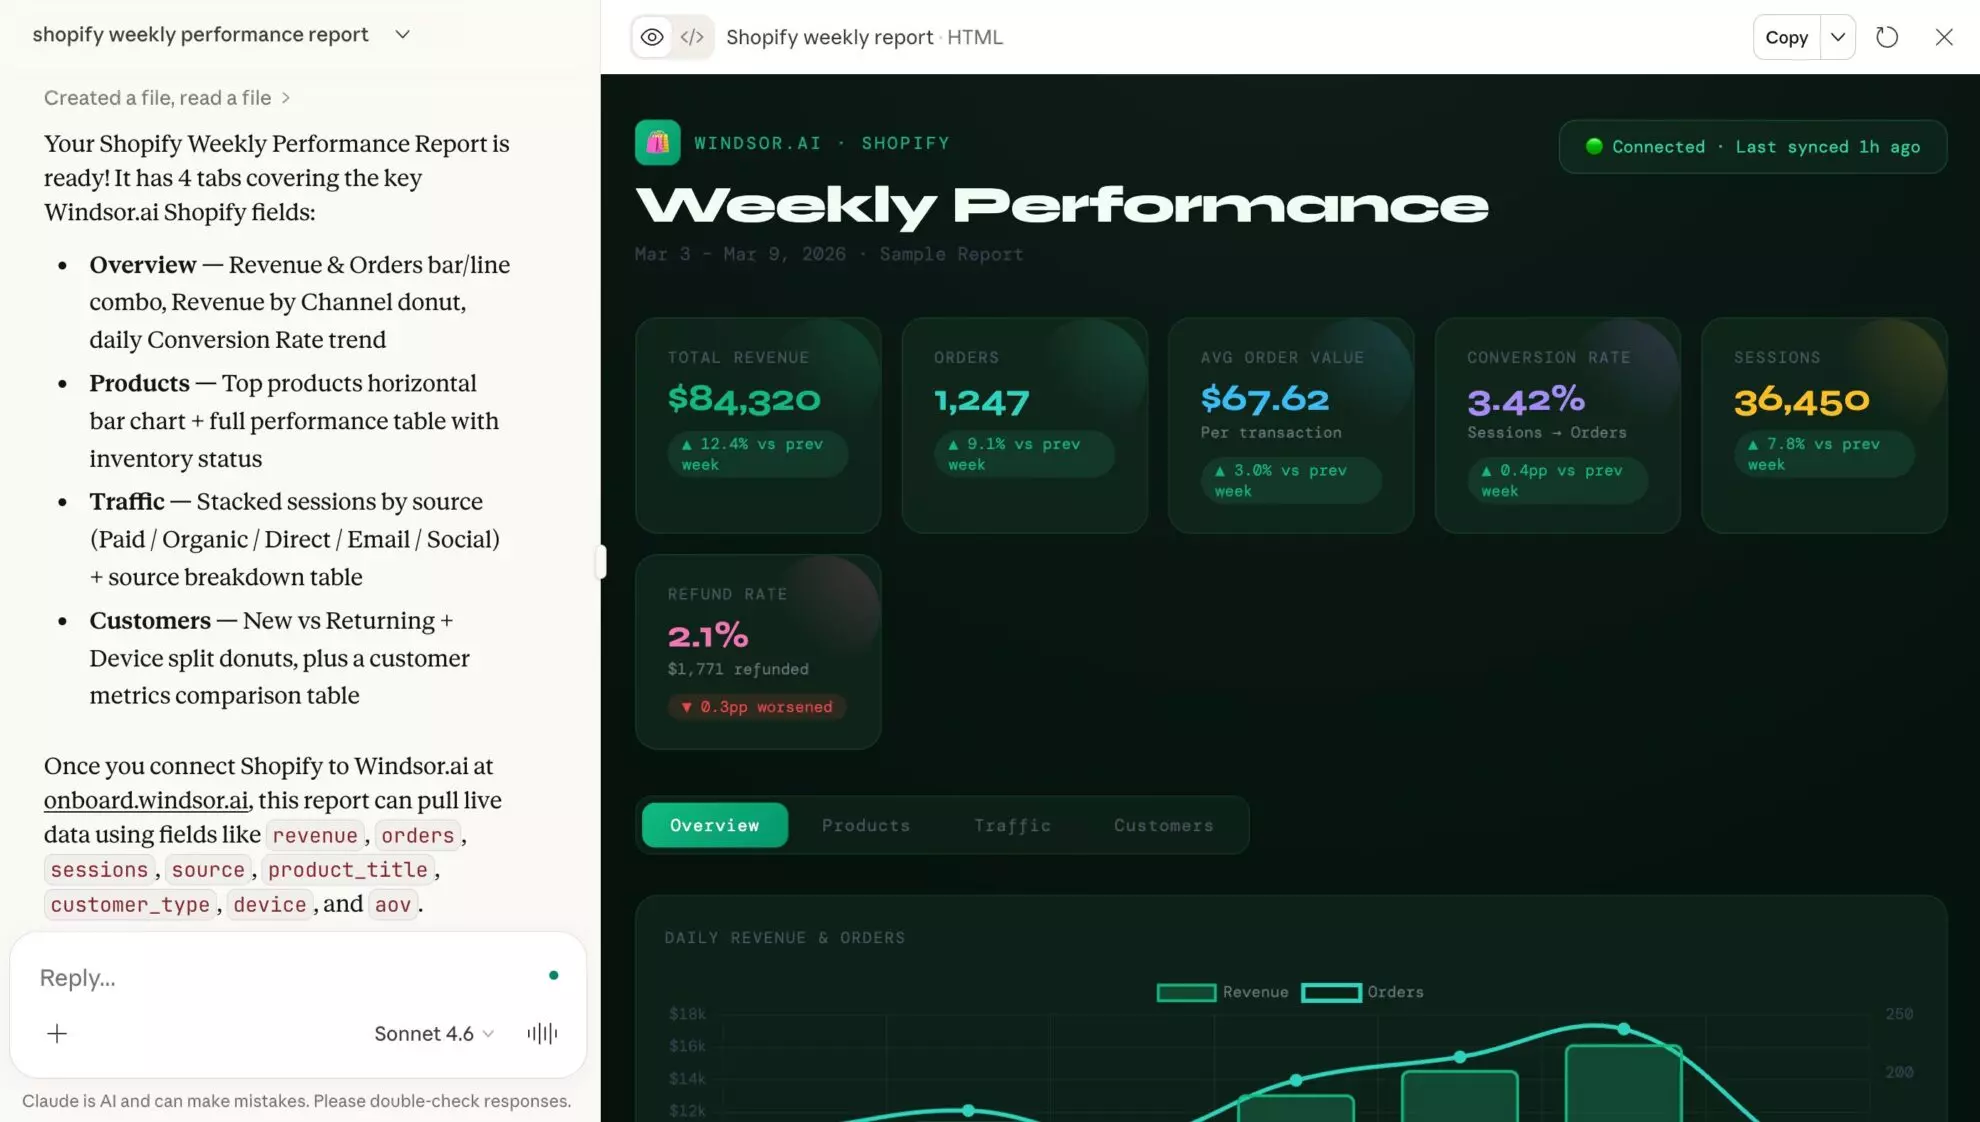
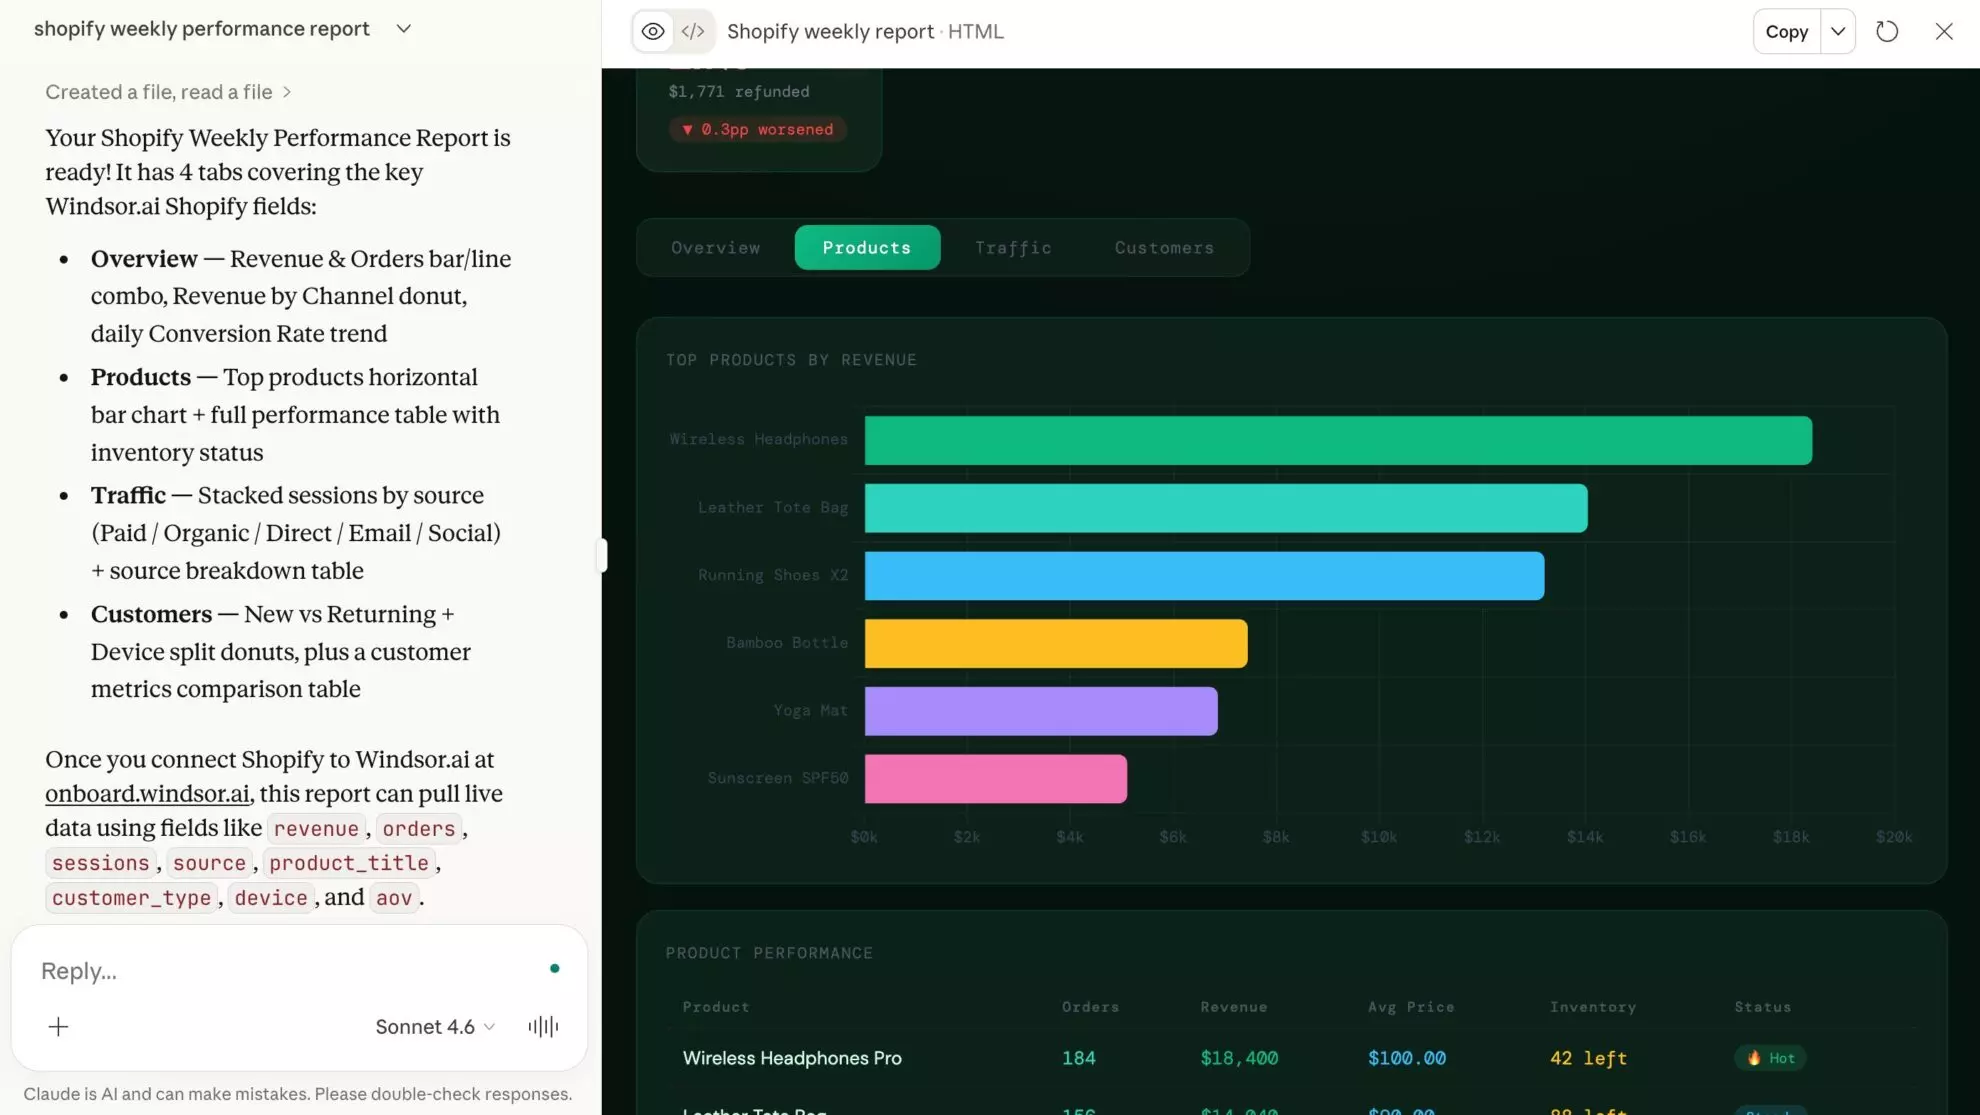
Windsor.ai allows you to establish this connection in under a minute, removing the headache of manual data prep. Analyze your large-scale Shopify data with AI using natural language and generate high-impact visual reports like the one below with a single prompt.
Let’s get started in three simple steps.
3 steps to automatically sync Shopify data to Claude via Windsor MCP
Using the Windsor MCP, you eliminate the “download-and-clean” cycle and proceed with deep AI insights in <60 seconds.
📖 Follow our quick step-by-step guide to connect your Shopify data to Claude.
Prerequisites for Shopify to Claude Integration
Before you begin, ensure you have the following ready:
- A Windsor.ai account: You need an active account to integrate the Shopify data.
- Shopify admin access: You need “Staff” permissions with read access to Orders, Customers, and Products.
- Claude.ai account: You need an active Claude account, which serves as your AI analytical environment.
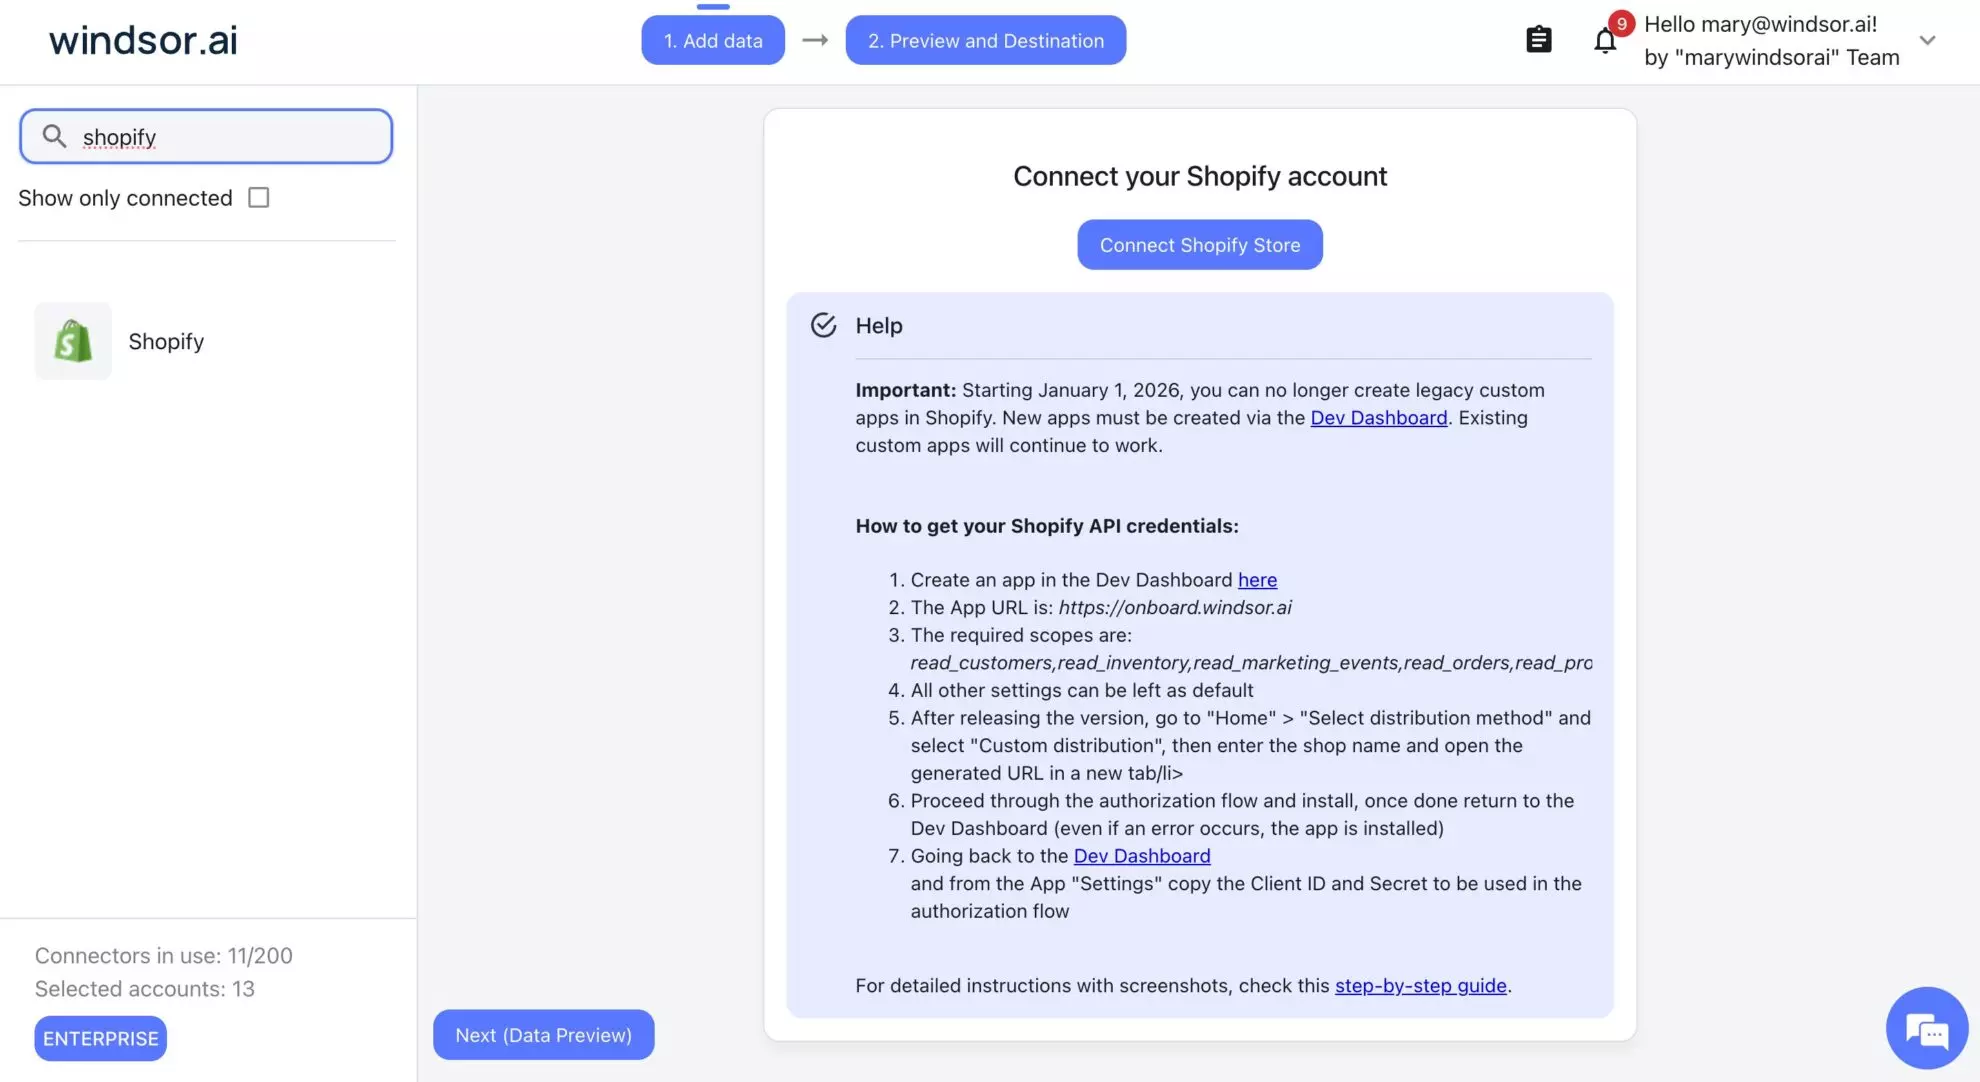
Step 1: Grant Windsor access to Shopify
- Log in to onboard.windsor.ai.
- Select Shopify as your data source.
- Connect your Shopify store by following this setup guide.
Windsor will now handle the heavy lifting, flattening hundreds of Shopify metrics and dimensions—from customer_total_spent to order_current_total_tax—so they are instantly readable by Claude.
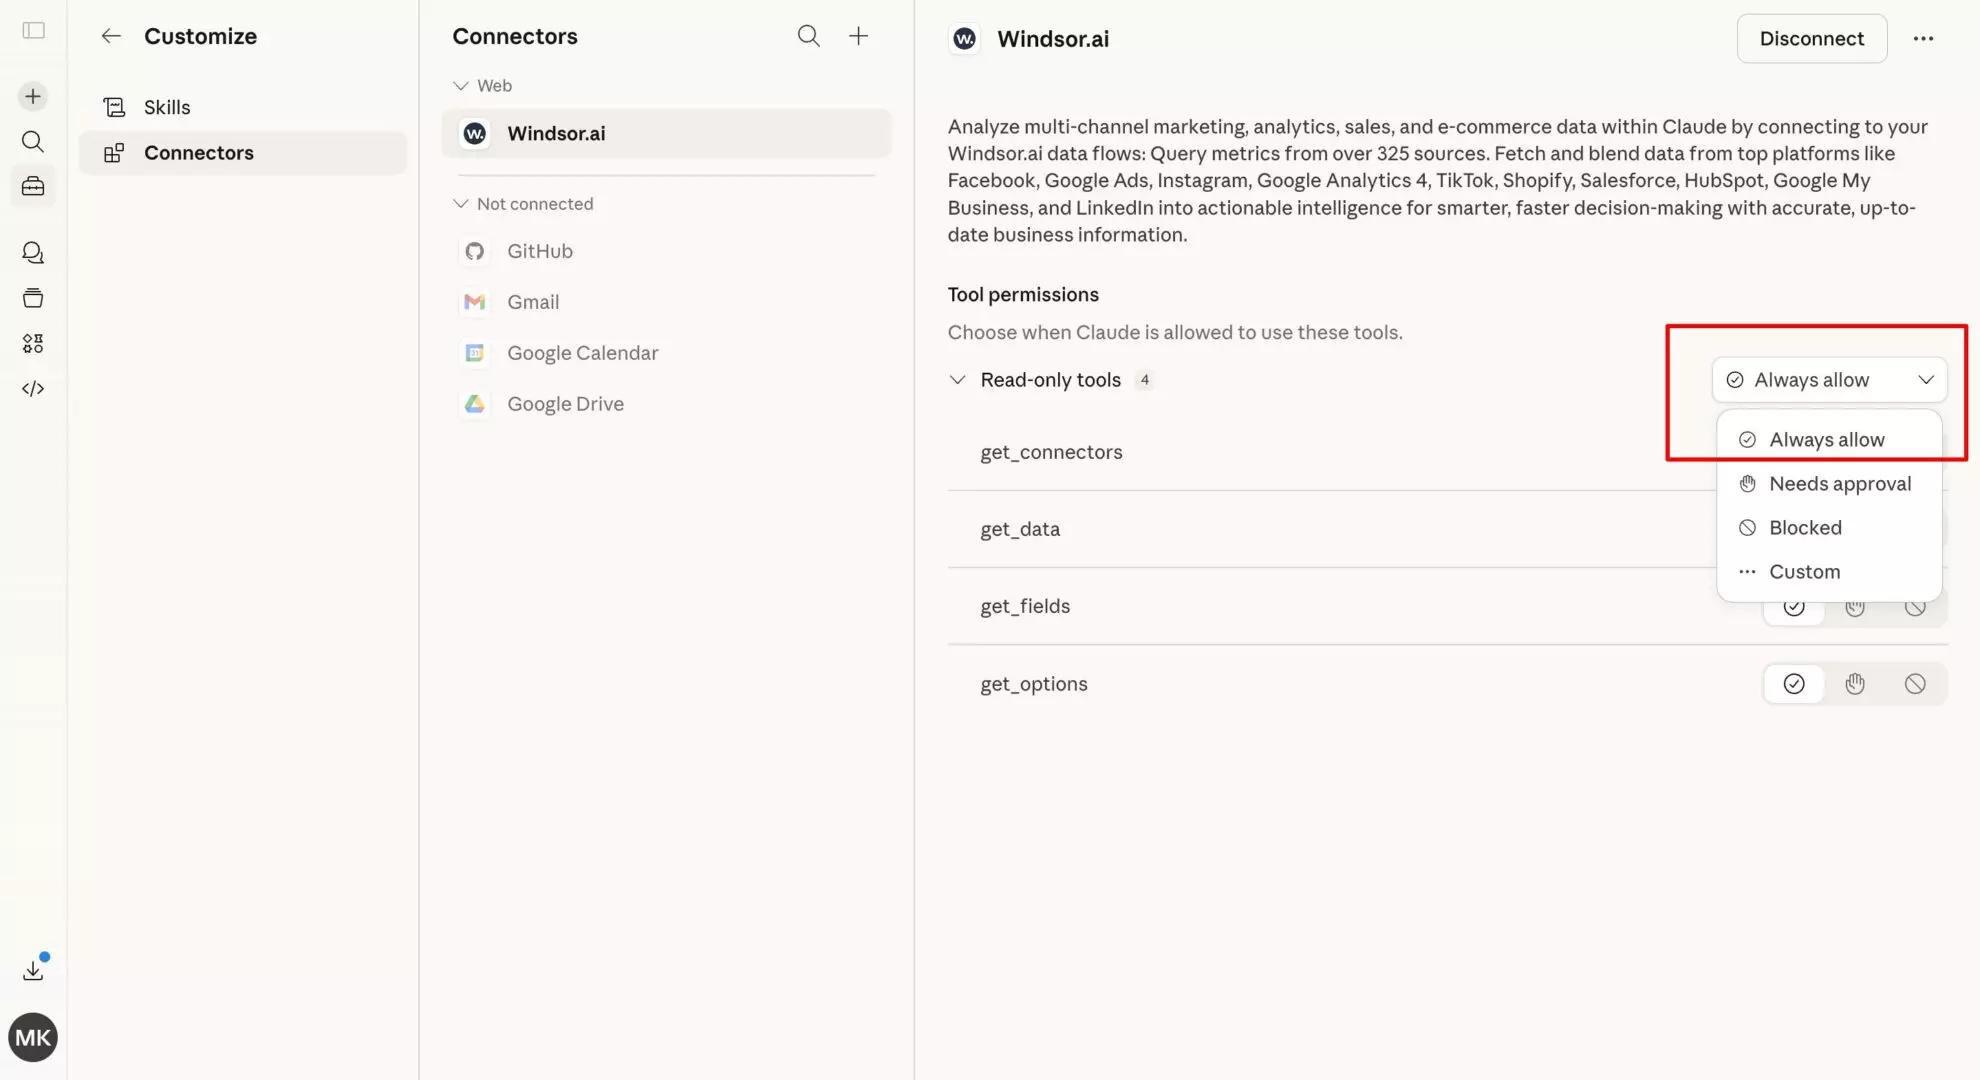
Step 2: Activate the Windsor.ai connector in Claude
In Claude, open the Windsor.ai connector page and click Connect.
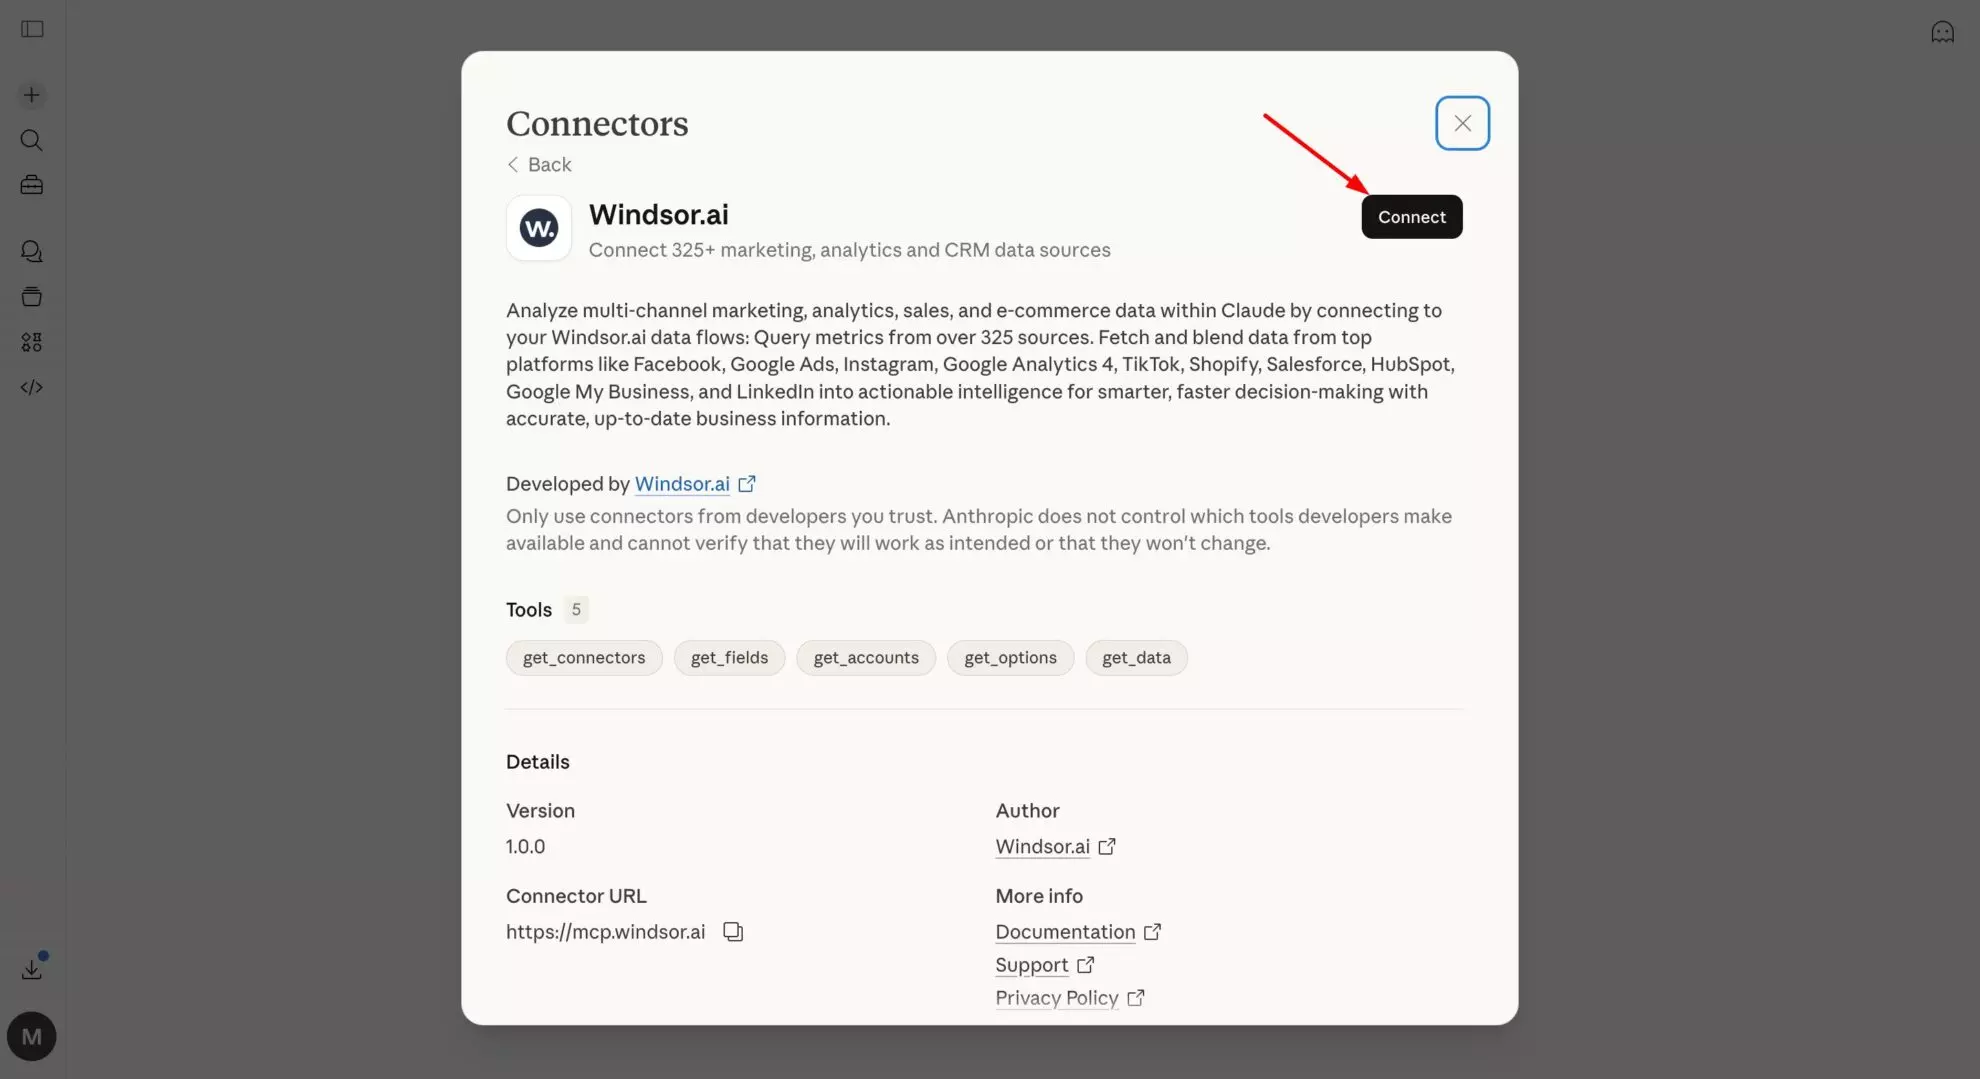
Optionally, you can set permissions to “Always allow” to enable Windsor MCP-powered queries across all your chats.
Step 3: Start querying your Shopify data
Once connected, you no longer need to look at static analytical dashboards. Just speak to Claude in natural language to extract instant AI insights:
Here are prompt samples you can use:
- “What is my average Customer Lifetime Value (LTV) for customers who used a {WELCOME10} discount code vs. those who didn’t?”
- “Which products are my ‘hidden gems’—low sales volume but extremely high repeat purchase rates?”
- “Analyze my ‘Line Item Unfulfilled Quantity’ and tell me which SKUs are causing the biggest delays in shipping revenue.”
Dig deeper and ask Claude to generate a visual summary based on the text output.
Things you can do with your Shopify data in Claude
Even if your store isn’t “scaling to the moon” yet, Claude can help you optimize your current baseline with these use cases:
- Sales & profitability analysis: Stop guessing your net margins. Claude can analyze
order_total_price,order_current_total_tax, andorder_total_discountsto show you exactly what you’re taking home after every cost is accounted for. - Deep customer insights: Move beyond basic “Total Customers” counts. Use fields like
customer_total_spent,customer_orders_count, andcustomer_aovto let Claude identify your “Whales” (high-value customers) or build ideal customer profiles (ICPs). - New vs. returning customer analysis: Segment orders by
customer_is_returningandorder_created_atto compare revenue, order counts, and repeat purchase patterns. Identify which channels and products drive first-time vs. repeat purchases. - Churn prevention: Identify customers who haven’t purchased in 60 days but have a high
customer_orders_count. Then ask Claude to draft a personalized “Win-back” email. - Inventory velocity: Ask Claude to analyze
line_item__quantitytrends to predict whichskuwill stock out in the next 14 days. - B2B/wholesale discovery: Use
customer_tagsto separate retail from wholesale buyers and compare theircustomer_aov(Average Order Value). - Attribution & marketing ROI: Connect your sales back to the source. Using
order_sales_channelandsourcetags, Claude can tell you if your latest influencer campaign or TikTok ad actually resulted in high-LTV customers or just one-time bargain hunters.
Shopify analytics prompt ideas for Claude
Most Shopify dashboards answer basic questions like “How many orders did we get?”
But the questions that actually drive growth are harder:
- Which customers generate the most profit?
- Which products are silently killing the margin?
- Which marketing channels bring high-value buyers?
- Which SKUs will run out of stock next week?
These questions usually require exporting Shopify data into spreadsheets or BI tools.
Once your Shopify data is connected to Claude through Windsor MCP, you can ask these questions directly and get structured AI-driven answers.
Below are some common e-commerce problems and the prompts you can use to solve them.
1. Are you actually making money on each order?
Revenue in Shopify does not equal profit.
Discounts, taxes, shipping costs, and refunds can significantly reduce margins. Many stores rely on rough estimates instead of calculating true net revenue.
Claude can analyze order-level data such as:
order_total_priceorder_total_discountsorder_current_total_tax
to estimate real profitability.
Example prompt:
Calculate my net revenue per order by subtracting order_total_discounts and estimated shipping costs from order_total_price.
Which month had the highest net margin percentage?
2. Which customers are your most valuable?
Not all customers are equal.
Many stores focus on acquisition while ignoring the customers who generate the majority of lifetime value.
Using fields such as:
customer_total_spentcustomer_orders_countcustomer_aov
Claude can identify high-value customers and purchasing patterns.
Example prompt:
Identify the top 10% of customers based on customer_total_spent.
What is their average customer_orders_count and customer_aov compared to the rest of the customer base?
3. Are you losing repeat customers without noticing?
Customer churn is one of the biggest hidden revenue leaks for e-commerce stores.
Customers who previously ordered multiple times but suddenly stopped buying are often the easiest revenue to recover.
Claude can detect churn risks by analyzing:
customer_orders_countcustomer_last_order_date
Example prompt:
Find customers with a customer_orders_count greater than 3 who haven't placed an order in the last 60 days.
Draft a personalized win-back email referencing the last line_item__name they purchased.
4. Which products will run out soon, based on how fast they sell??
Stockouts can cost stores significant revenue, especially for best-selling products.
Many Shopify operators manually track top-selling products and declining inventory (“downsells”) to forecast inventory levels.
By analyzing fields such as:
line_item__quantityproduct_skuorder_timestamps
Claude helps you instantly estimate product sales velocity.
Example prompt:
Identify my top 10 selling SKUs over the last 30 days.

For each SKU:
- Calculate daily sales velocity
- Estimate days until stockout (based on recent trends)

Highlight:
- Products at risk of running out within 21 days
- Slow-moving products with declining demand

Provide a prioritized reorder list.
This helps operators prevent lost revenue from unexpected stockouts.
5. Which marketing channels bring high-value customers?
Not all traffic sources produce the same type of customer.
Some channels generate one-time bargain hunters, while others produce long-term repeat buyers.
Using fields like:
order_sales_channelcustomer_total_spent
Claude can analyze which channels drive the highest long-term value.
Example prompt:
Compare order_sales_channel sources (Online Store, POS, Social).
Which channel produces customers with the highest customer_total_spent over time?
This helps marketers optimize acquisition toward channels that drive LTV, not just first purchases.
6. Which products are quietly killing your margins?
Many Shopify stores carry products that:
- sell rarely
- tie up inventory
- generate little revenue
These are often called “zombie SKUs.”
Claude can analyze product sales activity and identify inventory that is no longer moving.
Example prompt:
Identify active SKUs with zero sales in the last 60 days.
Calculate the total inventory value of these products and suggest a discount or bundle strategy to clear the stock.
7. How many new vs. returning customers do you have?
Understanding which orders come from first-time buyers versus repeat customers is crucial for measuring growth, retention, and the effectiveness of marketing campaigns. Claude can automatically segment your Shopify orders using fields like:
customer_is_returningorder_created_atcustomer_total_spent
Example prompt to compare the amount and revenue:
For the last 90 days, calculate the total number of orders and revenue from new customers vs. returning customers and their average order value.
Example prompt to define the top-performing channels:
Identify which marketing channels bring the highest proportion of new customers vs. returning customers.
Example prompt to discover the best-selling products:
Analyze repeat purchase rates by product category and highlight which items drive loyalty among returning buyers.
This explains whether growth is driven by acquisition or retention and helps you optimize campaigns for repeat buyers and improve customer lifetime value.
Bonus: Which advertising campaigns actually generate the highest ROAS?
Most e-commerce teams run paid ads across Facebook Ads, Google Ads, TikTok Ads, etc., but struggle to analyze Shopify revenue and ad performance in separate dashboards.
Native platform analytics report conversions and estimated ROAS, but they don’t always reflect actual store revenue.
To calculate true campaign performance, you need to combine:
Shopify data:
order_total_priceorder_total_discountsutm_campaign
Advertising data (f.e, Meta Ads):
campaign_namespendclicks
Using UTM campaign parameters, Claude can match Shopify orders to Facebook Ads campaigns and calculate real ROAS based on actual store revenue.
Example prompt:
Match Shopify orders with Facebook Ads campaigns using utm_campaign.
For the last 30 days, calculate for each campaign:
- total ad spend
- total Shopify revenue (order_total_price)
- ROAS
Rank campaigns by ROAS and highlight the best-performing ones.
This allows marketers to quickly identify:
- Which campaigns generate the highest ROAS
- Which campaigns should receive more budget
- Which campaigns are underperforming
Instead of relying on isolated dashboards, Claude can analyze both revenue and ad spend together, giving you a clearer view of real marketing performance.
Shopify data that you can stream into Claude with Windsor.ai
Windsor.ai supports over 330 Shopify data fields, enabling a truly comprehensive and in-depth analysis in Claude.
Here are the primary data categories you can sync:
Sales & transactional data
This category includes everything related to the financial health of your orders. It allows Claude to audit your actual take-home pay after costs.
Key fields:
order_total_price,order_current_total_tax,order_total_discounts, andorder_currency.
Customer intelligence
These fields help Claude perform cohort analysis and identify your most valuable buyers.
Key fields:
customer_total_spent,customer_orders_count,customer_aov(Average Order Value), andcustomer_is_returning.
Product & inventory performance
This data is essential for Claude to act as an inventory planner, identifying what’s moving and what’s stuck.
Key fields:
sku,line_item__quantity,line_item__unfulfilled_quantity, andproduct_status.
Marketing & attribution
This category connects your sales back to the source, helping Claude determine which channels are actually profitable.
Key fields:
order_sales_channel,source, and various marketing event timestamps likestarted_at.
The manual way to send Shopify data to Claude
If you only need a one-time snapshot of your store, you can follow these steps to connect Shopify to Claude:
- Export orders: Navigate to Shopify Admin -> Orders -> Export. Select “All Orders” and choose “CSV for Excel, Numbers, or other spreadsheet programs.”
- Export customers: Go to Customers -> Export to get your buyer history.
- Data cleaning: Open the files in Excel to remove sensitive PII (like full addresses) and ensure date formats are consistent.
- Upload to Claude: Open Claude.ai, start a new chat, and use the attachment icon to upload your cleaned CSVs.
- Prompt: Use a prompt like: “I have attached my Shopify order and customer data. Please analyze these files to identify which product categories have the highest repeat purchase rate.”
Why the manual method fails e-commerce teams
Most merchants start by downloading CSVs directly from the Shopify admin. However, the complexities of manual Shopify analysis quickly become a bottleneck, especially for small teams, due to these obstacles:
- Data fragmentation: Orders, Customers, and Products are exported in separate files. Claude cannot easily “join” these (e.g., linking a customer’s specific tag to their purchase frequency) without massive manual cleanup.
- The “static” trap: Your data is outdated the moment you hit “Export.” By the time you finish your analysis, new orders and refunds have already changed your inventory and LTV.
- Context loss: CSVs often strip out crucial metadata like specific UTM parameters or discount code associations, making it impossible to see which marketing efforts actually drive profit.
- Browser crashes: Attempting to upload a CSV with 50,000+ orders often hits Claude’s context limits or causes the browser tab to hang.
✨ To bypass these limitations, Windsor.ai automates the entire pipeline, turning hours of manual data prep into a real-time, one-click Shopify to Claude integration.
Manual vs. automated: Choosing your method to connect Shopify to Claude
| Feature | Manual CSV export | Windsor MCP (automated) |
| Setup time | 15–30 minutes per export | < 1 minute (one-time setup) |
| Data freshness | Static (snapshot in time) | Real-time (live API bridge) |
| Data joining | Manual VLOOKUPs/Joining | Auto-joined (Orders + Customers + Products) |
| Scalability | Limited by browser/file size | High (Optimized for large-scale stores) |
| Technical skills | Spreadsheet proficiency required | No-code |
| B2B context | Strips metadata/tags | Preserves customer tags & UTMs |
Conclusion
In the competitive world of e-commerce, the winner isn’t the one with the most data—it’s the one who can act on it the fastest.
The traditional method of manual CSV exports is more than just a time-sink; it’s a barrier to real-time decision-making. By connecting Shopify to Claude via Windsor.ai, you effectively hire a fractional Data Scientist who works 24/7.
Whether you are auditing your net margins, predicting stockouts, or uncovering hidden high-LTV customer segments, the combination of Windsor’s seamless pipeline and Claude’s analytical power gives you a massive unfair advantage.
🚀 Stop wrestling with spreadsheets and start asking the questions that actually move the needle for your store with Windsor.ai. Start for free now: https://onboard.windsor.ai/app/shopify.
FAQs
What is the fastest way to connect Shopify to Claude?
The fastest method is using the Windsor.ai MCP connector. It allows you to create a real-time bridge in under a minute without exporting files or writing code.
Why is the Windsor MCP better than a Shopify CSV?
Instant integration and always fresh data. A CSV is a “frozen” snapshot. The Windsor MCP allows Claude to see today’s orders, refunds, and inventory levels instantly.
Can I use Claude to predict future sales?
Yes. By analyzing your historical order_created_at data, Claude can identify seasonal trends and provide data-backed forecasts for the coming months.
Can I analyze multiple Shopify stores at once?
Absolutely. Agencies can authorize multiple Shopify stores in Windsor and ask Claude to: “Compare the AOV across all three of my apparel stores this month.”
Does it support custom Shopify fields?
Yes, Windsor maps standard and custom fields so Claude can read your unique tags and metafields clearly.
Can I track discount code effectiveness?
Yes. Claude can calculate exactly how much margin you lost vs. revenue gained per specific order_total_discounts_set.
Can Claude help me write better product descriptions?
Yes. You can ask: “Based on the top-selling features and customer notes for SKU-123, write a 200-word SEO-optimized description.”
Is there a limit to how many orders Claude can see?
Windsor optimizes the data load, allowing Claude to process thousands of orders that would normally crash a browser tab if uploaded as a file.
Can I see where my customers are coming from?
Yes, by pulling order_sales_channel or UTM data, Claude can tell you if your best customers are coming from Instagram, Search, or Email.
Do I need to be a developer to set this up?
No. This is a 100% no-code solution. If you can log in to Shopify, you can connect it to Claude.
Can Claude see my customers’ credit card information?
No. The Windsor connector only pulls sales, product, and customer metadata via the Shopify API. It never has access to sensitive payment or credit card details.

