 AI insights
 About us
 Careers
 Security
 Customer reviews
 Contact us
 Affiliate program
 Solution partners
 Looker Studio templates
 Tableau templates
 Facebook Ads templates
 Google Ads templates
 Data fields & Metrics
 AI prompt library & Guides
 Product documentation
 API documentation
 Case studies
 Blog
Blog Data models
 Windsor vs Supermetrics
 Windsor vs Fivetran
 Windsor vs Portermetrics
 Last updated: 15 April 2026
Looker, Qlik Sense, and Tableau are the most widely used BI tools in 2023.
So you’ve managed to integrate data across your various analytics streams as well as from your offline customer relationship management (CRM) system. You want to extract Business Intelligence (BI) from it, but which dashboard system is best for you?
Let’s find out, by taking a look at the offerings from three different competitors: Tableau, Qlik, and Looker. Their BI dashboards are among the most widely used today, so let’s dive in there!

Try Windsor.ai today
Access all your data from your favorite sources in one place.
Get started for free with a 30 - day trial.
Tableau
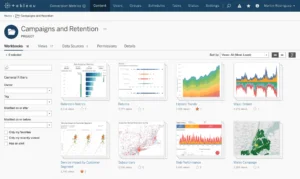
Tableau Desktop. Source: tableau.com
What they have:
Tableau offers a number of solutions for data visualization: a desktop option, a server program for private clouds, and a server instance hosted by Tableau itself to minimize setup time.
Pros:
1.Easy to get started.
- Installation was quick and easy.
- Creating the first charts and putting them into a dashboard was straightforward, even for a new user.
2.Flexibility with a variety of data sources.
- Importing data from standard sources was easy.
- Tableau supports a wide variety of sources.
- The software is able to do some transformations and aggregations on the fly.
Cons:
1.Some issues with the user interface for those used to other options.
- If you’re familiar with products from competitors such as Qlik, you might be surprised by the differences in how the products relate information between charts and dashboards. Global filtering can also take some time to setup.
2.Desktop version slow with complex transactions, as well as with large datasets, on consumer hardware.
- When it came to heavier transformation and wrangling, timestamps in different formats, or more regex-like transformations, Tableau fell short.
- With large datasets, Tableau became sluggish, particularly past about 20GB on our MacBook. Your mileage may vary depending on your setup.
3.Cloud products seemed outdated.
- The cloud version felt antiquated in comparison with Tableau’s competitors, with lots of Extract, Transform, and Load processing, and data transfers back and forth.
Qlik:
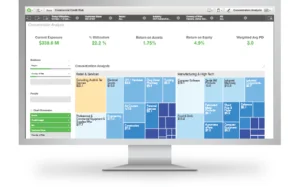
Qlik Sense Enterprise. Source: Qlik
What they have:
Qlik has three different products, the older QlikView, the new Qlik Sense, and the Qlik Sense Cloud edition.
Pros:
1.Easy to use.
- Qlik is intuitive; you can create charts easily without much effort.
2.Fast with small datasets.
- Qlik is nice for exploration when it subsets globally if you, for example, Qlik on a certain Day. This makes it really fast for data analysis and seeing what’s going on in your data streams.
Cons:
1.Issues with lots of data.
- Qlik Sense started getting slow for us at around 5GB of data.
- With even larger datasets, it became unresponsive.
2.Prompts to use cloud version not helpful.
- After dealing with the above issues, Qlik advised us to switch to the cloud version, but we the problem persisted.
Looker:
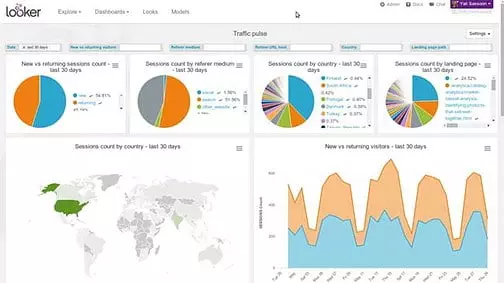
Looker. Source: Looker.
What they have:
Looker has purely cloud-based products. You can run them via an instance hosted for you by Looker, or you can run it on your own private cloud in-house..
Pros:
1.Easy to use.
- Setup was quite easy.
- Creating charts and dashboards was very simple and intuitive.
- Sharing charts, or “Looks” as Looker calls is also easy since everything is done in the browser.
- Exporting data was simple.
2.Easy to customize.
- It’s straightforward to write custom queries for your Looker instance.
3.Great with large datasets.
- With bigger datasets, Looker didn’t experience any slowdowns or issues. With Looker it is also easy to write custom queries or export data.
Cons:
Expensive
- You’ll be looking at at least $5,000.00 (USD) a month for using this system. While Qlik and Tableau aren’t exactly cheap themselves, they’re much cheaper than Looker.
Who’s the winner: Qlik or Looker or Tableau?
If money is no issue, our favorite is Looker. It’s modern, easy to use, eliminates some of the ETL needs, and it’s very easy to share charts both inside and outside the company.
If you need something cheaper, the other options aren’t bad. We prefer Qlik if you are working with a small database.
What did you think of our Looker vs. Tableau vs. Qlik comparison? Which features are on your must-have list?
Want to Boost the Performance of Marketing? , book a Free Demo of Windsor’s Marketing Attribution Software, to see how it helps you get the best out of your marketing activities.
Try Windsor.ai today
Access all your data from your favorite sources in one place.
Get started for free with a 30 - day trial.
More to read:
Best Looker Studio Examples in 2023
Looker Studio vs Power BI in 2023: Which is better?
Looker Studio Template Gallery
What can you use Looker studio for?
Google Data Studio SEO Reporting Template
Benefits of Google Data Studio Templates
What are Looker Studio Connectors?

