 AI insights
 About us
 Careers
 Security
 Customer reviews
 Contact us
 Affiliate program
 Solution partners
 Looker Studio templates
 Tableau templates
 Facebook Ads templates
 Google Ads templates
 Data fields & Metrics
 AI prompt library & Guides
 Product documentation
 API documentation
 Case studies
 Blog
Blog Data models
 Windsor vs Supermetrics
 Windsor vs Fivetran
 Windsor vs Portermetrics
 Last updated: 6 April 2026

Looker Studio (formerly Google Data Studio) is a powerful, free data visualization tool that lets you create interactive dashboards and highly customized reports.
This platform is transforming the analytics and performance marketing industry by offering an intuitive set of features for report creation, sharing, and scheduling. With Looker Studio, you can track your company’s or client’s KPIs, visualize trends, and compare performance across channels over time.
When combined with Windsor.ai’s Looker Studio connectors, reporting becomes even faster and more effective. You can integrate data from 325+ sources in minutes, eliminating manual formatting and exports. Plus, you can use a vast library of pre-built Looker Studio templates for various channels and reporting purposes, removing the need to build dashboards from scratch.
Read this guide to explore Looker Studio’s features and benefits and master the art of high-quality, insightful reporting with our pro tips.
What is Looker Studio?
Looker Studio is a leading reporting tool from Google that lets you visualize raw data in customizable dashboards using charts, graphs, tables, and other visual elements.
So why is Looker Studio a game-changer for agencies and enterprises?
Manual report creation is time-consuming. You need to collect data from multiple marketing platforms and merge it into one massive spreadsheet, and then repeat the process weekly, monthly, quarterly, or yearly. Looker Studio streamlines this, saving both time and sanity.
Key features of Looker Studio
The platform transforms reporting from a tedious task into a few-click action, thanks to these powerful features:
Interactive reports
Looker Studio enables dynamic, real-time reporting by automatically pulling the latest data from various sources and helps you gain valuable insights into your marketing campaigns across the channels. With dynamic reporting, you can also visualize different time ranges across your charts.
Then, you can build customized reports and share them with any external user (team member, stakeholder, or client). Reports are interactive, allowing users to adjust date ranges, apply filters, or add metrics to display the data they need.
🔌 With Windsor.ai connectors, you can sync data from 325+ platforms, such as YouTube, Google Ads, Google Analytics 4, Meta Ads, and many more, without scripts or manual exports.
Keep in mind that syncing GA4 is only as good as the data behind it. Running a GA4 audit before connecting your property helps catch misconfigured events or tracking gaps early. Accurate source data means your Looker Studio reports will actually reflect reality.

Data blending
Data blending is one of the most sought-after features in the Looker Studio community. It allows you to combine multiple data sources into a single dashboard, chart, or graph.
For example, if you run paid campaigns across Meta Ads, TikTok Ads, Google Ads, and Bing Ads, data blending lets you unify all this information into a single graph. This makes it easy to track cross-channel performance without juggling separate reports.
🌐 With Windsor.ai’s Looker Studio Connector, you can instantly merge all your integrated data into a single source, eliminating the need to manage multiple separate connectors.
Extensive customization
Looker Studio lets you create fully customizable dashboards. You can start from a blank canvas or use a pre-built template with a ready-made design. From there, it’s easy to drag and drop widgets, charts, and data to build a unique report. You can also apply custom colors, fonts, and formatting to match your corporate branding.
Enhanced collaboration
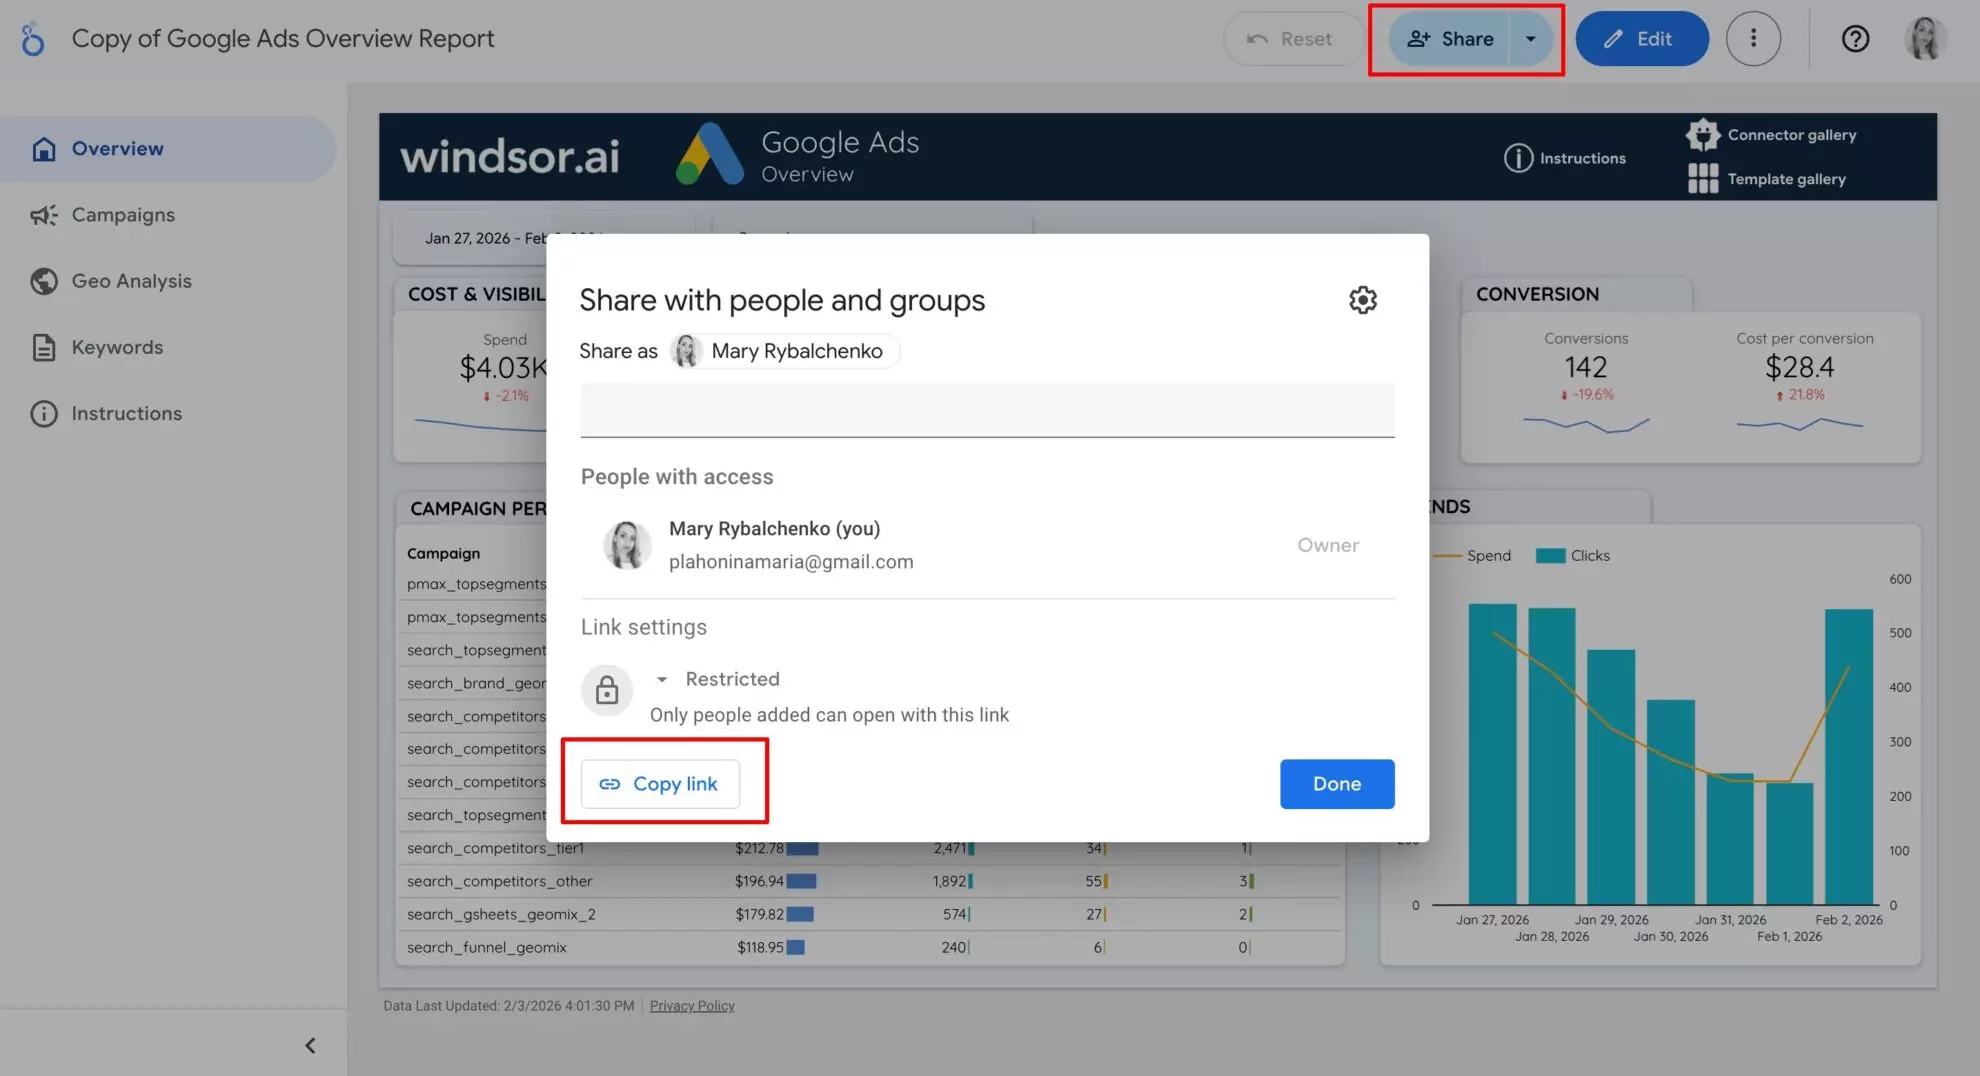
One of Looker Studio’s strongest features is how easily you can share reports and collaborate with others. Anyone with access can view, comment on, or edit your data, and multiple users can work on the same report simultaneously.
Additionally, you can assign user-specific permissions (for example, “view-only” access for clients) to ensure that no one can make changes without your knowledge.
With just a click, you can generate and share a link, allowing others to view and customize your reports.
Vast widget options
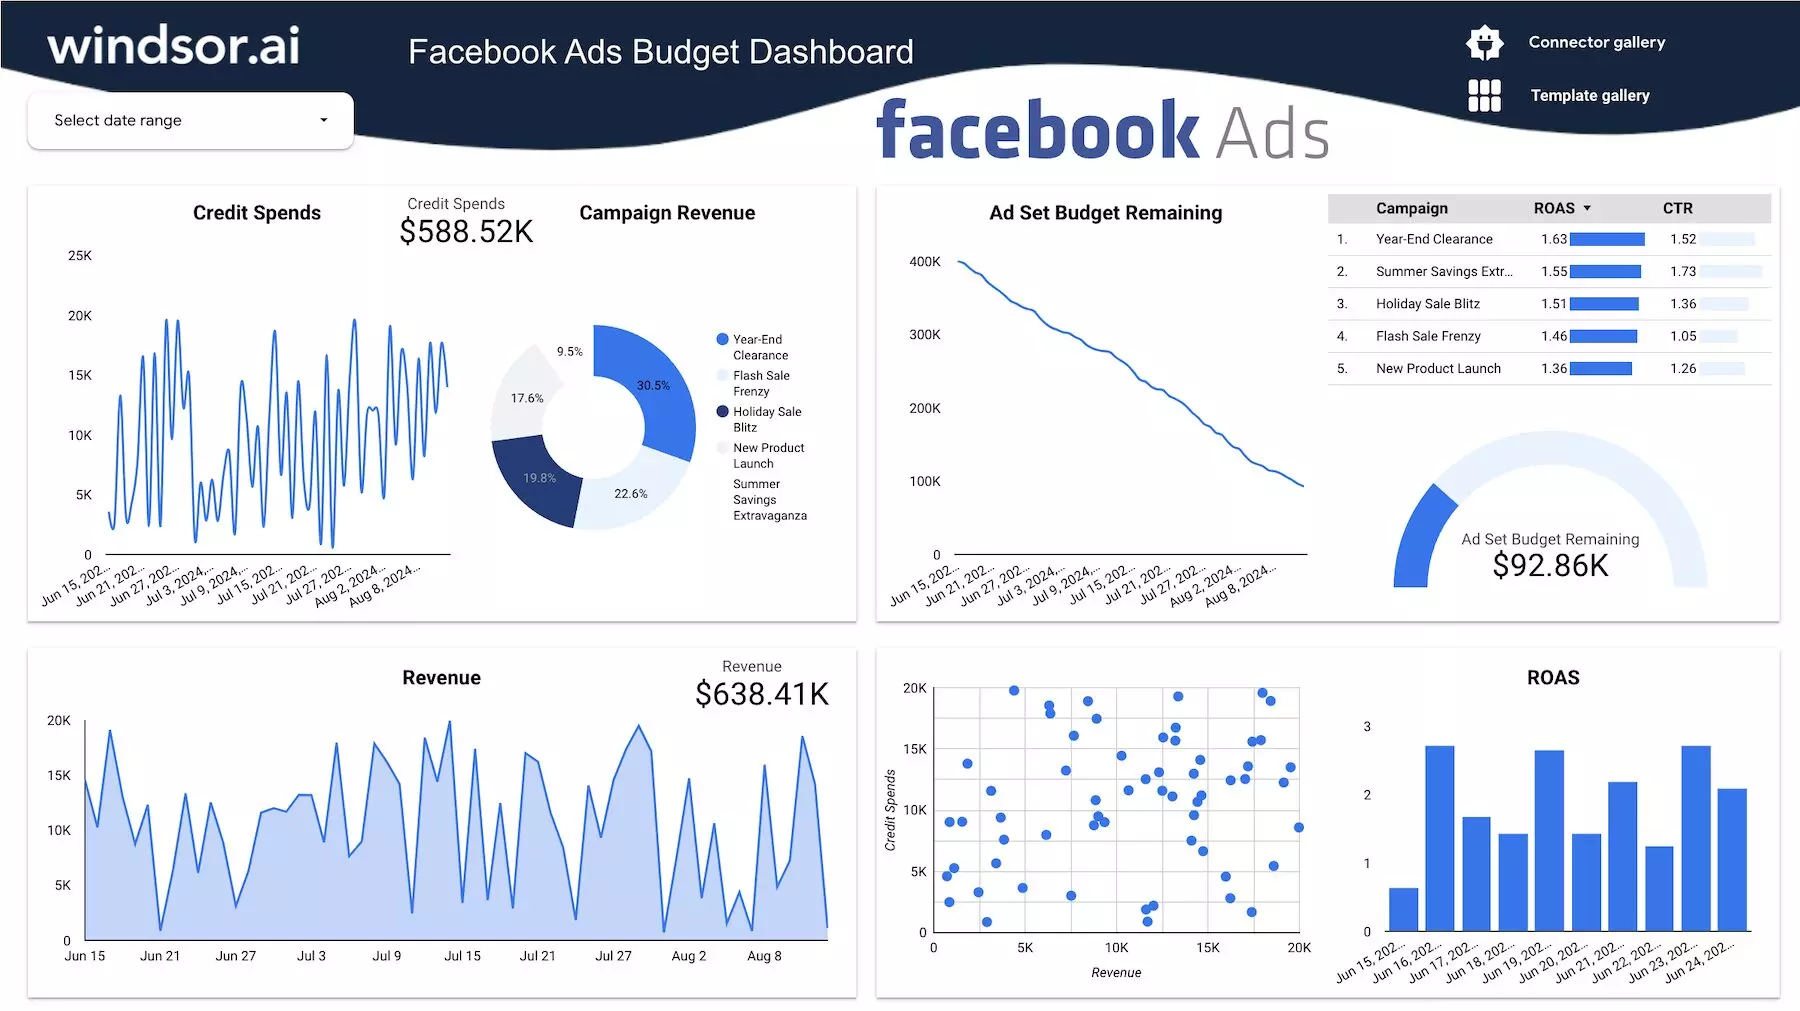
Looker Studio lets you add a great number of widgets, far beyond the 12-widget limit of traditional Google Analytics dashboards.
This flexibility gives you the freedom to visualize your data in multiple ways. You can use heat maps, pie charts, bar graphs, and more, each fully customizable with different metrics and dimensions.
The image below shows an example of a Looker Studio dashboard by Windsor.ai, featuring a variety of widgets in action.
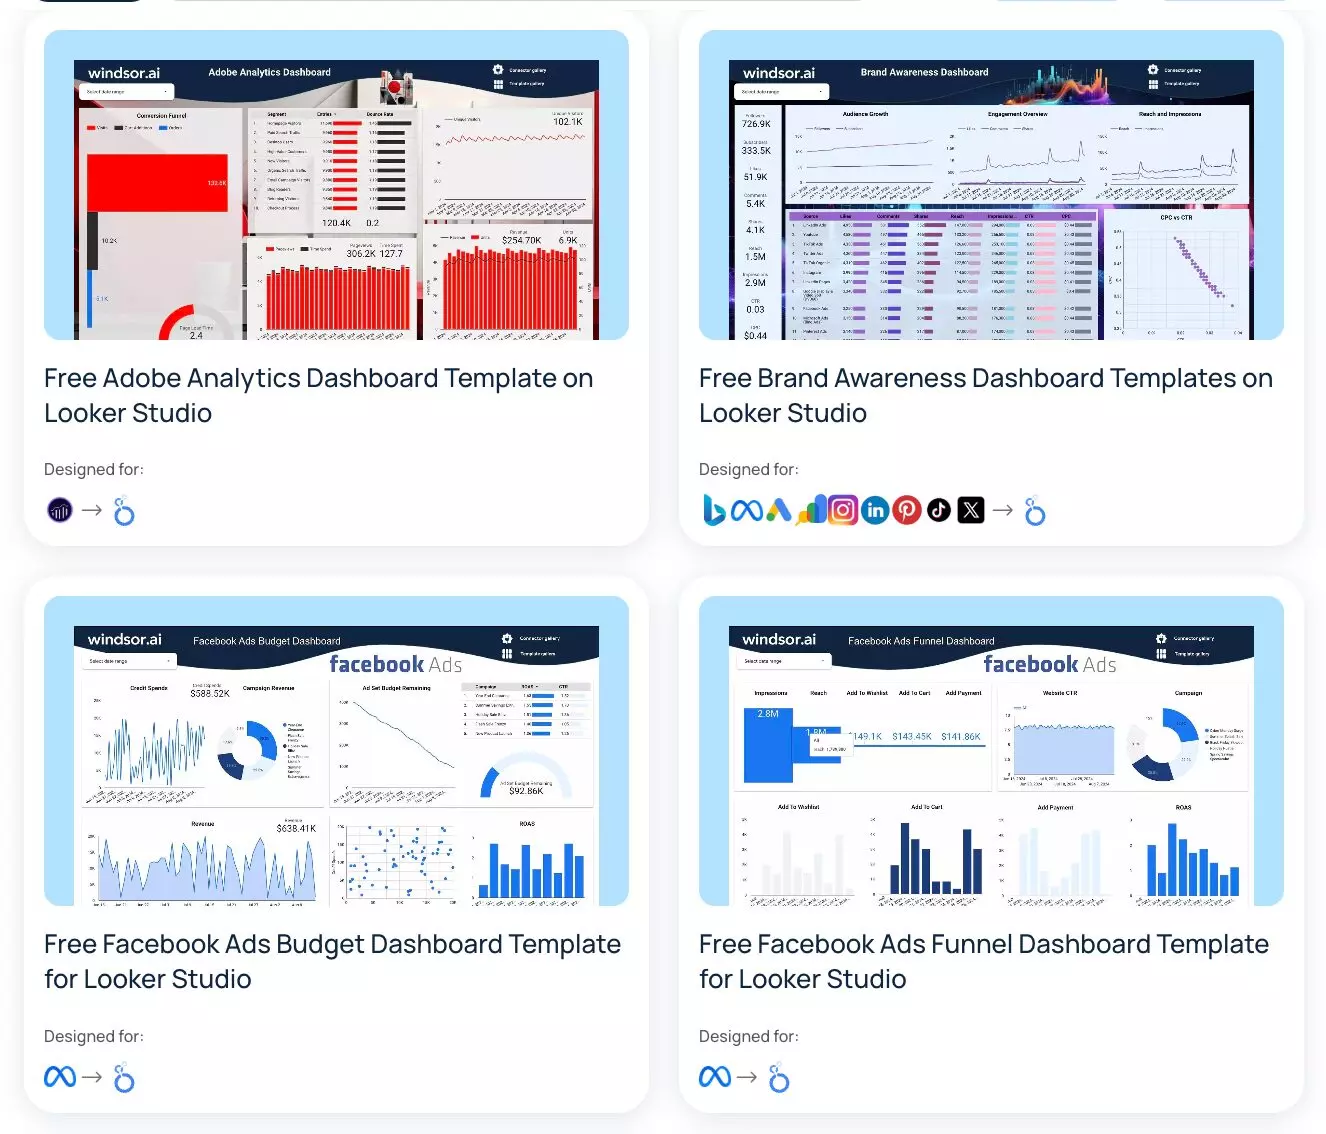
Free Looker Studio templates
Are you new to analytics or looking to accelerate client onboarding or reporting? Get started instantly with pre-built Looker Studio templates by Windsor.ai, designed for various popular data sources (Google Analytics 4, YouTube, Google Ads, Meta, etc) and cross-platform analysis. Our ready-made Looker dashboards help you create professional reports quickly and painlessly.
Active community & plenty of free Looker Studio tutorials
Everyone starts as a beginner with Looker Studio, but don’t worry! Google offers a wealth of free training resources. Combined with pre-built templates, you can become a Looker expert in no time. Tutorials cover everything from creating reports to connecting data sources, and are available as videos and guides.
For specific questions or advice, the active Looker Studio forums are a great place to get answers from the community.
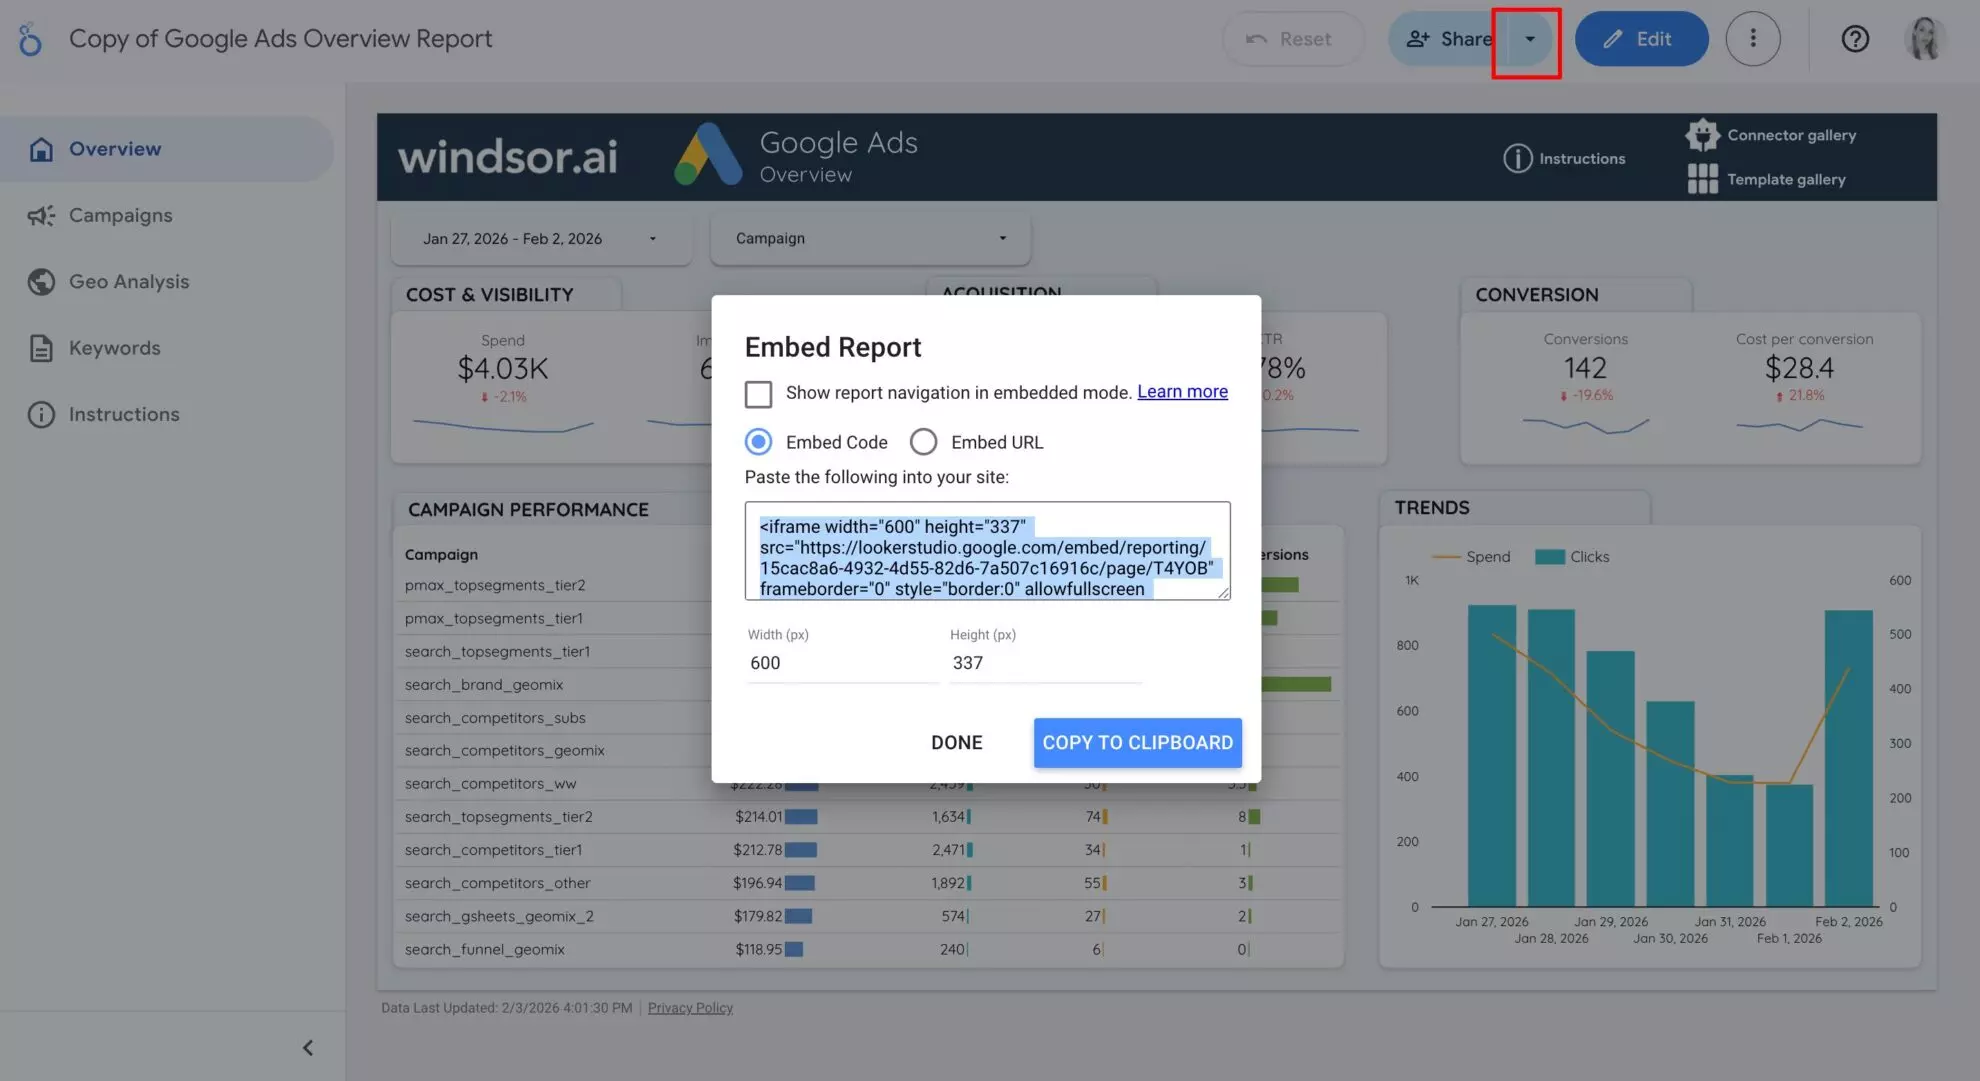
Embedded Looker Studio reports
Do you want to share your insights across social media or websites? Looker Studio makes it easy to embed your reports anywhere. With just a few clicks, you can present your findings or analysis to a wider audience. This Looker Studio feature makes it a simple yet effective marketing tool.
Simple reporting tool
Spreadsheets are great for ad hoc analysis, but they can be overwhelming for clients or non-marketers. Looker Studio dashboards turn complex data into clear, visual insights that are easy to understand and digest.
With Looker Studio, you can create fully customizable dashboards, while Windsor.ai makes it effortless to pull data from multiple sources in just a few minutes. Simply authenticate your data sources, and your dashboard is ready to go.
Connecting BigQuery datasets to Looker
If you use Google BigQuery as your marketing data warehouse, Windsor.ai makes integration seamless. Unlike other ELT tools, Windsor.ai directly connects all your BigQuery tables and automatically brings them into Looker Studio. The best part? Combining data from multiple tables requires no SQL; everything is delivered in minutes with no code.
10 major benefits of Looker Studio
Let’s quickly summarize the most impactful features and benefits of Looker Studio and why modern marketing teams love this tool:
Free tool: Looker Studio is completely free, making it accessible to companies of all sizes (startups, SMBs, and enterprises alike).
Customizable reports: Create fully personalized reports with a wide range of designs, styles, and formatting.
Modern visual elements: Use charts, graphs, and tables to make your reports visually compelling and professional.
Automated, real-time reports: Save hours with automated reports and scheduled refreshes, especially when paired with Windsor.ai, eliminating manual data exports.
Easy sharing and collaboration: Share reports with your team or clients, assign permissions, and collaborate in real time, ensuring everyone works from a single source of truth.
Flexible export options: Export dashboards easily to Google Sheets, Excel, or PDF for offline use or further analysis. Additionally, using a flipbook creator, you can add a page-turning layer to exported reports.
Connects to multiple data sources: While native Looker connectors are limited, Windsor.ai supports integration with 325+ platforms.
Extensive filters: Narrow down insights with filters for campaigns, accounts, locations, date ranges, and more.
Advanced calculated fields: Perform math, statistical functions, case statements, and other calculations directly within your reports.
Drill-down capabilities: Dive deeper into your data within a single chart or table to uncover insights quickly.
⏳ Stop spending hours manually extracting data and building reports. With Windsor.ai for Looker Studio, all your data is automatically synced, letting you focus on what really matters: analyzing results and optimizing campaigns.
Quickly identify what’s working and what isn’t, then take action: adjust existing campaigns, create high-performing ad variants, and scale your marketing efforts. Automation frees your time so you can make smarter, faster decisions without ever leaving your dashboard.
10 pro Looker Studio tips for advanced analytics
These tips help you unlock the full potential of Looker Studio. The best way to master them is by experimenting as you go.
So, create your dashboard and follow along.
1. How to use date range filters in Looker Studio
Date range filters let you evaluate campaign performance over specific periods. Make sure your connected data sources include a date dimension to use this feature.
How to add a date range filter:
- Open a report and click Add a control → Date range control.
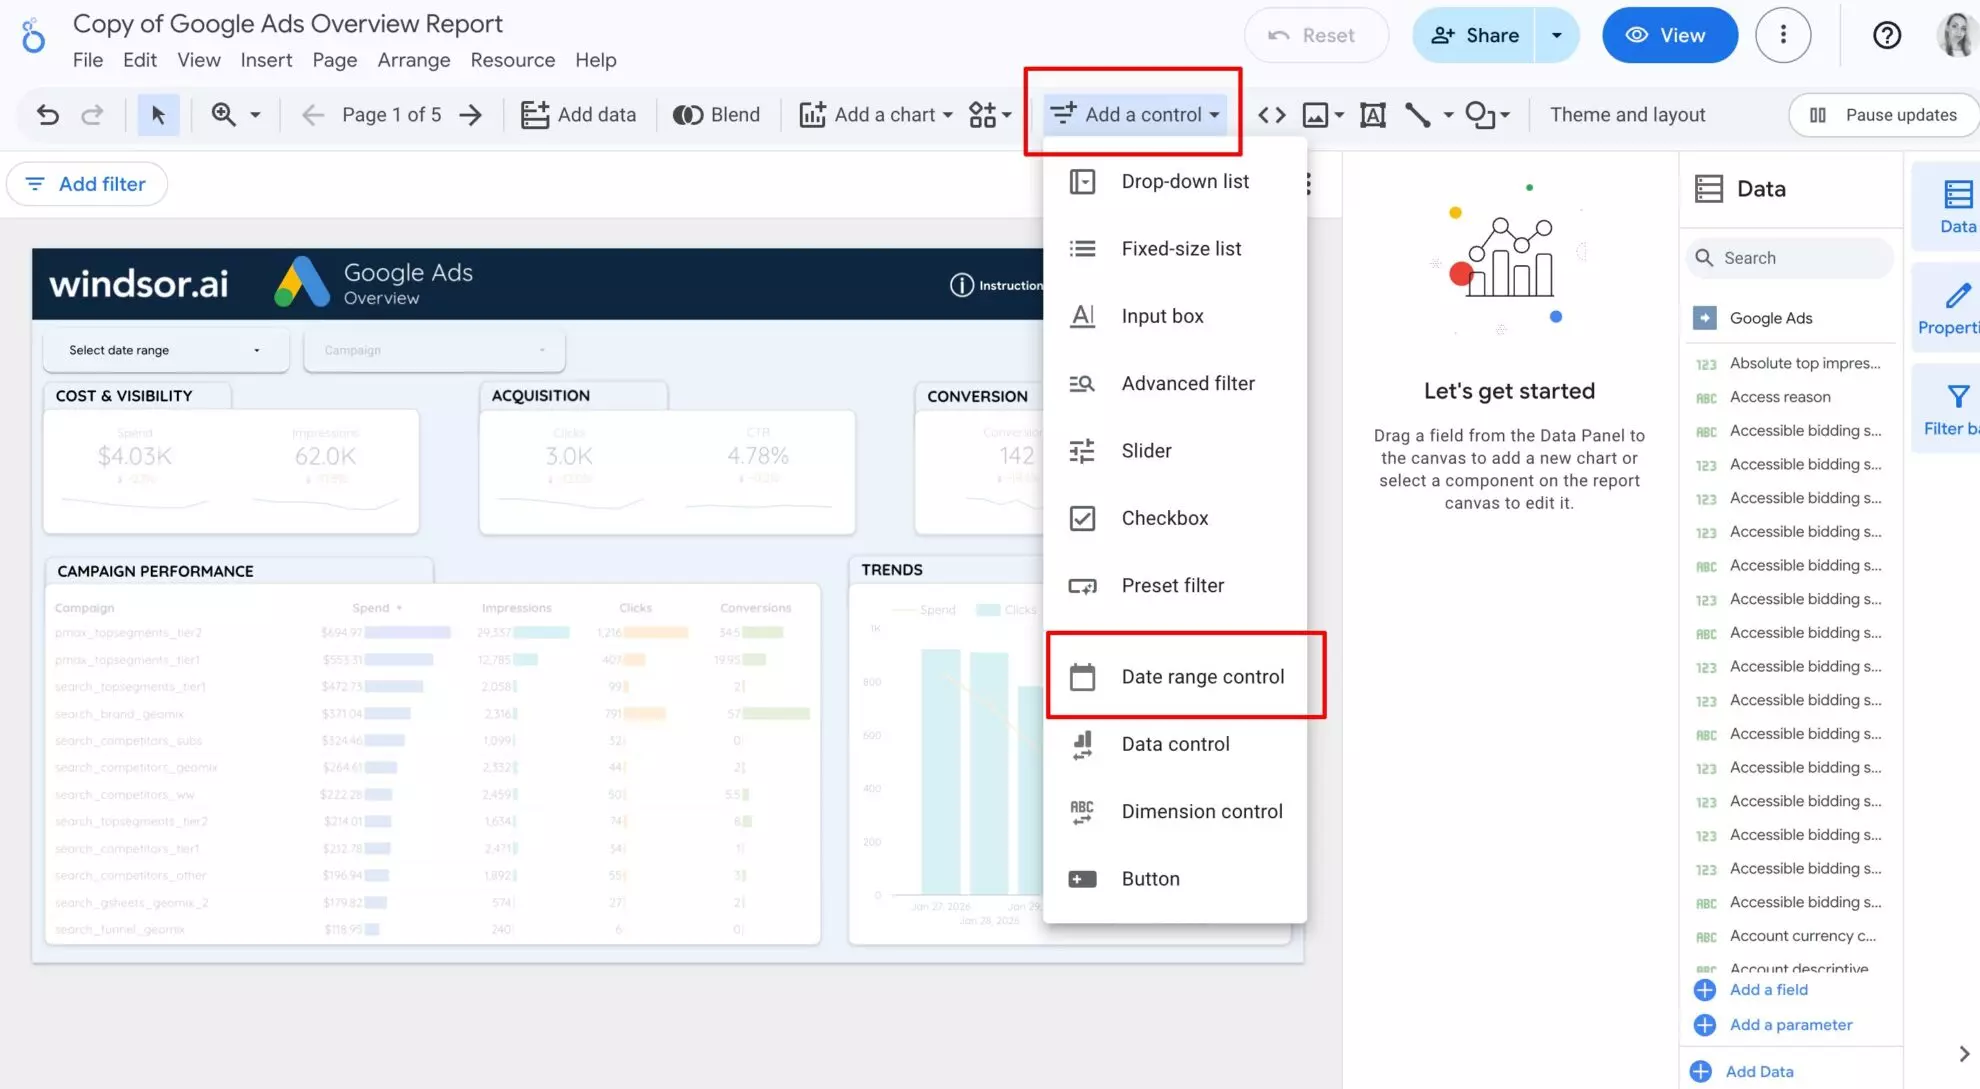
Place the filter in your preferred location (usually top left or top right).
- Click on it and navigate to the Setup section, where you can choose a desired date range from the ready options or set a custom range. Apply the date range and see your data update accordingly.
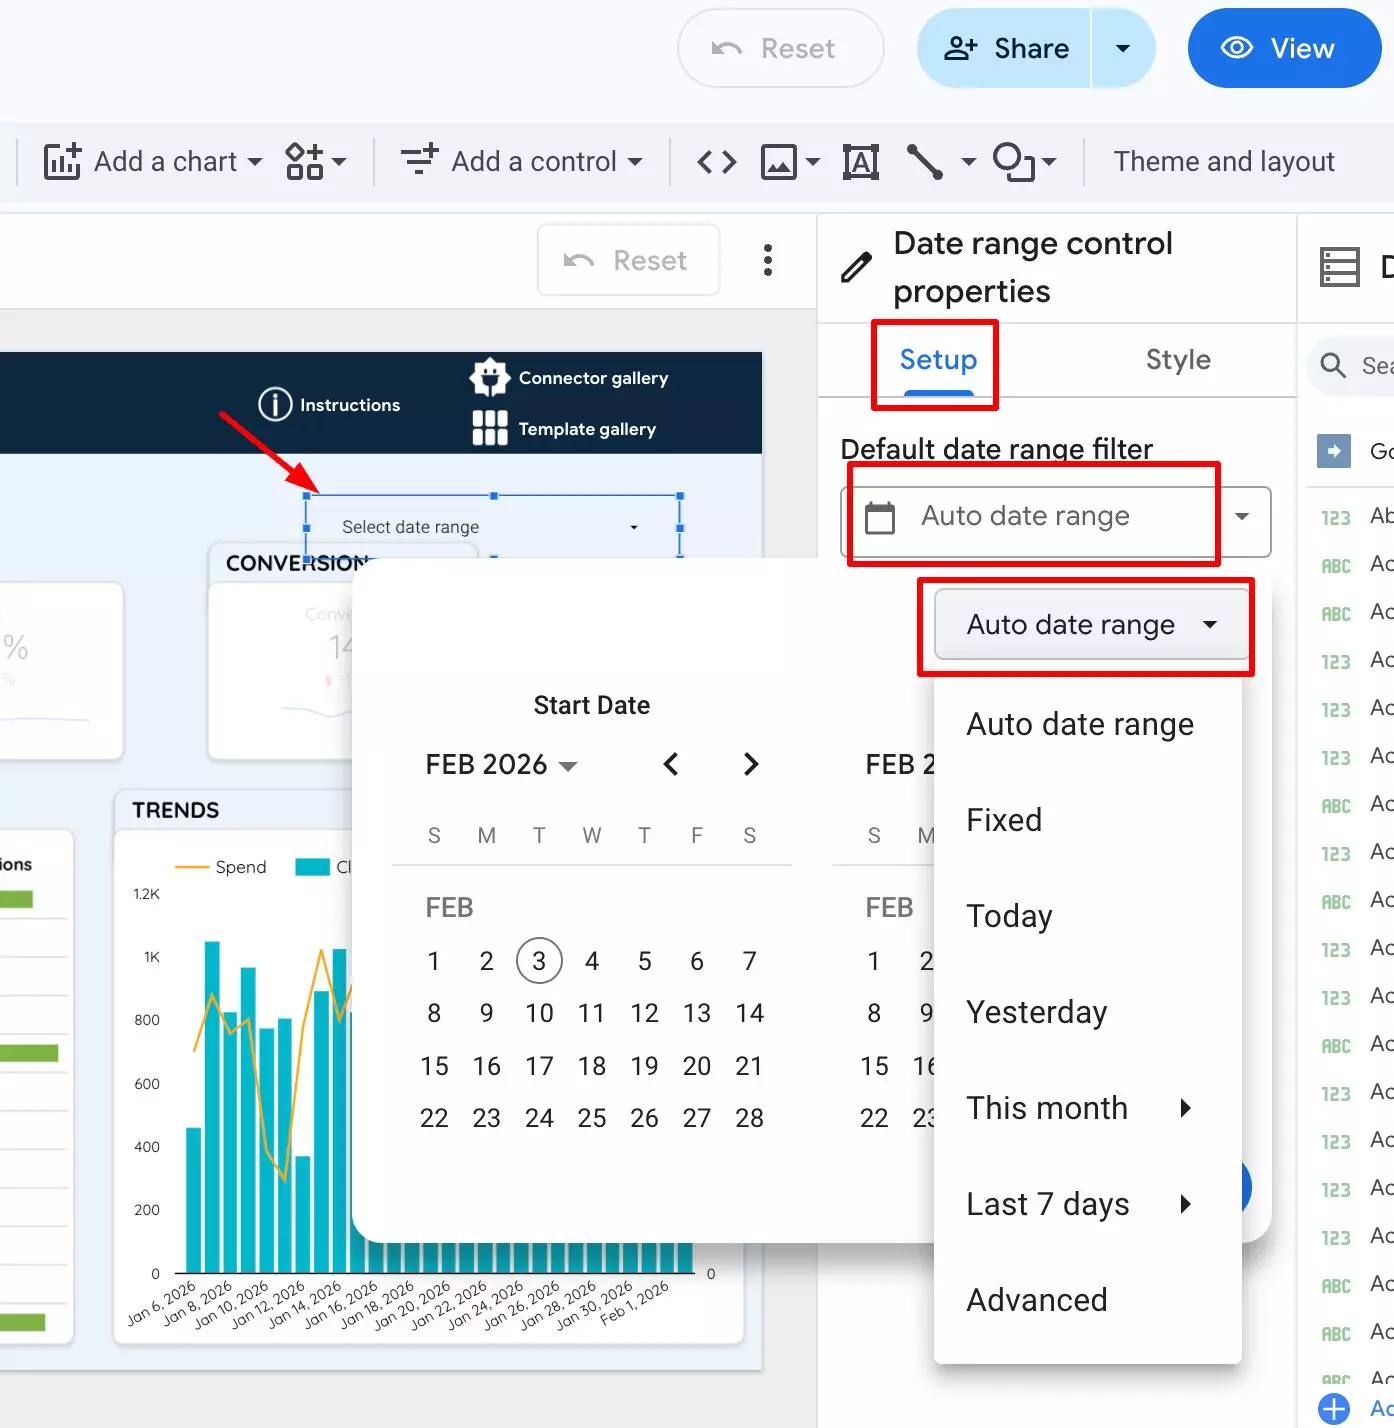
- You can further customize the appearance of the date range filter in the report through the Style section.
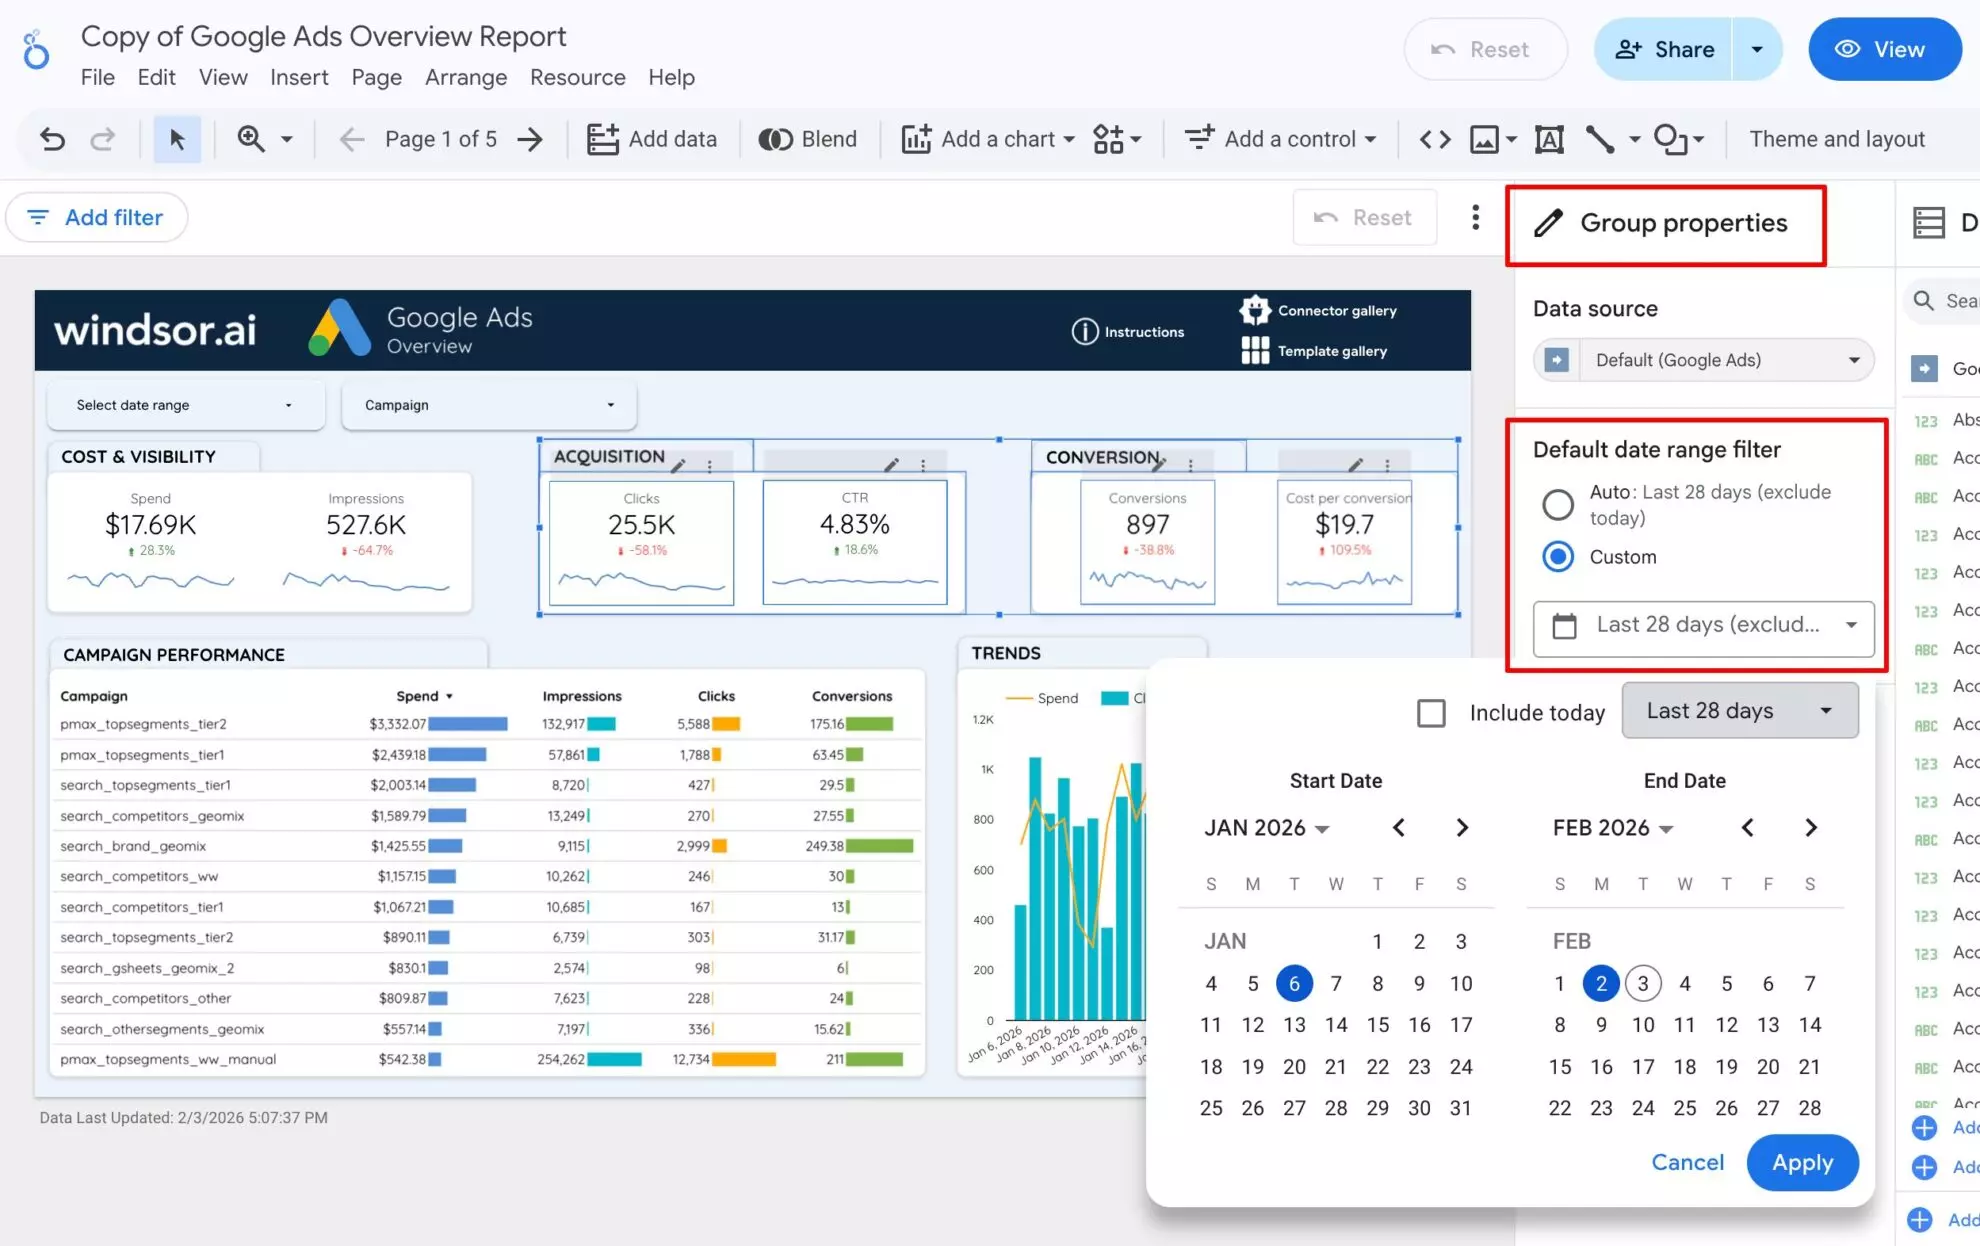
By default, the filter applies to all elements on the page. To limit it to specific elements:
- Select the elements you want to group, open the Arrange menu from the toolbar, and click Group.
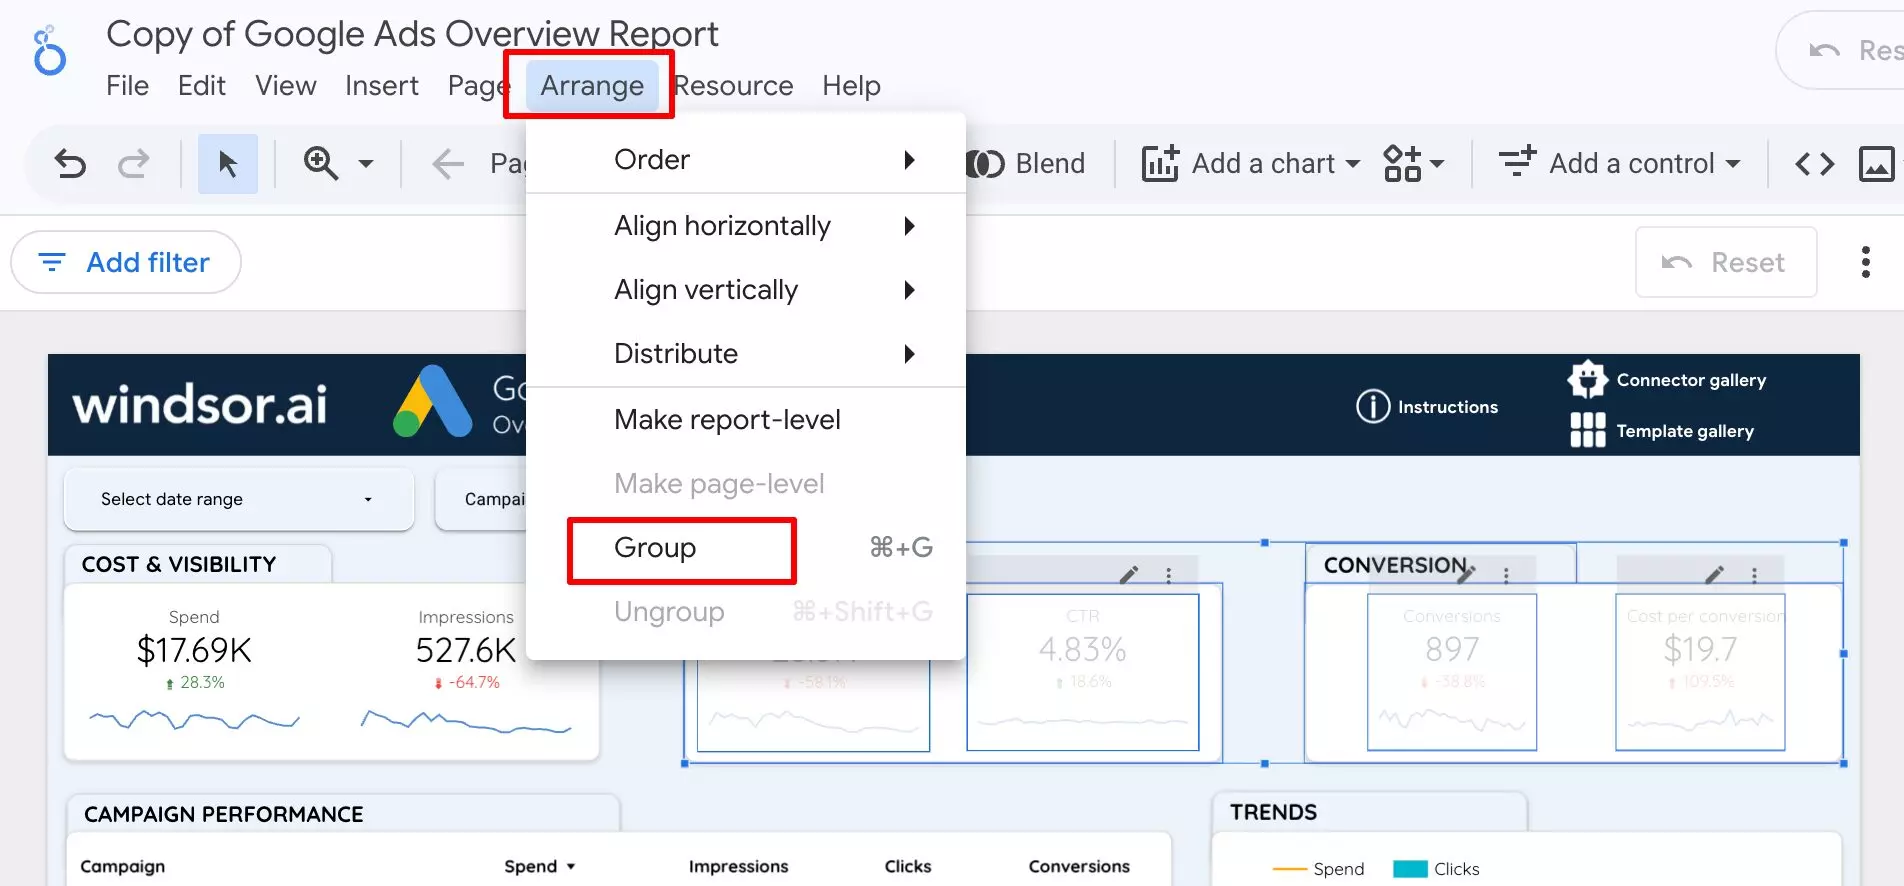
- In Group properties, select the required date range for this group.
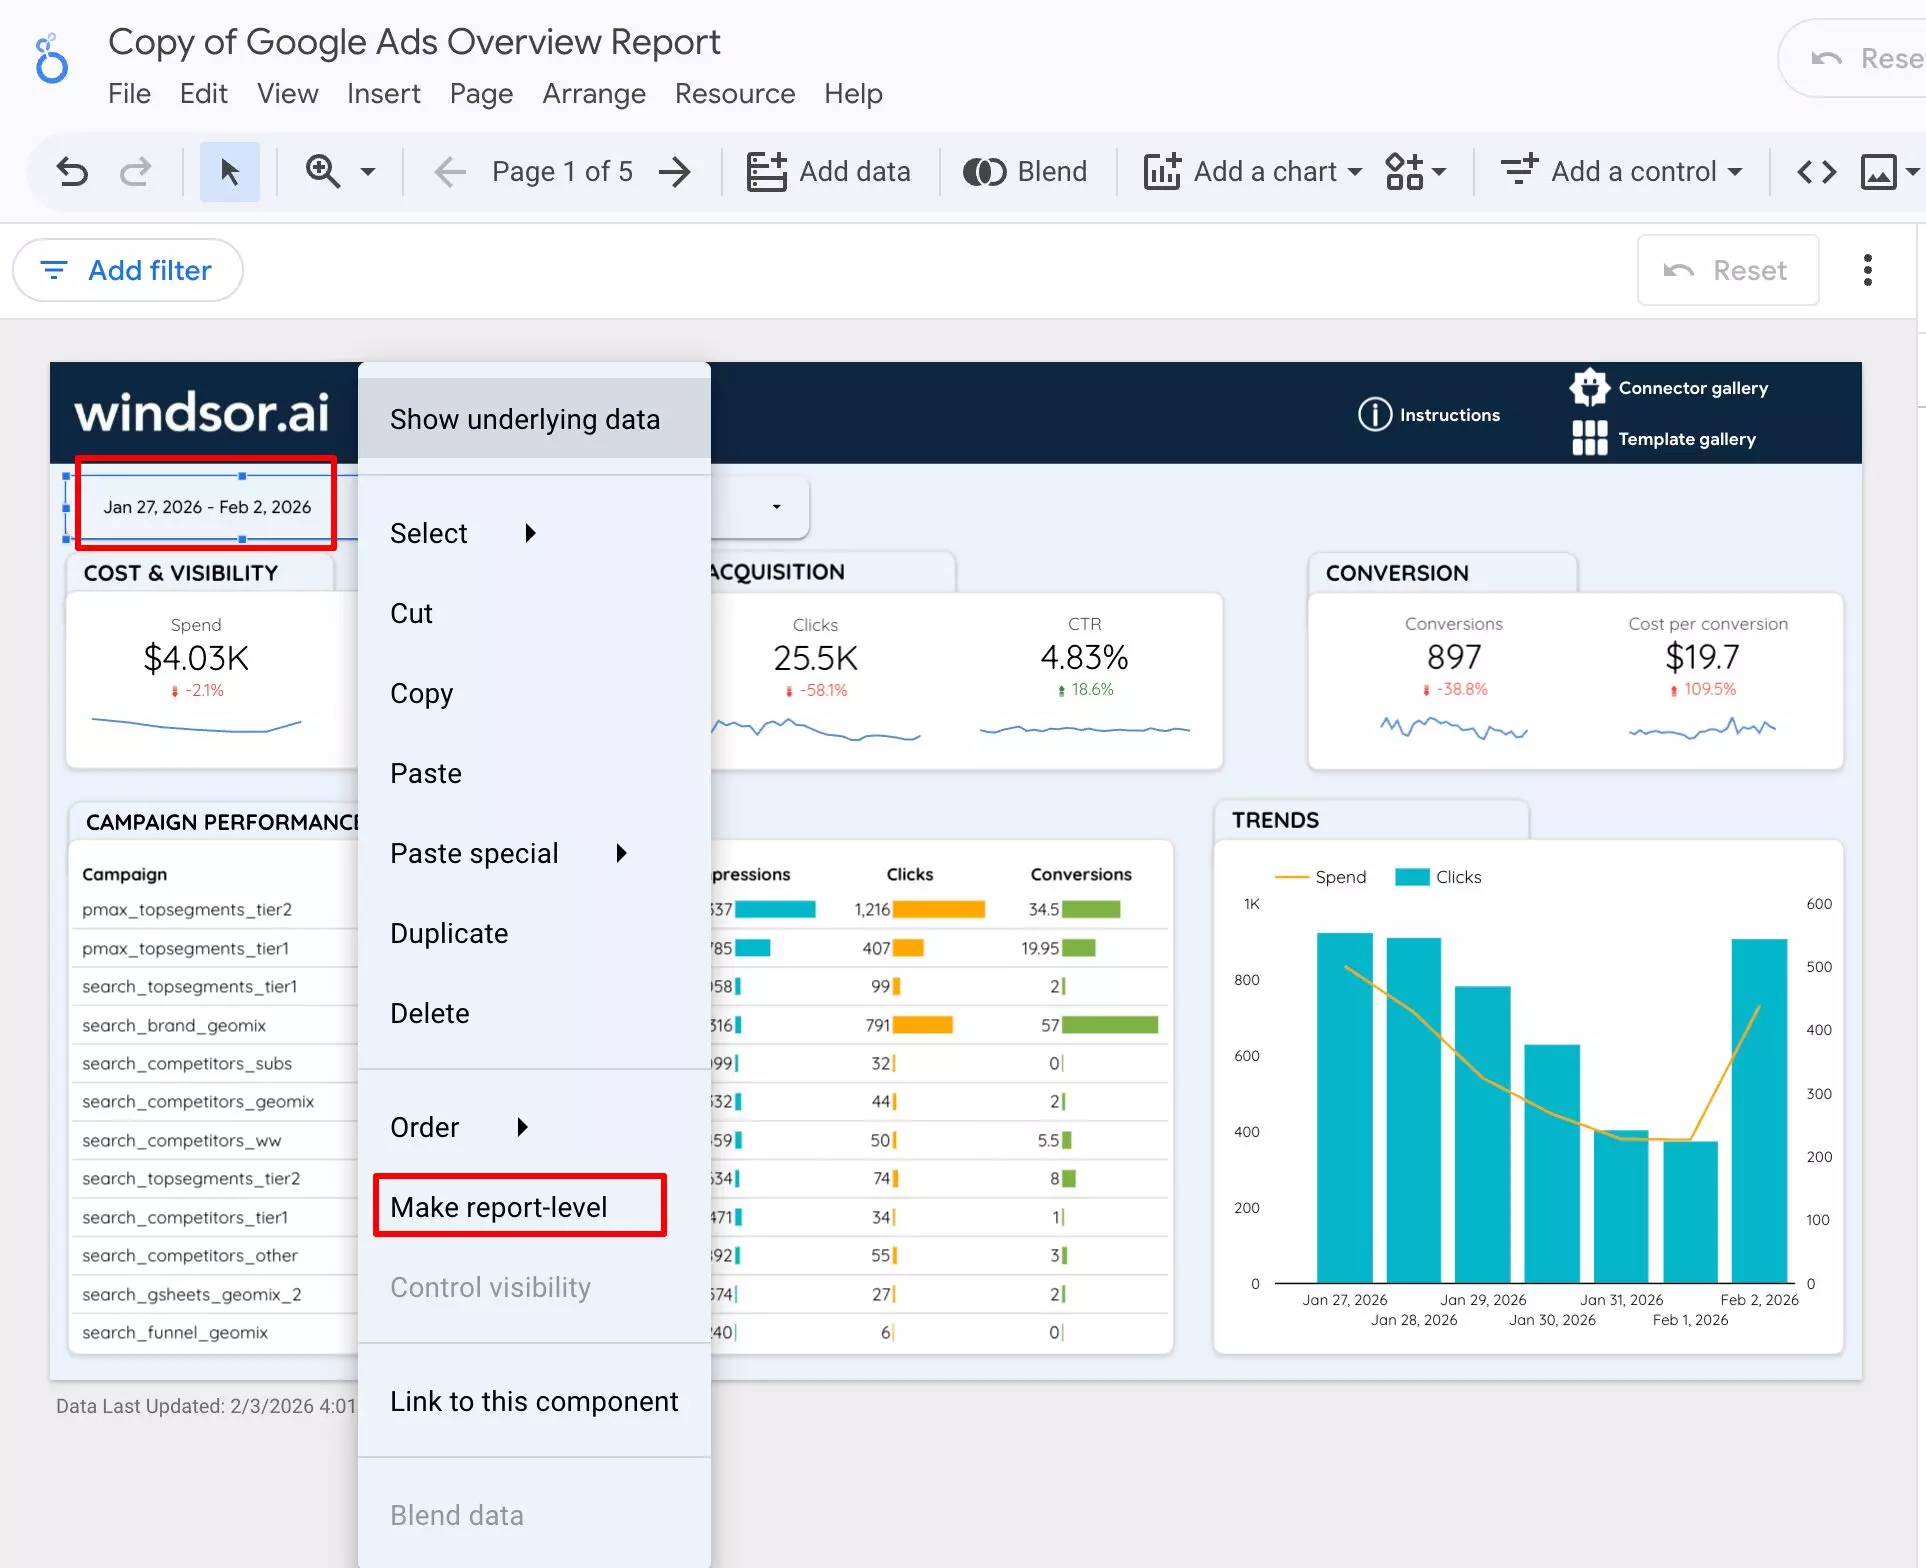
You can also add the date range filter to multiple pages:
- Right-click the date range control filter and select Make report-level.
2. How to add multiple pages in Looker Studio
Looker Studio allows you to create multiple pages within a single report, making it easy to organize data by channel, goal, or audience.
For example, a paid campaigns report can include separate pages for Google Ads, Meta Ads, and other platforms. You can also tailor pages to different levels of detail; campaign managers may want insights into creative performance, while executives typically focus on spend, ROI, and overall performance.
To add a new page:
- Click on the Page → New page in the toolbar.

After creating the page, you can change the Data Sources and Style with options under Current page settings.

Click on ‘Select Data Source’ to see available data sources and add them to the report.
At times, duplicating a page could help you save time by carrying over certain elements from the original page. You can do this by clicking on the Duplicate page under the Page option in the toolbar.

💡 Pro-tip: Name your pages as soon as you create them to avoid duplicates and keep your reports organized as they scale.
3. How to add blended data fields in Looker Studio
Looker Studio lets you blend data from up to five different data sources within a single blended data source. To do this, the sources must share at least one common dimension (also called a join key), such as date, campaign name, or account ID. Without a shared field, disconnected sources cannot be blended.
If your data sources contain similar metrics with different field names, such as clicks, impressions, or CTR across multiple ad platforms, blending is straightforward. Start by selecting a primary data source, then add additional sources and define the join condition based on the shared dimension.
⚙️ When using Windsor.ai, ELT mapping is handled automatically under the hood. Data from different channels is normalized into a consistent structure, making it much easier to create accurate blended reports without manual field matching.
How to add blended data to your Looker Studio report:
- Under Resource, select Manage blends.

- Select a secondary source from the list of available data sources, with at least one common dimension as a join key.

- After configuring the join key, click Save on the bottom right of the screen.

Now you are ready to start adding data to the report and creating charts.
🔗 With Windsor.ai, data blending is handled automatically at the ELT level, allowing you to connect a pre-blended, normalized dataset to Looker Studio, so you can avoid manual data blends and join configurations inside Looker afterwards.
The data blending feature is also useful when you need to unify multiple GA4 properties, which are often spread across different accounts. Using the Manage blends menu, you can combine data from multiple sources, properties, platforms, and accounts into a single report.
4. How to create calculated fields in Looker Studio
Calculated fields allow you to create new metrics or dimensions by applying formulas to existing fields. They help you derive custom KPIs, combine data, and apply logic directly within your reports without writing SQL or modifying the original data source.
For example, you can use functions like REGEXP_MATCH() to categorize data based on text patterns, or CONCAT() to merge multiple text fields into a single value.
To create a calculated field in Looker Studio:
- Under the data source field list, click on the blue + Add a field button and select Add calculated field.

Enter a name, define your formula, and save the field.

Once created, you can apply the calculated field to a specific chart or data table, allowing you to analyze or segment data directly within your report.
Keep in mind that calculated field formulas in Looker Studio are built using functions and arguments:
- Functions perform operations such as mathematical calculations, logical comparisons, and text manipulation. A single formula can include multiple functions.
- Arguments define the values or conditions that functions operate on.
You can explore the full list of available functions in the official Looker Studio Help Center.
5. How to change the layout and add a theme in Looker Studio
Looker Studio makes it easy to customize both the layout and visual theme of your reports. You can either choose from the default Looker theme options or fine-tune them to match your brand and reporting needs.
You can switch themes or customize colors, fonts, and backgrounds directly from the Theme and Layout panel in the right-hand sidebar.
This flexibility allows you to create visually consistent, on-brand dashboards without any design or coding experience.

6. How to embed external content in your Looker Studio report
This useful Looker Studio tip, shared by one of our Data Studio consultants, can add credibility and interactivity to your report.
You can embed external content from various sources, such as Google Sheets, web pages, or YouTube, using the URL embed feature. For example, you might include a YouTube video directly in your dashboard.
How to embed external content in Looker Studio:
- Click Insert in the top navigation bar and choose URL embed.
- Choose the area on your dashboard where you want the content to appear.
- Paste the desired URL in the setup field.

7. How to use third-party (partner) Looker Studio connectors
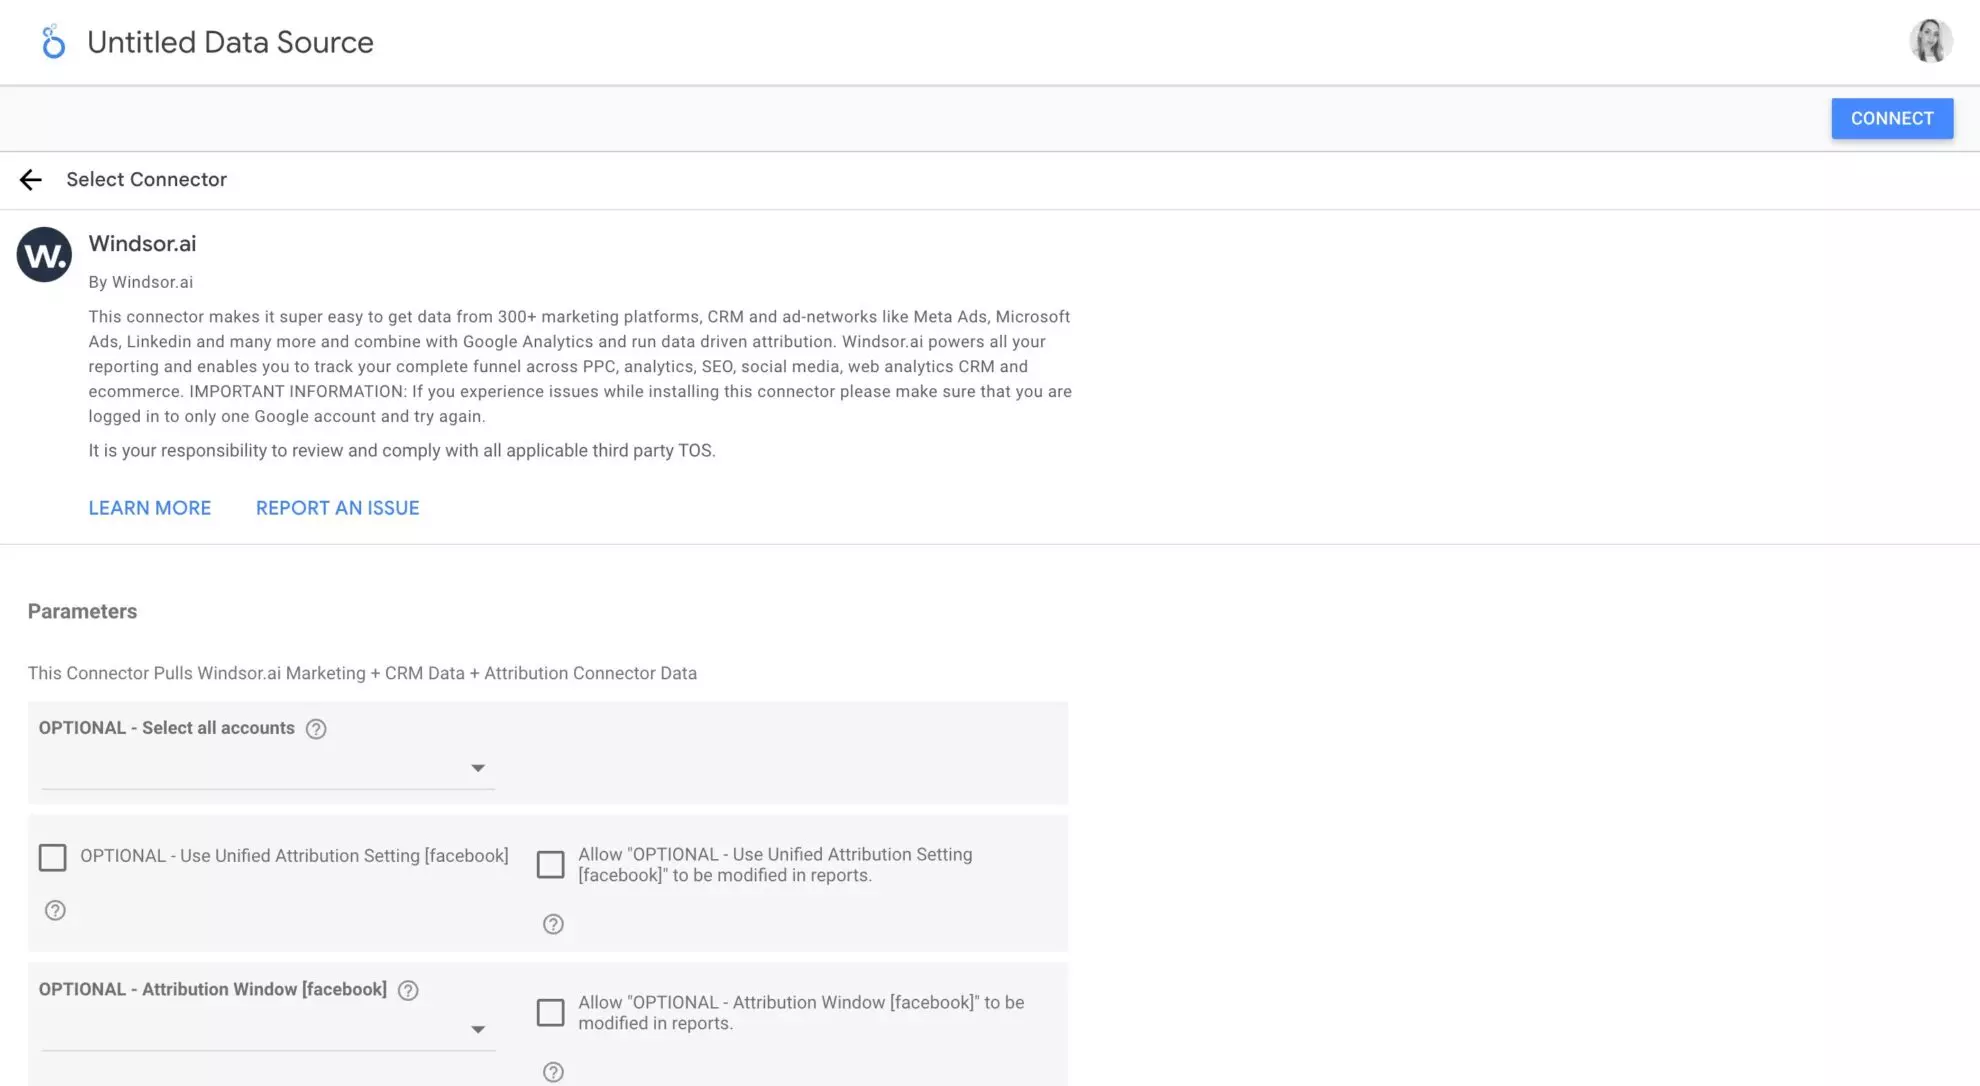
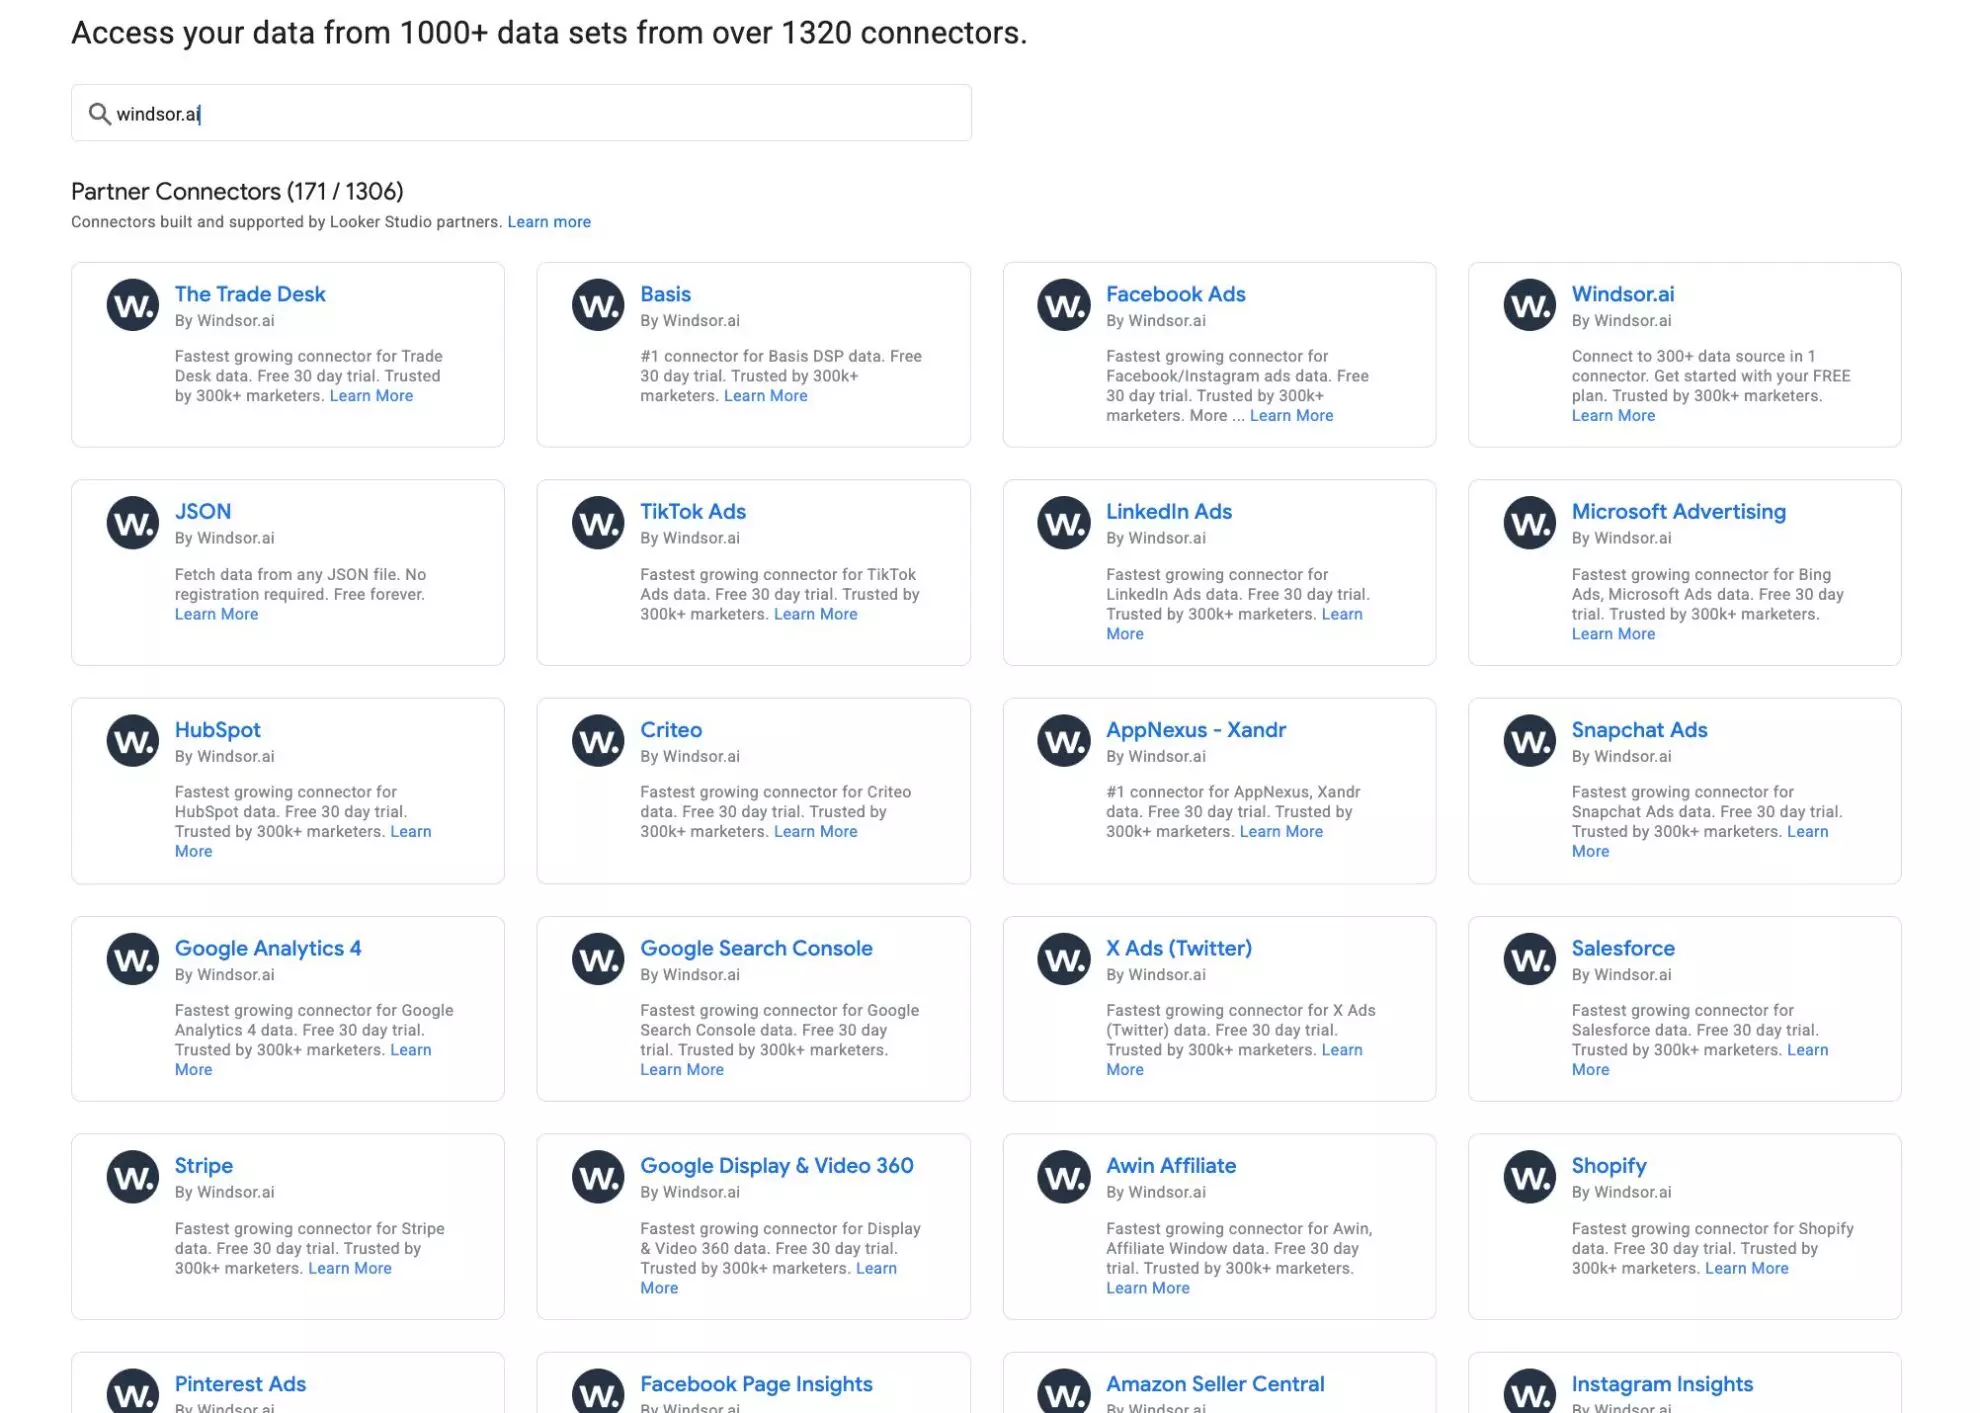
While Looker Studio provides native connectors for Google’s platforms, importing data from other tools requires third-party connectors like Windsor.ai.
Windsor.ai offers native Looker Studio connectors for over 170 platforms and enables access to 320+ data sources through the Custom Queries connector.
How to use Windsor.ai connectors for Looker Studio:
- Search for Windsor.ai in Looker Studio’s Partner Connectors pool.
- Install the connector for your desired data source with just a few clicks.
- Optionally, apply a ready-made template to get started instantly.
We provide connectors for a wide range of sources, including:
- Social media platforms
- Ad networks
- Payment solutions
- Content management systems
- CRM platforms
- Databases and data warehouses
…and many more.
Read also:
How to integrate data into Looker Studio with Windsor.ai (Documentation)
8. How to create custom dashboards in Looker Studio
Whether you’re a beginner or an advanced user, this is one of the most useful Looker Studio tips for everyone.
Custom dashboards let your reports reflect your brand elements and provide different views of data for various stakeholders. In many tools, fulfilling such requests might require a developer, but not when you use Looker Studio + Windsor.ai.
You can start with our free, ready-to-use Looker Studio templates and proceed with reporting and analysis in just minutes, instead of spending days on dashboard creation from scratch. Simply connect your data to any template and customize it by adjusting colors, metrics, dimensions, or visual elements to match your brand guidelines or unique reporting needs.

Alternatively, you can master data visualization in Looker Studio through the Community Visualization Codelab.
9. How to use metric sliders to filter data in Looker Studio
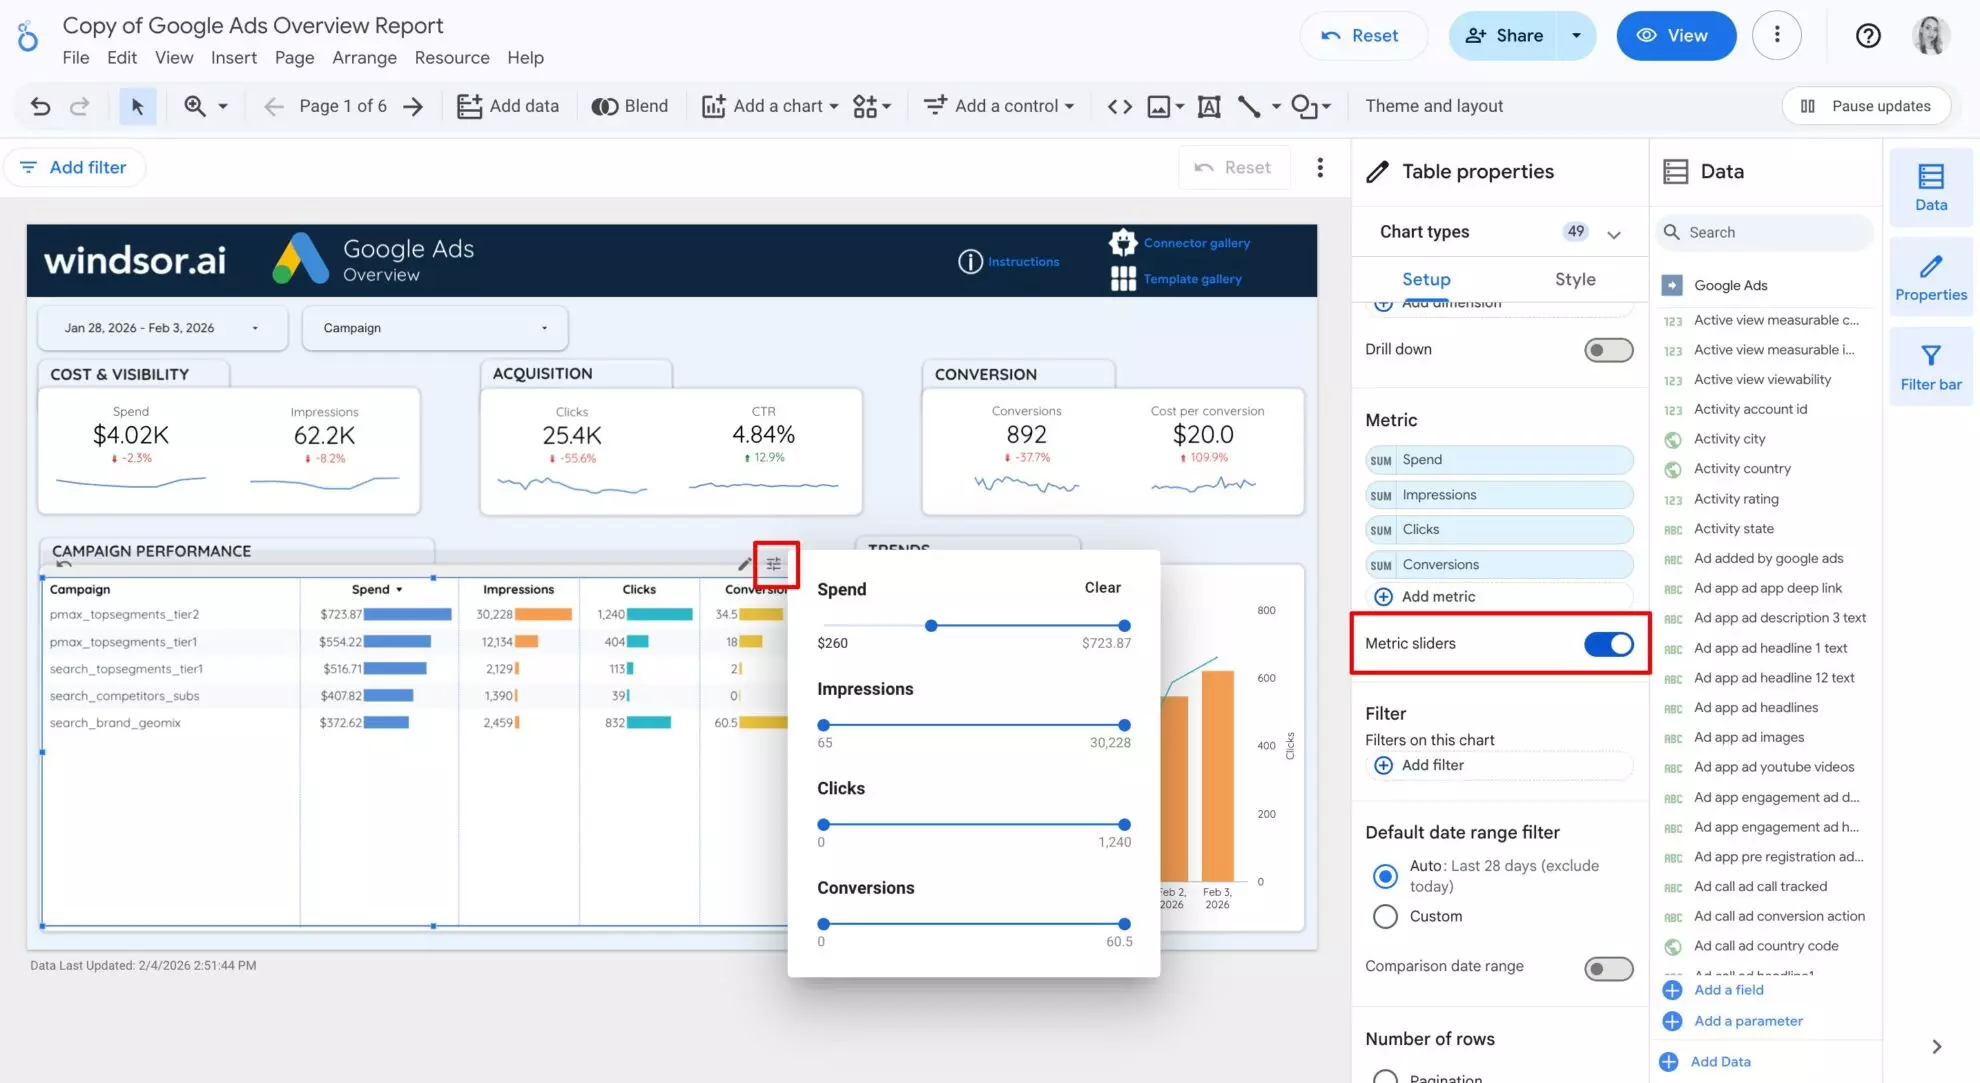
Quite an advanced Looker Studio tip: when analyzing data, using the metric sliders helps you filter the displayed data by a value range.
For example, you may want to check data for a given budget range or check campaigns for a certain number of impressions.
Adding metric sliders helps you slice and dice data to draw deeper insights.
How to use metric sliders in Looker Studio:
- Select the chart where you want to apply the filter.
- In the Setup section, under Metrics, toggle the Metric sliders button.
- Click the Filters function on the chart and adjust the parameters to your needs.
10. How to add reference lines in Looker Studio
Reference lines are an advanced Looker Studio feature that help you compare chart data against a specific value. They can be horizontal or vertical, and you can add up to 10 reference lines per chart.
Reference lines are especially useful for analyzing time series, line, bar, column, scatter, and area charts. For example, a reference line can help you track session growth and measure the impact of SEO efforts. Using an SEO analyzer alongside Looker Studio can further clarify how these metrics relate to overall performance. Using a tool like an seo analyzer alongside Looker Studio can also help you better understand how these metrics relate to your overall SEO performance.
How to add reference lines to charts in Looker Studio:
- Select the chart where you want to add reference lines.
- In the Style section, scroll down to Reference lines and click + Add a reference line.
- Set the parameters for the reference line, and it will appear on your chart.
- Repeat to add multiple reference lines (up to 10) for a more comprehensive analysis.

Challenges of using Looker Studio
While Looker Studio is a very powerful tool that allows you to pull data from different sources, visualize it, and share insights with others, using it comes with many challenges, especially for beginners.
Here are some of the most common issues Looker Studio users deal with:
A steep learning curve
While Looker Studio is easy to use for basic reporting, advanced reporting can be more complex. Handling sophisticated cases may require third-party plugins or additional setup to generate more advanced reports.
The good news: Google offers free beginner-friendly courses to help you get started with Looker Studio and build fundamental skills.
Data discrepancies
While Looker Studio integrates seamlessly with Google Suite, combining data from external sources can lead to data discrepancies.
These differences often arise because each platform may use different naming conventions, metric definitions, or calculation methods. For example, data from Google sources like Google Analytics 4 or Google Search Console may not match metrics from partner connectors such as HubSpot or Facebook Ads. Being aware of these differences is essential when blending data to ensure accurate reporting.
No native support for Excel
Since Looker Studio is a Google product, it does not support data integration from the popular Microsoft Excel. To import data from Excel, you need a workaround, which involves converting the Excel file to a CSV file or a Google Sheets.
Limited data processing capabilities
Looker Studio offers extensive visualization features but has limited advanced data processing capabilities compared to other BI tools. For example, it lacks Power BI’s SUMX function for summing columns and rows.
Additionally, Looker Studio does not support creating unions across all data sources when using blended data to create calculated fields. To simplify complex data processing, it’s often necessary to perform data blending before importing into Looker Studio, for example, using tools like Windsor.ai.
Conclusion
Looker Studio is a feature-rich and powerful tool, yet most marketers use only a fraction of its capabilities, often due to limited time to explore all options. That’s why we’ve compiled these tips to help marketers and analysts unlock deeper insights and streamline reporting through automation.
This guide covers both basic and advanced techniques, helping you uncover hidden answers in your campaign data and accelerate your time-to-insight. No matter your level of Looker expertise, these features can take your reporting to the next level.
🚀 Want to streamline your Looker reporting even further? With Windsor.ai connectors, you can automate data integration, blend multiple sources with automatic normalization, and create actionable insights faster than ever.
Start your free 30-day trial today: https://onboard.windsor.ai/.

