 AI insights
 About us
 Careers
 Security
 Customer reviews
 Contact us
 Affiliate program
 Solution partners
 Looker Studio templates
 Tableau templates
 Facebook Ads templates
 Google Ads templates
 Data fields & Metrics
 AI prompt library & Guides
 Product documentation
 API documentation
 Case studies
 Blog
Blog Data models
 Windsor vs Supermetrics
 Windsor vs Fivetran
 Windsor vs Portermetrics
 Last updated: 2 June 2026

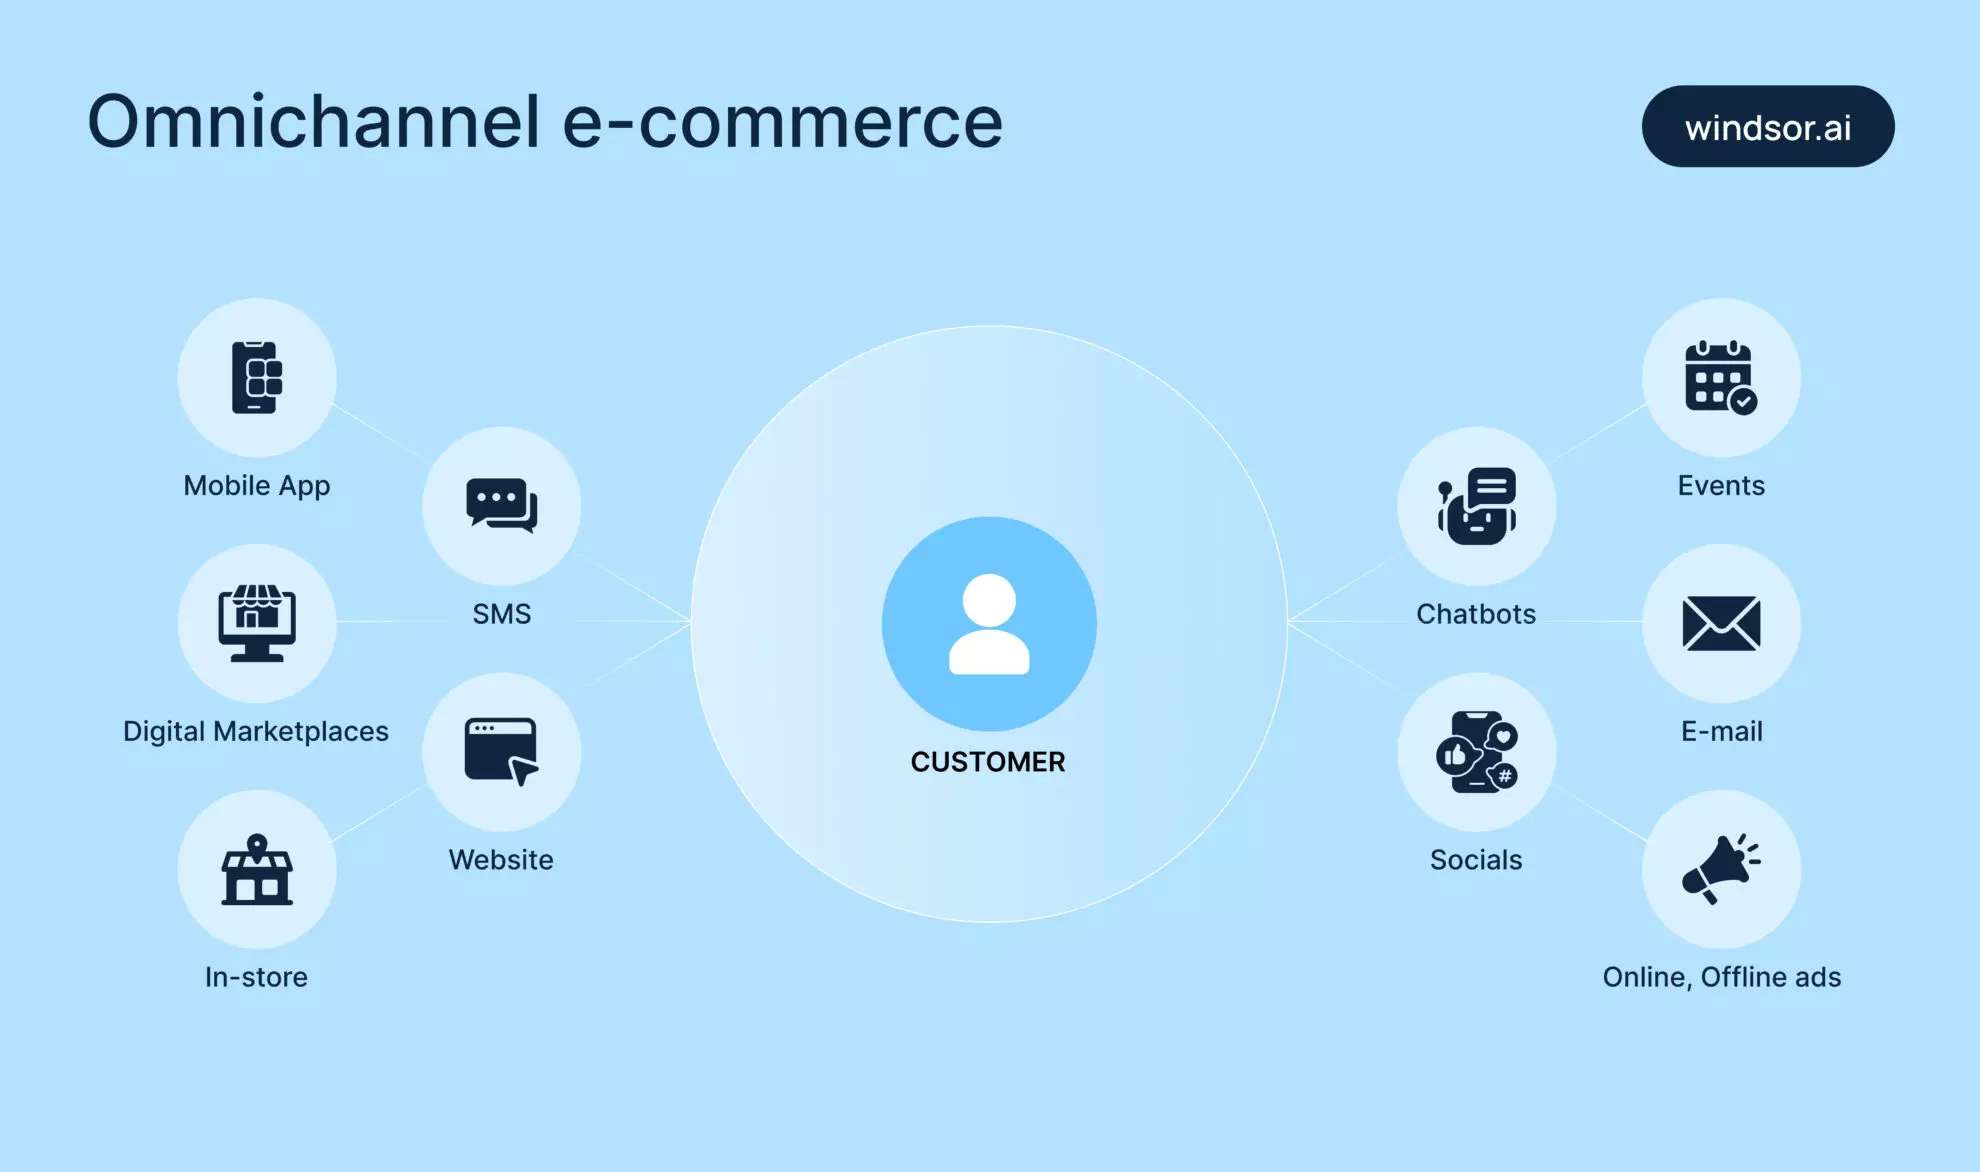
A customer bounces from Instagram Reels to Google Shopping, checks prices on Amazon, opens an email, and, maybe, buys on your Shopify store. That’s five micro-moments, across five platforms, before they even hit “add to cart.”
Now multiply that by every SKU, every audience segment, and every campaign. That’s why you cannot single out a touchpoint. Also, retailers adopting three or more channels see a 19% consumer engagement rate, compared to just 5.4% for single-channel sellers.
Omnichannel marketing analytics can thus solve the data engineering problem by providing clean, connected pipelines with smart attribution models. Dashboards are powered by ETL (Extract, Transform, Load) and ELT (Extract, Load, Transform) that automate the grunt work.
But how can you start with omnichannel marketing? What do you need?
Let’s find out.
How to conduct e-commerce omnichannel marketing?
Omnichannel marketing analytics unlocks clarity at scale across fragmented campaigns, disconnected data, and fast-moving consumer behavior.
Below are five different ways to undertake tasks for omnichannel eCommerce marketing.
1. Enable self-service marketing dashboards for the whole team
Self-service marketing dashboards enable teams to view real-time performance across all channels. Metrics such as ROAS, LTV, and retention trends are easy to track because the data is pulled from a single, unified system. This makes it easy for performance, content, and growth teams to make faster decisions.
Challenge
Marketing teams in startups often need answers fast, but they’re held back by slow data access or manual spreadsheets. This delay makes it harder to act quickly and impacts overall performance.
Solution
Self-service dashboards let every team, from paid media to lifecycle marketing, track what they need, when they need it. The dashboards are fueled by powerful data models and backed by ETL/ELT pipelines that bring in structured, channel-specific insights.
Benefit
You get faster feedback loops for merchandising, product teams, and even employee training by highlighting what messaging and formats are resonating best.
That’s how your employee training efforts become smarter and more contextual when they’re built around customer trends, not assumptions.
Helpful tools
Tools like Looker, Power BI, Google Data Studio, etc. give teams a way to filter, compare, and act on performance data without waiting in line.
Windsor.ai can smoothly integrate data with these dashboard tools and offers pre-built templates that automatically sync data from 325+ marketing platforms. No manual exports. No SQL. Just answers, on demand.
On the creative side, platforms like Dresma ensure the visuals feeding those campaigns are consistent, on-brand, and performance-ready.
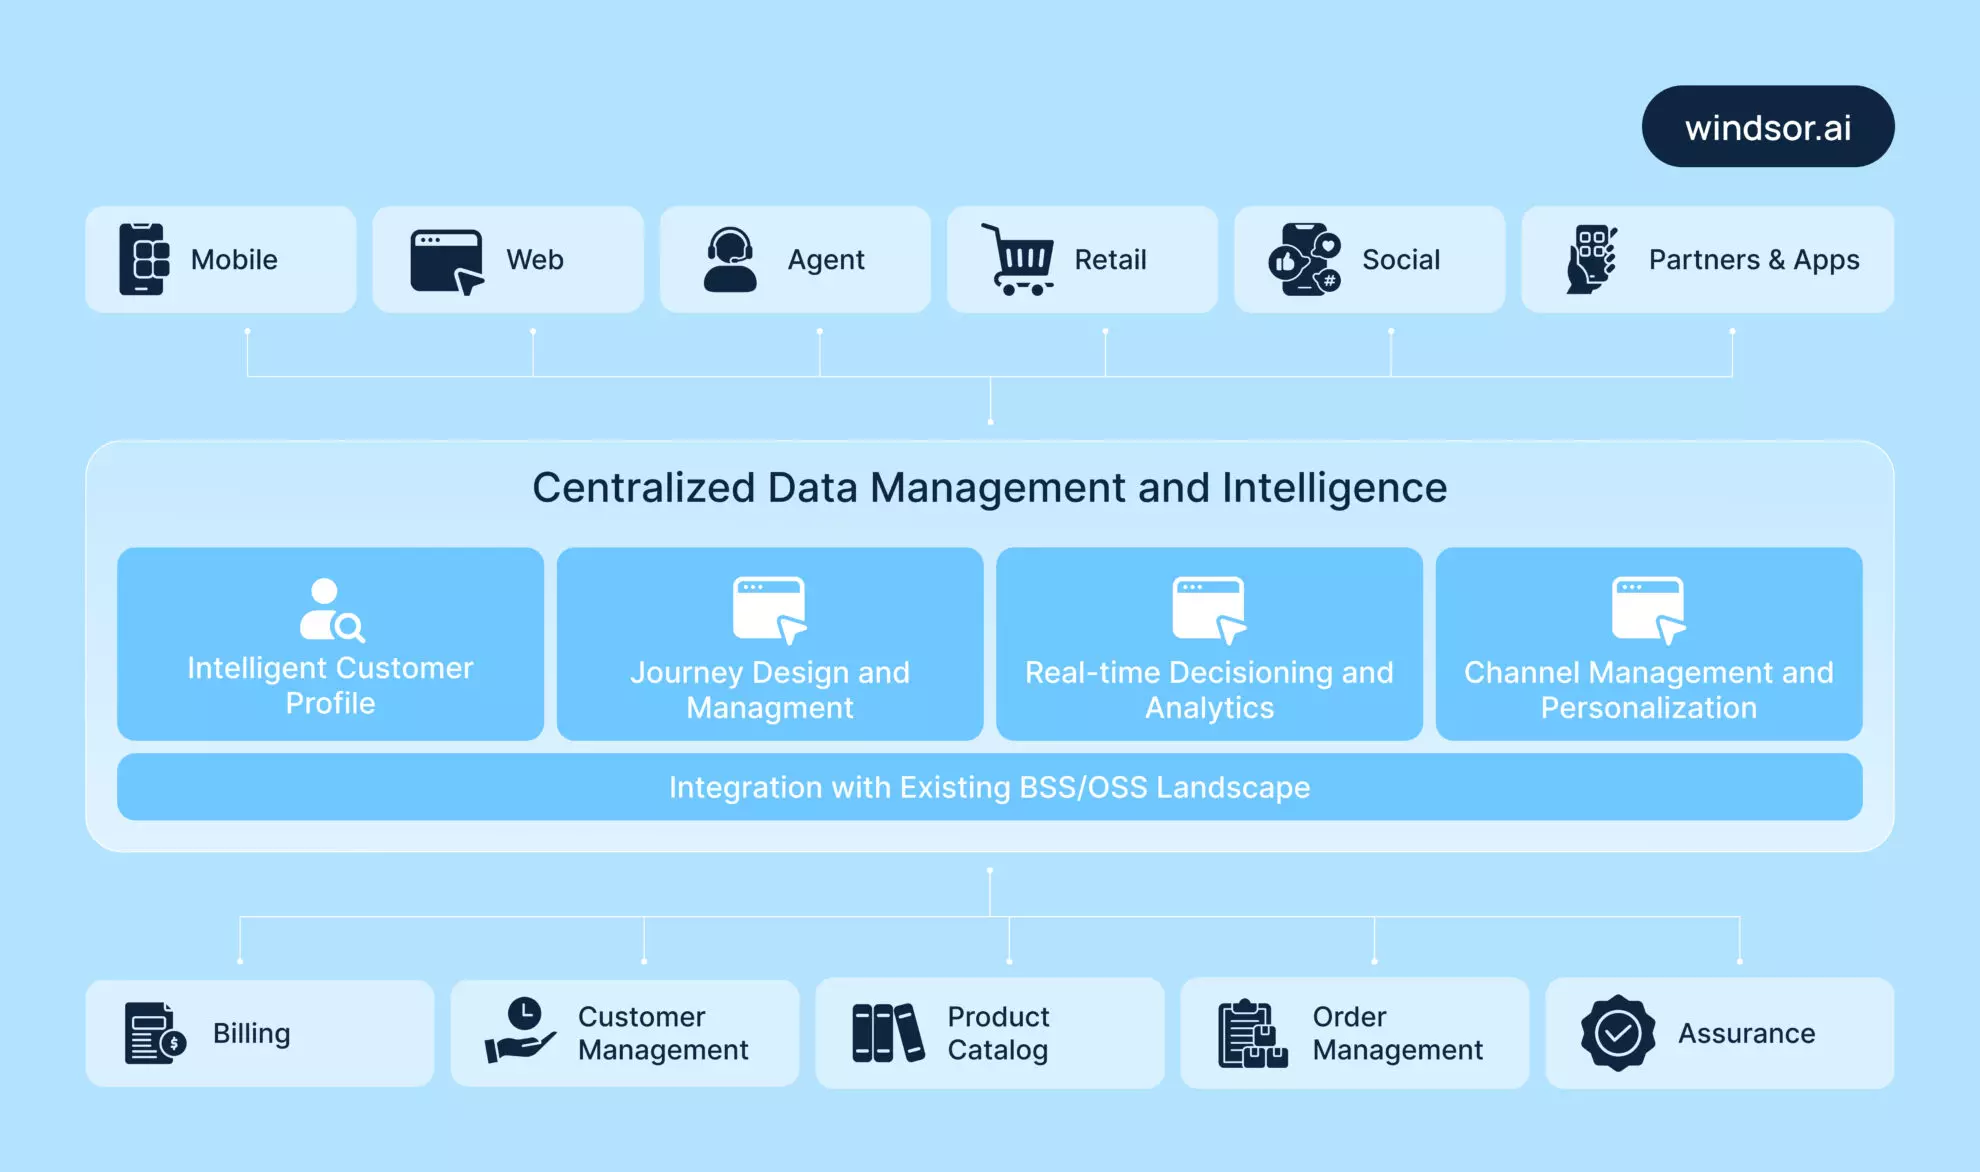
2. Start building a centralized customer data pipeline
A centralized data pipeline turns scattered, siloed data into a structured, queryable, and usable database. Without it, cross-channel insights are either delayed or entirely off.

Identifying key data sources
The first step is to map out the platforms that generate meaningful customer interactions:
- Paid ad platforms (like Meta, Google Ads) where spend meets exposure
- Website analytics (GA4, Hotjar) that have surface-level engagement and conversion flows
- CRM (HubSpot, Salesforce) for your retention, upsell, and lifetime value data
- Email platforms (Mailchimp, Mailtrap, and Klaviyo alternatives) to track open rates, CTRs, and nurture sequences
- E-commerce platforms (Amazon, Etsy, Shopify store) are essential to channel-level performance and SKU trends
- Loyalty apps to maintain post-purchase behavior, rewards data, and high-LTV insights
Use ETL/ELT pipelines to centralize raw data in your data warehouse
ETL (Extract, Transform, Load) or ELT (Extract, Load, Transform) pipelines automate how raw data from all these sources flows into a warehouse. That’s where it can be cleaned, normalized, and joined for cross-channel insights.
Helpful tools
- BigQuery: Fast, scalable, and built for real-time marketing queries.
- Snowflake: Ideal for large, concurrent data loads across teams.
- Redshift: AWS-native and cost-efficient for blended marketing use cases.
Key metrics for the pipeline
Your pipelines should track the essentials such as spend, impressions, clicks, conversions, revenue, and LTV. These are the foundation for attribution modeling, budget allocation, and retention strategies. But make sure your data sources aren’t silently compromised by checking your digital footprint to ensure everything you’re pulling in is secure and up to date.
Windsor.ai offers pre-built connectors for 325+ data sources, automating the heavy lifting of pipeline creation that spares you from manual syncs.
3. Adopt cohort analysis to track customer retention and LTV
Acquisition gets attention, but retention builds businesses. So, with cohort analysis, you can track how groups of customers behave over time, especially when segmented by acquisition source, campaign, or period. To properly measure retention impact on long-term profitability, many brands rely on SaaS financial software that connects marketing performance with cash flow forecasting and margin analysis. This is especially valuable for an e-commerce marketing agency looking to connect acquisition efforts with long-term customer value. The same applies to an ecommerce SEO agency trying to understand how organic search contributes not just to first-time visits, but to retention, assisted conversions, and long-term revenue growth.
Omnichannel marketing has multiple touchpoints, so cohorting gives you the cleanest lens to measure long-term performance. It’d be tempting to pour budget into what brings quick wins, but you need to understand which channels drive value beyond the first sale.
Omnichannel personalization becomes especially important here, as it connects customer behavior across channels to deliver more relevant, consistent experiences that improve retention and lifetime value.
Run a Cohort Analysis by Acquisition Channel
Cohort analysis groups customers based on shared characteristics—most commonly, the time and channel of acquisition.
Once grouped, track how each cohort behaves over time and see how e-commerce data analytics can increase revenue.
For this, monitor:
- Retention curves: How many customers stick around and keep buying after day 30, 60, 90.
- Repeat purchase rates: How often they come back and transact.
- LTV per channel: Which sources bring customers who generate actual revenue over time, not just surface-level clicks.
Practical example:
A DTC e-commerce brand selling custom sweatpants can run cohorts based on Meta Ads, Google Shopping, and email nurture. They can also segment customers who responded to promotional campaigns such as BOGO Shopify offers to measure how discount-driven buyers perform over time. Over 90 days, they might find that Google brings more one-time buyers, while email drives higher LTV from re-engaged users.
Here, you can use Windsor.ai to unify the data needed for cohort modeling. This way, you get to track retention and revenue across every acquisition stream automatically.
4. Monitor campaign ROI across online and offline touchpoints
Customers don’t care if your brand touchpoint is online or offline. They just expect a seamless experience. That’s why more e-commerce brands are expanding beyond the digital feed.
Whether it’s pop-up stores in high-traffic areas, community events, co-branded partnerships, or influencer PR drops. These are conversion levers, but only if you can effectively track their performance. The same applies when selling digital products; without shipment or in-store interactions to analyze, teams need clean attribution data to understand which ads, emails, reviews, or partner mentions actually influenced the purchase.
Example:
For tactile products like custom yoga mats, it’s important to pair digital ads with real-world touchpoints such as influencer gifting or in-person sampling. This is necessary to drive purchase intent.
But unless you’re connecting the dots between those offline efforts and your online sales data, you’ll remain unsure of what’s converting. This is where Marketing Mix Modeling can offer additional insights by quantifying the effectiveness of both online and offline channels in driving sales.
The question is: what’s moving the needle?
For this, analyze the ROI of the ad campaign.
How to analyze campaign ROI
To measure cross-channel ROI campaign analysis, go beyond clicks and last-touch conversions.
Here’s how to do it right:
- Bring online and offline data together: Sync ad spend, website engagement, and transaction data with CRM inputs from events, POS systems, and outreach campaigns.
- Track incremental lift: Measure how offline activities (like events or influencer seeding) increase online conversions, not just in isolation but in combined performance.
- Use Windsor.ai: Windsor.ai lets you blend CRM and offline campaign signals with digital marketing data. It gives you a complete picture of ROI across touchpoints that’s automated and attribution-ready.
5. Implement cross-channel attribution models
You can’t give credit to each marketing channel that contributed when choosing the last-click attribution. Because a typical customer journey would have them getting introduced to the product over social ads, then Google builds trust, and finally, an email closes the loop.
And so, relying solely on last-click attribution can oversimplify complex paths and misguide your budget allocation. It can push spending toward what looks like it works, not what does. But, most omnichannel customer engagement platforms come with built-in features that automatically implement cross-channel attribution.
Types of models to implement
Smarter attribution models help see the full picture as you choose to implement a model from the following:
- Time-decay attribution
It weighs touchpoints based on how close they are to the conversion, ideal for longer journeys where influence builds over time.
-
U-shaped attribution
This one splits most credit between the first and last touchpoints, great for funnel-based campaigns where both entry and closure matter.
-
Algorithmic/ML-based attribution
It’s a model that uses your actual data to detect patterns and assign credit dynamically—no assumptions, just performance-backed logic.
Need for multi-source joins and data transformation
To make any of this possible, you need connected data such as spend, clicks, conversions, CRM updates, and email performance, all integrated.
- Multi-source joins combine datasets across platforms.
- Data transformations clean and structure it so that attribution models don’t break.
Helpful tools
To build cross-channel attribution models that actually reflect reality, your data first needs to be stitched and shaped the right way.
You’d use tools such as:
- dbt (Data Build Tool): To transform raw data into analytics-ready models using SQL in a version-controlled, modular workflow.
- SQL: Help blend in multiple data sources, performing calculations like LTV or time-to-conversion, and applying attribution logic through CTEs (common table expressions).
- Windsor.ai: Does the heavy lifting by extracting and loading cleaned datasets across 325+ platforms.
Conclusion
Omnichannel analytics requires integrating data scattered across multiple sources. You might be running campaigns across a dozen platforms, each with its own naming rules, attribution quirks, and delayed reporting.
Use Windsor.ai, which fixes it by pulling data from hundreds of platforms, syncs it in near real-time, transforms it automatically, and pushes it wherever you need: your dashboard, your BI tool, your warehouse.
If you’re serious about scaling omnichannel marketing with confidence, not guesswork, Windsor.ai is built for you.
Start for free and check how you can connect your data to decisions that drive growth!

