 AI insights
 About us
 Careers
 Security
 Customer reviews
 Contact us
 Affiliate program
 Solution partners
 Looker Studio templates
 Tableau templates
 Facebook Ads templates
 Google Ads templates
 Data fields & Metrics
 AI prompt library & Guides
 Product documentation
 API documentation
 Case studies
 Blog
Blog Data models
 Windsor vs Supermetrics
 Windsor vs Fivetran
 Windsor vs Portermetrics
 Last updated: 7 November 2025

Facebook Ads produce enormous amounts of data across campaigns, ad sets, and creatives. Extracting insights from this complex data can quickly become overwhelming.
As your business scales, your reporting and analytics needs might outgrow the limited Meta Ads interface. By organizing your Facebook Ads insights in BigQuery, you can enable more comprehensive reports and easily connect this data to BI tools like Looker Studio, Tableau, or Power BI for downstream analytics.
This tutorial will guide you through building a scalable Facebook Ads data model in BigQuery designed for performance and long-term growth.
We’ll explore each step of the setup:
- Setting up your BigQuery environment
- Designing the data model
- Configuring daily exports
- Querying the data
But before we dive deep into the tech details, let’s answer one question…
Why does structuring data matter?
Most analytics teams pursue the same goal: to make sense of their data. For this, some use BigQuery, others rely on spreadsheets, but eventually, they all hit the same wall. Every new campaign spawns another table, another sheet, another “version of the truth.”
Soon, insights drown in noise, and even the most powerful tools like Looker Studio or BigQuery feel like part of the problem.
But the issue isn’t the tools. It’s the poorly designed data architecture. One-off tables and ad-hoc pipelines make scaling hard and costs unpredictable.
The answer to this problem is simple: treat data like a product. Model it to answer specific questions, not just to build reports. With clear intent, reusable schemas, and a governed semantic layer, analytics becomes reliable, and your data turns from overhead into a competitive advantage.
Google BigQuery is a powerful data warehouse that can serve as a robust reporting layer in your data architecture. Let’s now consider how you can structure your Facebook Ads data warehouse in BigQuery with Windsor.ai to keep reports accurate and consistent.
How to model Facebook Ads data in BigQuery with Windsor.ai
1. Setting up the BigQuery environment
Before building a Facebook Ads data warehouse, we need to set up a clean BigQuery environment.
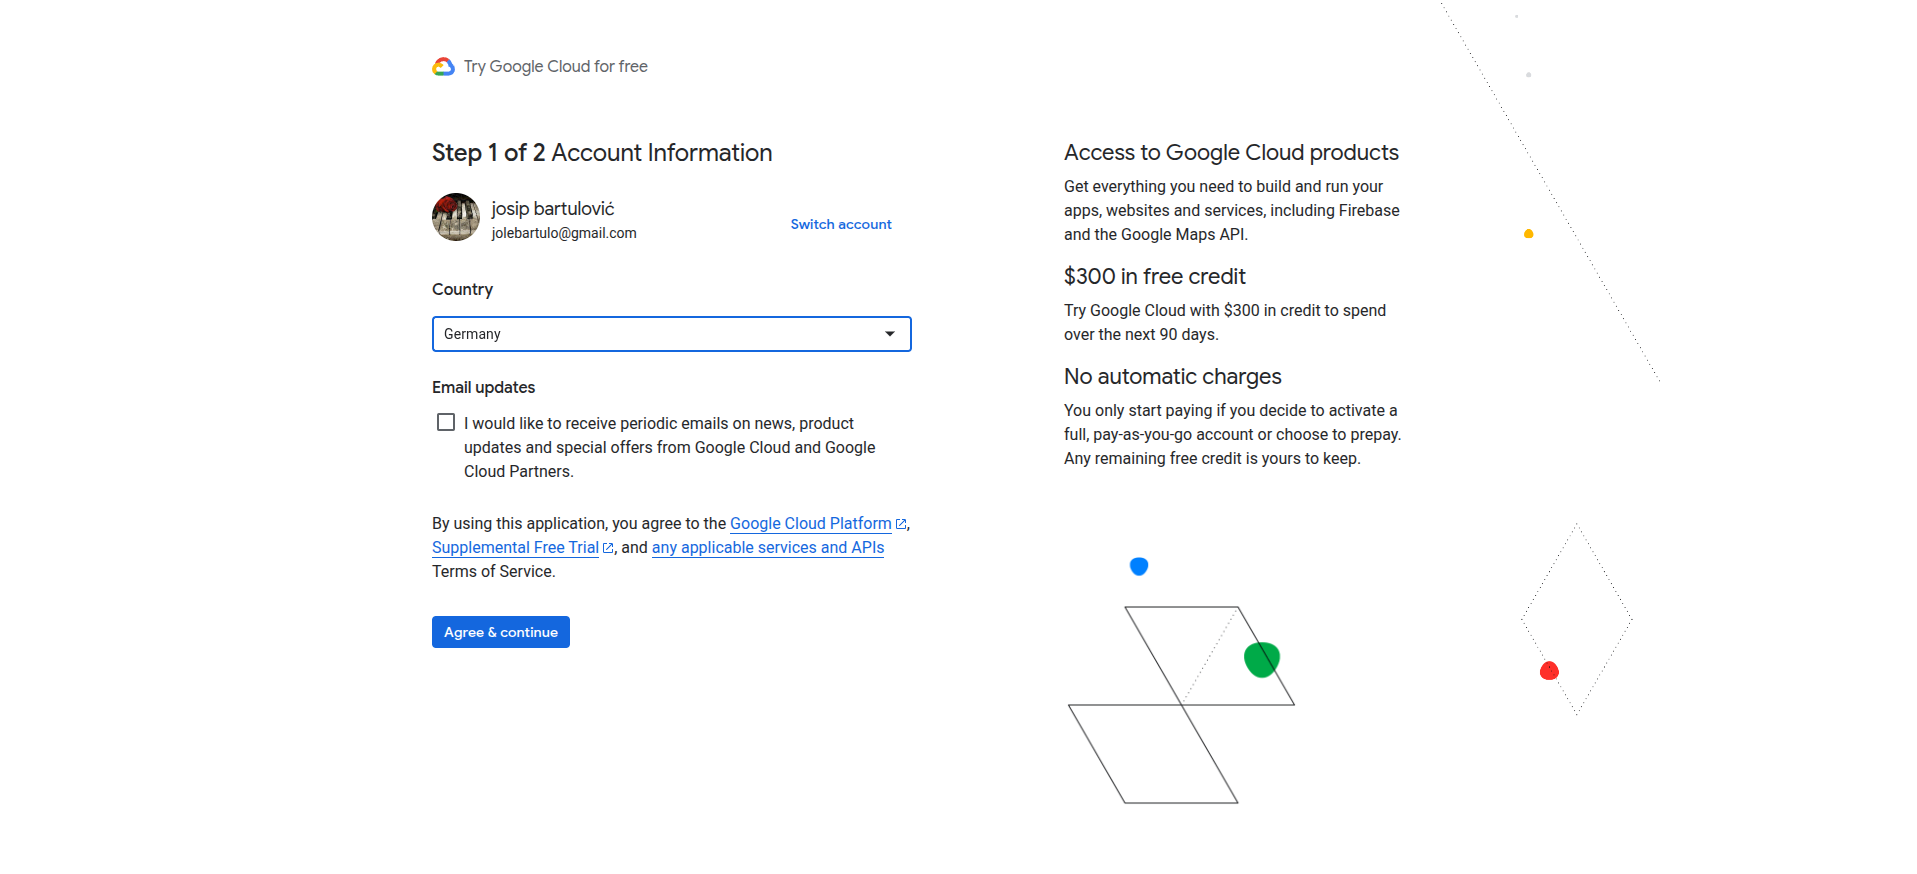
1.1. Register for Google Cloud Console
If you don’t already have an account, sign up for Google Cloud. This will give you access to BigQuery and other Google Cloud services.
1.2. Create a new project
In Google Cloud Console, create a new project. Think of a project as a container for all your datasets, tables, and resources.

Make sure to give your project a meaningful name that reflects its purpose, for example, windsorai_marketing_dw. Consistent naming helps keep your BigQuery environment organized and makes it easier to manage multiple datasets over time.
☝️ Pro tip: Use one project per domain.
The simplest way to organize your data into projects is by following the one project per domain principle.
Create a dedicated BigQuery project for each business domain, such as Marketing, Product, or Sales. This keeps data, access controls, and billing separated while maintaining a clean and scalable structure.
1.3. Create your first dataset in BigQuery
Inside your project, navigate to BigQuery and create a dataset. A dataset is a grouping of tables that share similar characteristics. This will be the foundation for storing your Facebook Ads data.
Again, make sure you’re giving it a descriptive name, for example, facebook_ads_performance.

Once this is done, you’ll have a clean environment ready to start building your Facebook Ads data model.
🚨 Watch out: Choosing the correct region for your dataset is crucial.
Google provides very little guidance on how to choose the appropriate region for your BQ datasets, but there is one thing to keep in mind. BigQuery does not allow joining tables across different regions. Once you choose a region, stick to it for all related datasets. Pricing varies by region as well, so check the BigQuery pricing documentation before deciding.
2. Designing the data model: structuring your Facebook Ads data
Give a person a spreadsheet, and they’ll know something for a day; teach them to build a data warehouse, and they’ll have insights for a lifetime.
The truth is, there are countless ways you can use your Facebook Ads data. From descriptive analytics to machine learning.
Instead of giving you a static schema that only half fits your goals, I’ll show you how to design a flexible, scalable model that adapts to your business needs.
In this section, we’ll cover two essential concepts that form the foundation of any analytics-ready data model:
1) Dimensional modeling
2) Star schema design
2.1. Dimensional modeling
Dimensional modeling is a technique for organizing data so that it’s intuitive and efficient to analyze.
It’s built around two key building blocks: facts (metrics) and dimensions.
| Component | Definition | Example (Facebook Ads) |
| Facts | Quantitative metrics that measure performance | Spend, clicks, impressions, conversions |
| Dimensions | Descriptive attributes that give context to those metrics | Campaign name, ad set, country, date |
This approach is designed for speed and simplicity. It makes it easy to run SELECT queries and power dashboards without writing complex logic.
The dimensional modeling technique typically involves four key steps:
1) Defining the business objective
2) Defining the granularity
3) Identifying facts
4) Identifying dimensions

2.1.1. Define the business objective
The answer to the ultimate question from the movie “The Hitchhiker’s Guide to the Galaxy”

I always like to pull out this bit of pop culture when discussing data warehouses. It just clicks so well. Because… without a clear question in mind, the final output, whether a dashboard or a single chart, is almost meaningless.
So start with the why. What question should my data answer?
For example:
Which Facebook Ads are spending the most but underperforming in conversions or engagement?
Why it matters:
- Keeps your model aligned with business goals
- Helps avoid collecting (and paying for) unnecessary data
2.1.2. Defining the granularity
Granularity defines the level of detail in your table and what each row represents.
For our example, the ad-level by day granularity (high) means each row in the table represents the performance of a single ad on a specific date.
Low granularity is your best friend for spotting long-term trends, while high granularity is perfect for in-depth analysis and troubleshooting.
2.1.3. Identify the metrics
Metrics are your measurable outcomes, the numbers you’ll analyze. For Facebook Ads, you might include:
| Metric | Description |
| spend | The total cost to run the ad |
| impressions | How often the ad was shown |
| clicks | How often users interacted with the ad |
| conversions | The number of desired actions (e.g., purchases or signups) |
From these, you can calculate key performance metrics:
- CTR (Click-Through Rate) = clicks ÷ impressions
- CPA (Cost per Acquisition) = spend ÷ conversions
- ROAS (Return on Ad Spend) = revenue ÷ spend
These measures reveal which ads are efficient and which are burning budget without results.
Windsor.ai allows you to report on 500+ Facebook Ads metrics, making reporting and analytics complete and flexible.
2.1.4. Identify the dimensions
Dimensions add the context: the who, what, when, and where behind your facts, and make your data readable.
Since we’re working at ad-level granularity, your model should include data about the following entities:
| Dimension | Description |
| Ad account | The business account running the ads |
| Campaign | The marketing initiative |
| Ad set | Targeting and budget group |
| Ad | The ad itself |
| Date | Enables trend and seasonality analysis |
Windsor supports 146+ Facebook Ads dimensions, helping you turn abstract metrics into meaningful stories.
2.2. Star schema design
Now it’s time to translate your data model into actual table structures. To do this, we follow the star schema principle.
In a star schema, a central fact table (containing measurable events or metrics) is surrounded by dimension tables (providing context).

The star schema offers several key benefits:
- Reusability of dimension tables – the same dimensions can support multiple fact tables.
- Scalability of fact tables – it’s easy to add new metrics or measures as your data grows.
- Query simplicity – analysts can write intuitive queries without complicated joins.
In the following sections, we’ll guide you step by step on how to build your star schema in BigQuery, from defining facts and dimensions to creating your first query-ready tables.
🤓 Learn more: The Star schema and “DRY” thinking.
The star schema encourages a more “DRY” approach to data modeling.
DRY, short for “Don’t Repeat Yourself”, is a principle widely used in software design to reduce duplication and make systems more maintainable. The same idea applies perfectly to data modeling.
By adopting DRY in your warehouse:
– You minimize duplicated information by storing each piece of data in one place.
– You create modular, reusable dimension tables that can support multiple fact tables.
– You build a system that’s flexible and scalable, able to adapt to new analyses or business questions without restructuring everything.In other words, instead of designing your schema for a single niche report, you design it to serve multiple scenarios efficiently.
2.2.1. Start with the dimensions tables
Dimension tables provide context to your reporting, so pay attention to these quick tasks:
1. Define the primary key:
The primary key should be a unique identifier of the entity represented by that dimension. It will also be used to link to the fact table. Facebook Ads already provides you with a unique identifier for entities like campaigns and ads.
2. Include descriptive attributes:
Include more attributes than you immediately need. Even with hundreds or a thousand campaigns, dimension tables are usually tiny (often under 1 MB) and cheap to store, making them easy to reuse across analyses.
Here is an example of the dim_campaign table:
| Column | Type | Description |
| campaign_id | STRING | The primary key |
| campaign | STRING | The campaign name |
| campaign_bid_strategy | STRING | / |
| campaign_configured_status | STRING | / |
| campaign_effective_status | STRING | / |
| campaign_daily_budget | INTEGER | / |
| campaign_start_time | TIMESTAMP | / |
| campaign_end_time | TIMESTAMP | / |
Now do the same for dim_account, dim_adset, and dim_ad.
2.2.2. Design the facts table
The fact table is the center of the star schema; it stores all the measurable events.
1. Select the metrics identified during dimensional modeling.
2. Include foreign keys to the dimensions:
These values will help you JOIN the fact table with the dimension tables.
3. Decide on table partitioning:
The partitioning column should be the one we’ll most commonly filter by. It breaks down the stored data into separate chunks, improving query cost and performance.
In most cases, using the date column (or a similar one) is the best.
☝️ Pro tip: Partitioning can significantly reduce your BigQuery costs.
When you query the last 7 days of data from a facts table, if there is no partitioning applied, BigQuery will charge you for processing the whole table, as BigQuery needs to scan through every row and check the value of the date column.
If you’ve applied partitioning to your table, then you’ll be charged for only the past 7 days of data. For tables containing several years’ worth of data, this can mean churning through 1 TB vs 10 MB of data.
Example table schema (fact_ads_performance):
| Column | Type | Description |
| date | DATE | Data date, the partitioning column |
| account_id | STRING | Foreign key to dim_account |
| campaign_id | STRING | Foreign key to dim_campaign |
| adset_id | STRING | Foreign key to dim_ad_set |
| ad_id | STRING | Foreign key to dim_ad |
| spend | FLOAT | Amount spent |
| impressions | INTEGER | Number of impressions |
| clicks | INTEGER | Number of clicks |
| conversions | INTEGER | Number of conversions |
2.2.3 The finalized schema
Here’s what the complete schema we’ve built looks like. It combines a central fact table with all relevant dimension tables, ready for analysis and reporting.

🤓 Learn more: The date dimension is what we call a degenerate dimension.
A degenerate dimension doesn’t have its own table. It’s used purely for filtering.
3. Configuring exports in Windsor.ai
Now that we’ve designed and structured our data model, it’s time to turn it into actual tables in BigQuery. For this, we’ll use Windsor.ai, a powerful data integration platform that simplifies marketing data workflows.
Windsor.ai allows you to automatically bring together data from multiple ad platforms into your BigQuery project. This includes Facebook Ads, Google Ads, LinkedIn, and more.
The best thing about Windsor.ai is that anyone can use it. It requires no coding, and even complex cross-channel integrations into BigQuery can be set up in just a few clicks.
This makes it an ideal BigQuery ELT tool for marketers and analysts who want to focus on insights rather than data plumbing.
With Windsor.ai, you can:
- Extract data from Facebook Ads and other ad networks
- Normalize and clean the data automatically
- Load it into your BigQuery warehouse on a scheduled, recurring basis
- Keep your tables up-to-date without manual intervention
3.1. Steps to send Facebook Ads data to BigQuery via Windsor.ai
For a full, step-by-step guide on connecting Facebook Ads data to BigQuery using Windsor.ai, check out our documentation and video tutorial.
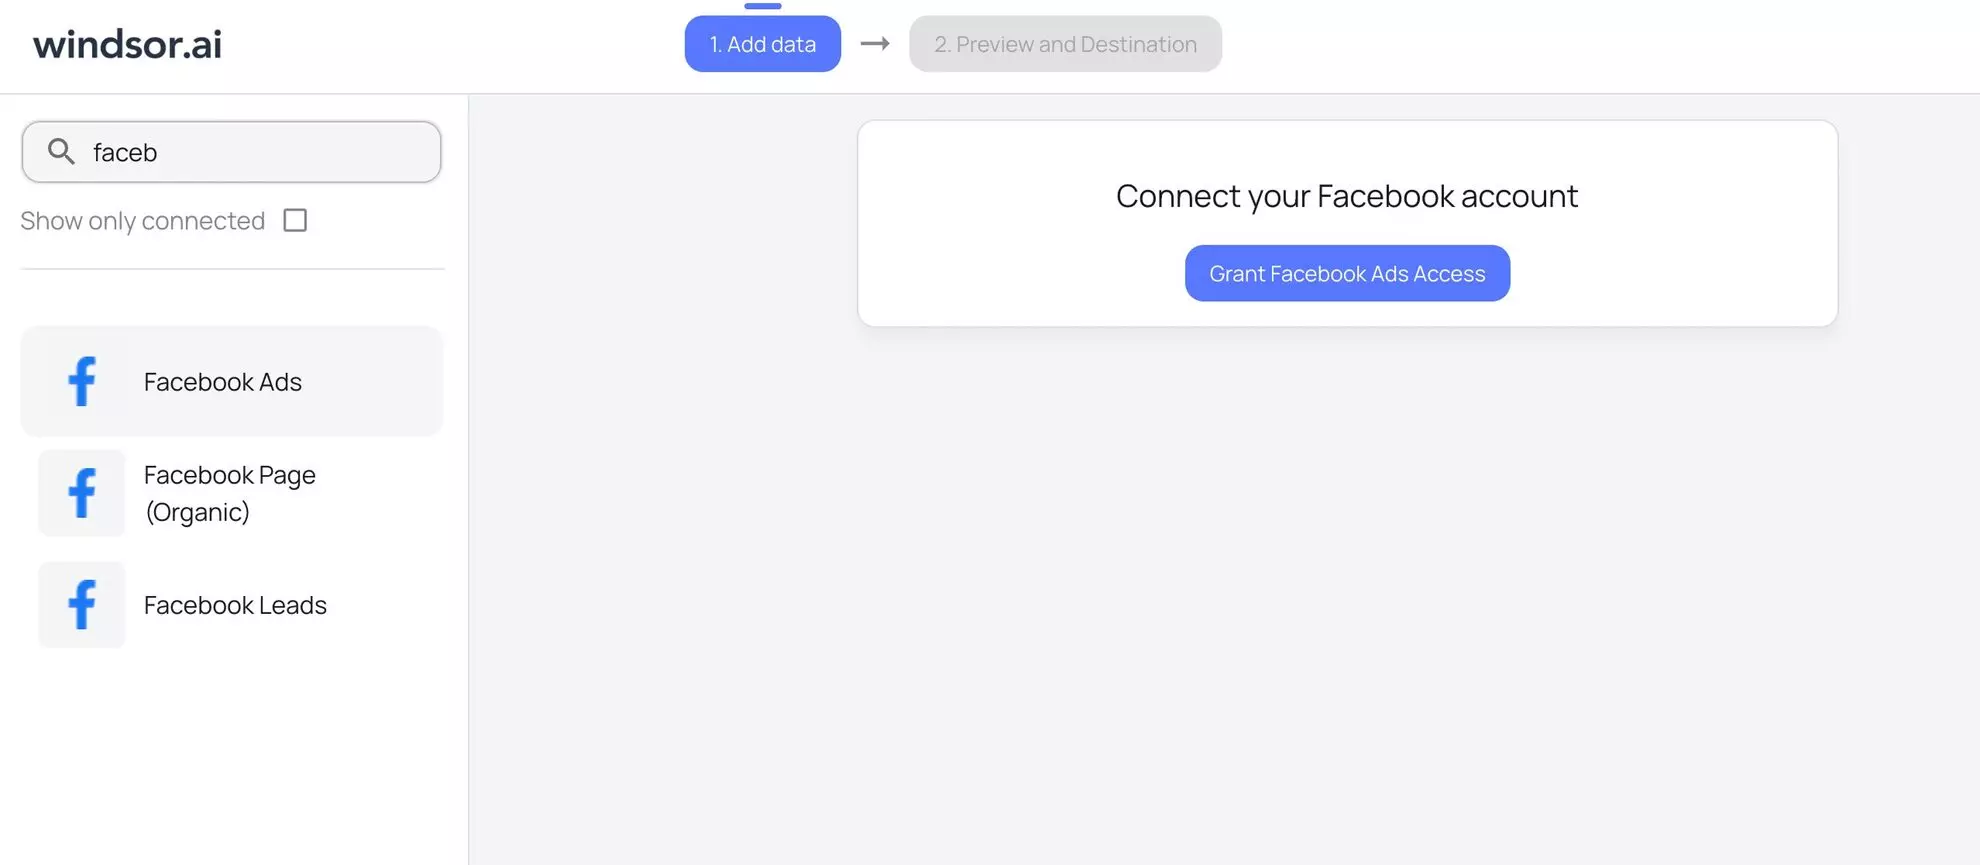
1. Sign up for Windsor.ai and start your 30-day free trial.
2. In the data sources list, select Facebook Ads and grant access to your account(s):
3. View the list of your available Facebook Ads account(s) and select the necessary one(s) from which you want to pull data:
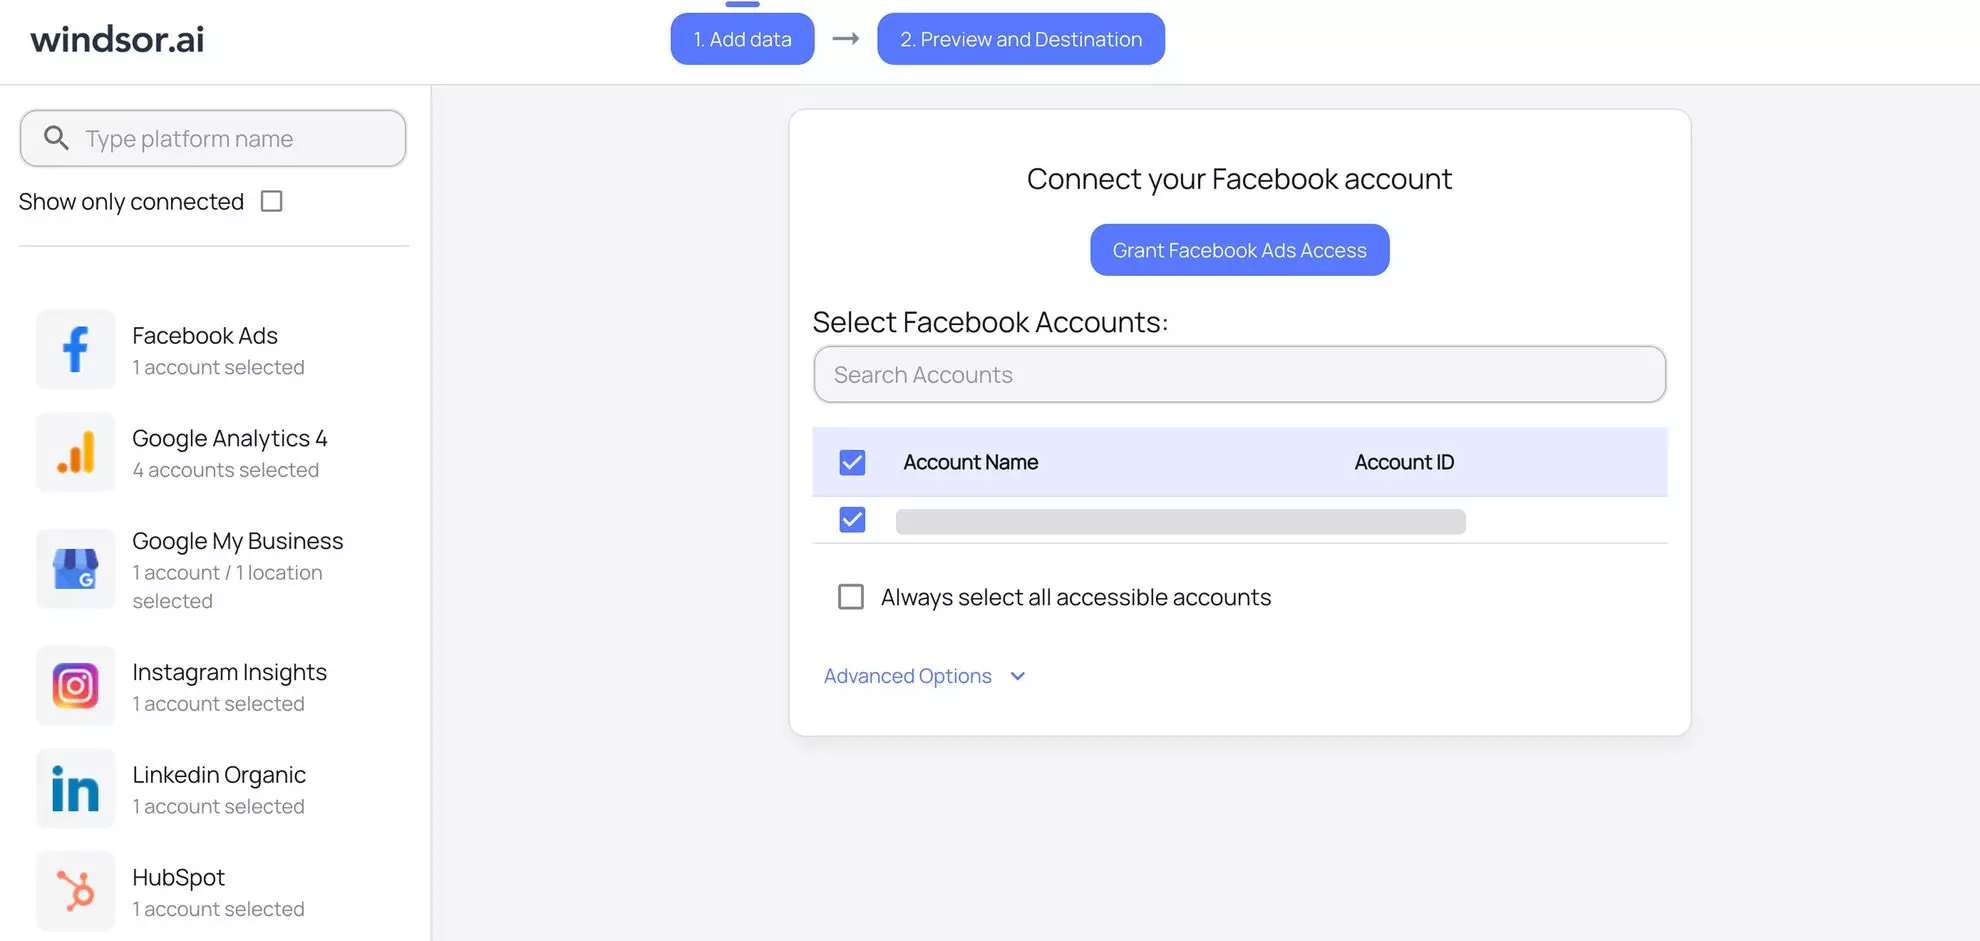
4. Click on the “Next” button to proceed with moving Facebook Ads data to BigQuery.
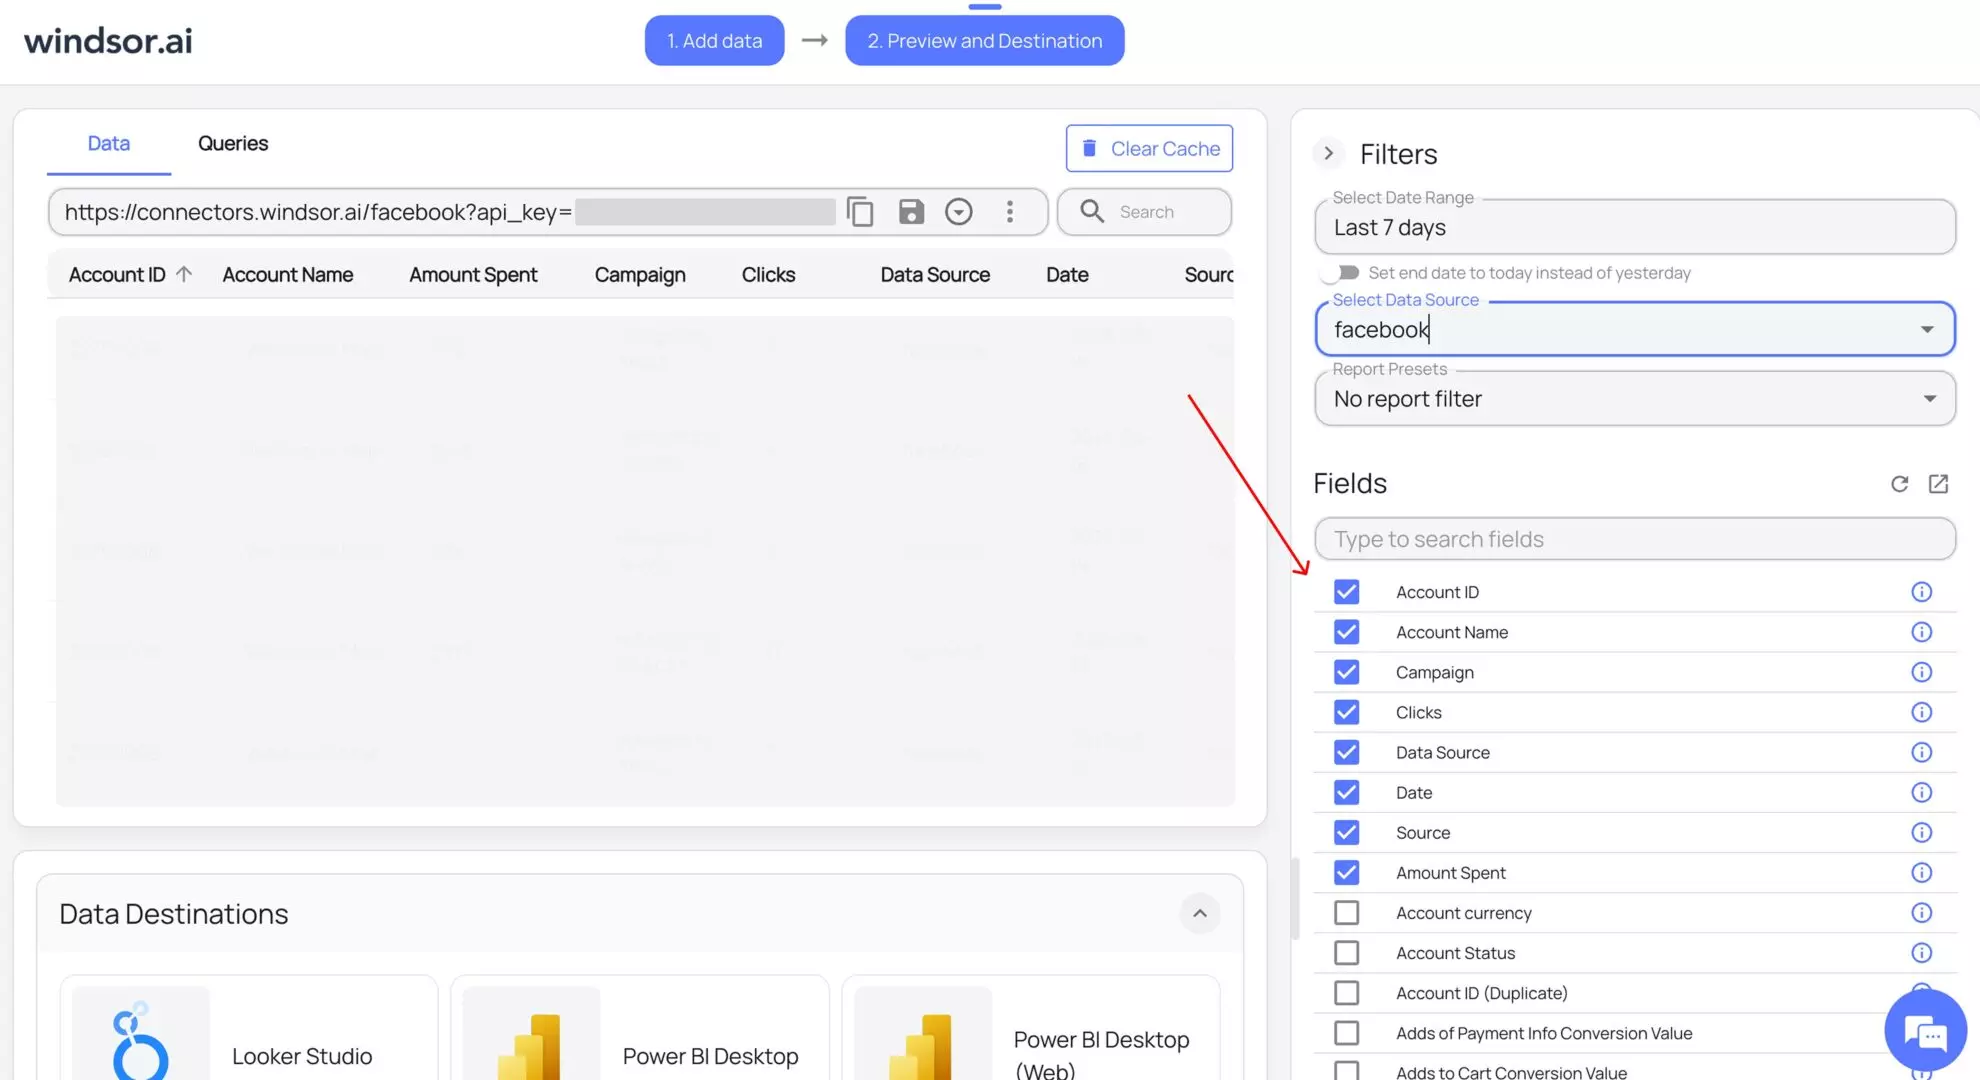
5. Configure your dataset by selecting the desired date range and specific fields you want to stream into BigQuery. Preview your extracted data in Windsor.
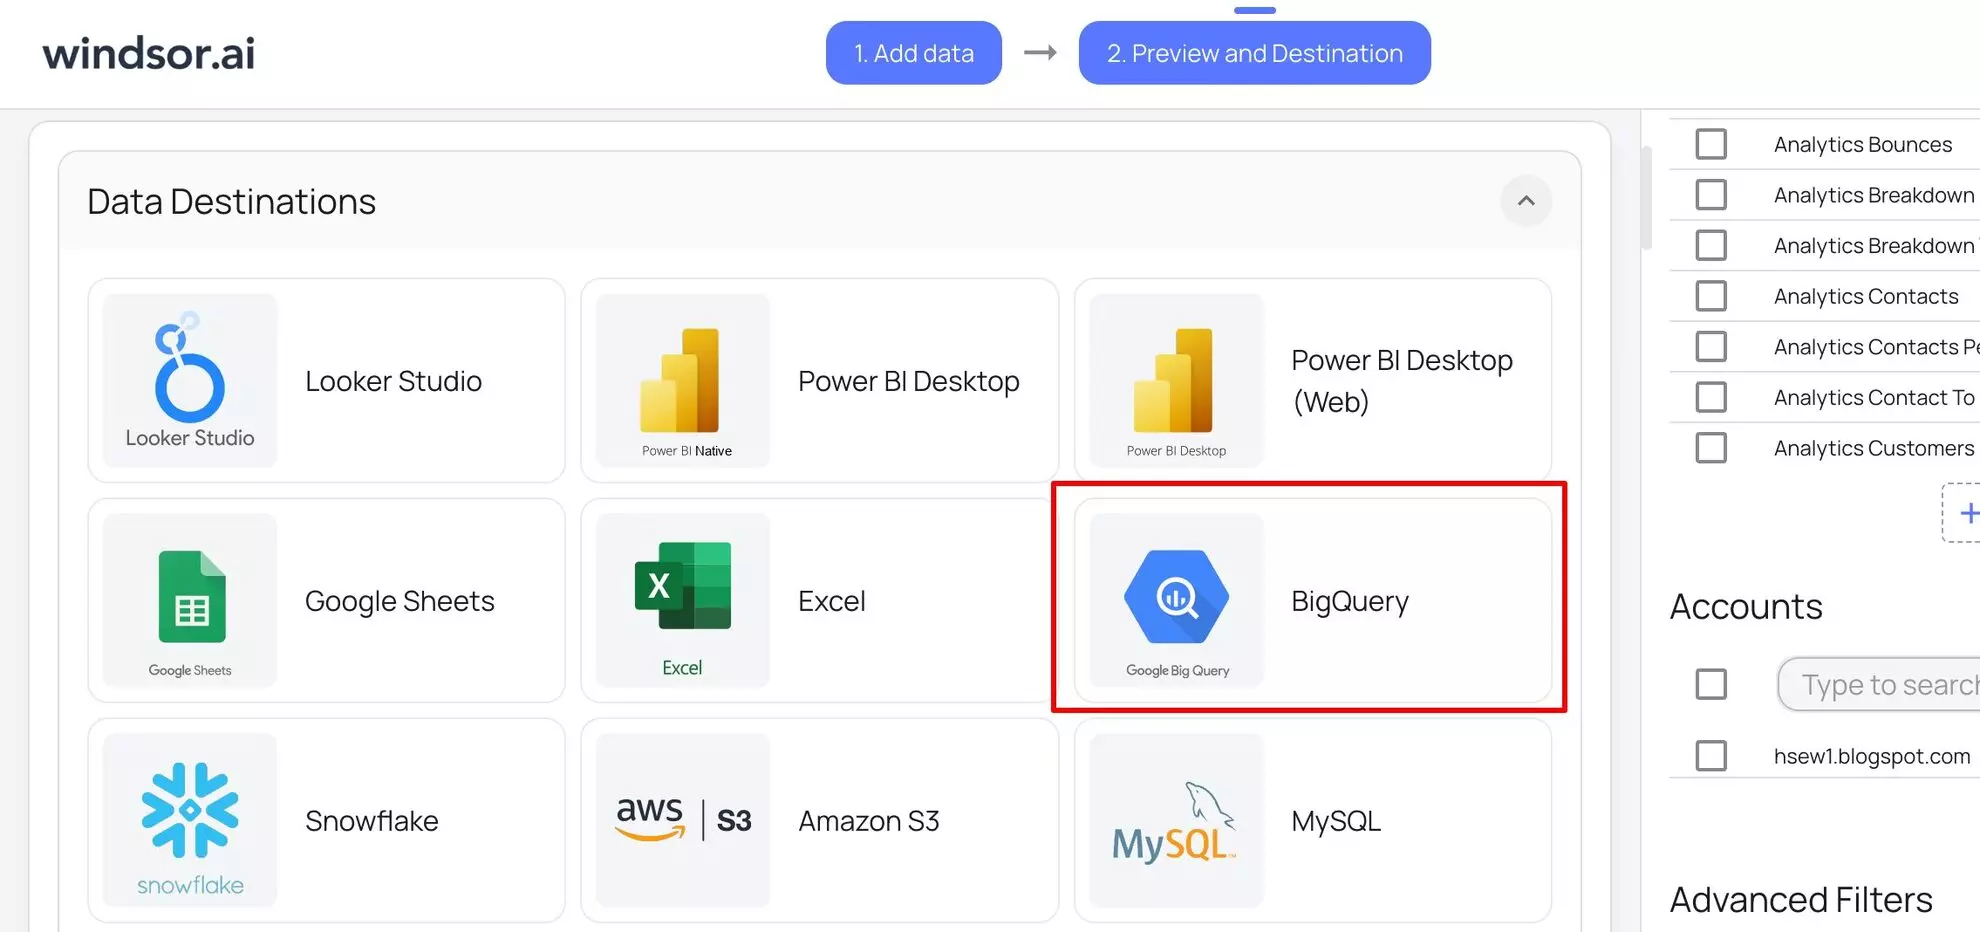
6. Scroll down to the Data Destinations section and choose BigQuery from these options:
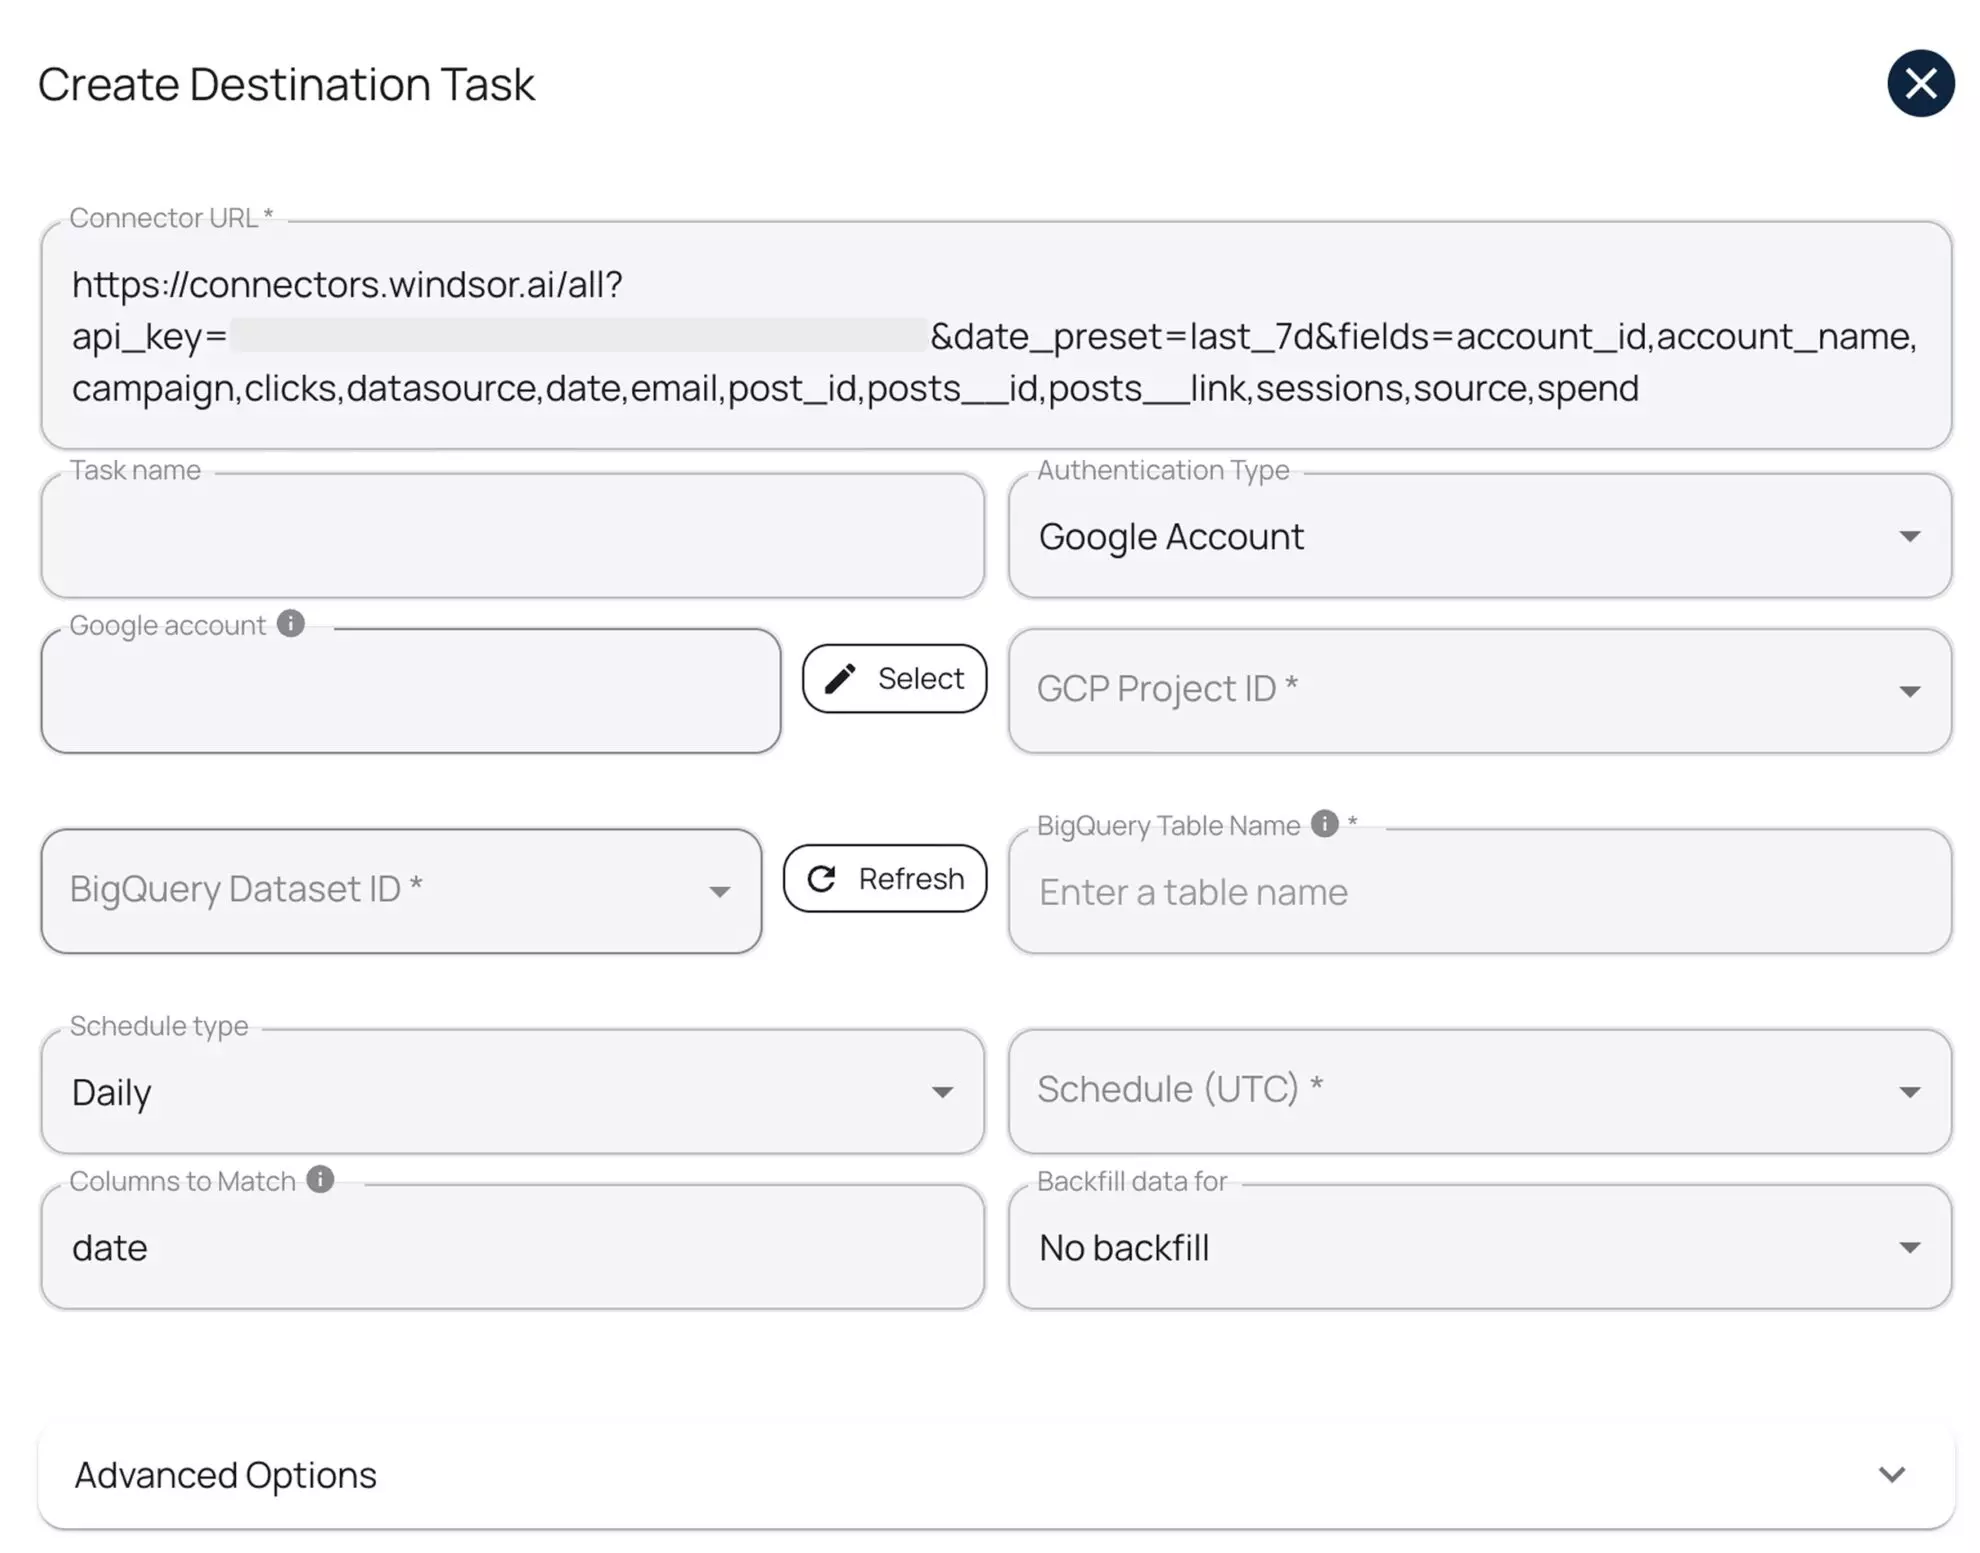
7. Click “Add Destination Task” and enter the following details:
- Task name: Enter any name you wish.
- Authentication type: You can authorize via a Google Account (OAuth 2.0) or a Service Account file.
- Project ID: This can be found in your Google Cloud Console.
- Dataset ID: This can be found in your BigQuery project.
- Table name: Windsor.ai will create this table for you if it doesn’t exist.
- Backfill: You can backfill historical data when setting up the task (available only on the paid plans).
- Schedule: Define how often data should be updated in BigQuery (e.g., hourly, daily; available on Standard plans and above).
Keep in mind that while Windsor.ai auto-creates the table schema on first setup, it does not automatically update the schema when new fields are added or edited later.
8. Select advanced options (optional).
Windsor.ai supports clustering and partitioning for BigQuery tables to help you improve query performance and reduce costs by optimizing how data is stored and retrieved.
- Partitioning: Segments data only by date ranges (either by date column or by ingestion time, e.g., a separate partition for each month of data). Learn more about partitioned tables.
- Clustering: Segments data by column values (e.g., by source, account, campaign). Learn more about clustered tables.
You can combine table clustering with table partitioning to achieve finely-grained sorting for further query optimization.
9. When completed, click “Test connection.” If the connection is set properly, you’ll see a success message at the bottom; otherwise, an error message will appear.
When successful, click “Save” to run the added destination task to BigQuery.
- See the task running in the selected data destination section. The green ‘upload‘ button with the status ‘ok‘ indicates that the task is active and running successfully.
10. Now, when you open your specified BigQuery project, you should see your Meta Ads data uploaded there.

☝️ Pro tip: Use the Columns to Match property to reduce the size of your table.
By default, Windsor.ai appends new data rows every time it syncs, even when the same records haven’t changed. This can quickly bloat your tables with duplicate entries, especially for dimension tables like accounts, campaigns, or ads, which don’t change often.
To prevent this, use the Columns to Match setting. It tells Windsor.ai which column (or combination of columns) uniquely identifies each record, essentially acting as a primary key. Windsor.ai will use it to update existing records instead of creating duplicates.
For example, for your Ad Account dimension, set account_id as the matching column.
This ensures that Windsor.ai overwrites existing records when the ID already exists, keeping only the most recent version, and dramatically reducing the size of your tables.
3.2. Copy-paste ready configurations
To make your setup even easier, we’ve prepared ready-to-use configurations for the tables defined in our schema. These configurations can be copied directly into Windsor.ai to create scheduled export tasks for your fact and dimension tables.
Using these pre-defined settings ensures that your tables follow the dimensional model we designed earlier.
Once configured, Windsor.ai will automatically populate your tables with data from Facebook Ads, allowing you to move straight into analysis and reporting.
Create BigQuery destination tasks in Windsor.ai with the following configurations:
1) Destination task: fact_ads_performance
Connector URL (copy-paste and insert your Windsor’s API key):
https://connectors.windsor.ai/facebook?api_key=***&date_preset=last_7d&fields=account_id,ad_id,adset_id,campaign_id,clicks,date,impressions

| fact_ads_performance task settings | |
| Option | Value |
| Schedule type | Daily |
| Columns to Match | date, account_id, campaign_id, adset_id, ad_id |
| Partitioning granularity | Daily (default) |
| Partition table by | Date |
2) Destination task: dim_account
Connector URL (copy-paste and insert your Windsor’s API key):
https://connectors.windsor.ai/facebook?api_key=***&date_ preset=last_7d&fields=account_ id,account_name,account_ currency,account_status,amount_spent, spend_cap
| dim_account task settings | |
| Option | Value |
| Schedule type | Daily |
| Columns to Match | account_id |
3) Destination task: dim_campaign
Connector URL (copy-paste and insert your Windsor’s API key):
https://connectors.windsor.ai/facebook?api_key=***&date_preset=last_7d&fields=campaign_id,campaign,campaign_bid_strategy,campaign_configured_status,campaign_daily_budget,campaign_start_time
| dim_campaign task settings | |
| Option | Value |
| Schedule type | Daily |
| Columns to Match | campaign_id |
4) Destination task: dim_adset
Connector URL (copy-paste and insert your Windsor’s API key):
https://connectors.windsor.ai/facebook?api_key=***&date_preset=last_7d&fields=adset_id,adset_name,adset_status,adset_daily_budget,adset_budget_remaining,adset_bid_strategy
| dim_adset task settings | |
| Option | Value |
| Schedule type | Daily |
| Columns to Match | adset_id |
5) Destination task: dim_ad
Connector URL (copy-paste and insert your Windsor’s API key):
https://connectors.windsor.ai/facebook?api_key=***&date_preset=last_7d&fields=ad_id,ad_name,ad_created_time,ad_object_type,effective_status,link_url,website_destination_url
| dim_ad task settings | |
| Option | Value |
| Schedule type | Daily |
| Columns to Match | ad_id |
4. Querying the data
If your data connectors are set up correctly, Windsor.ai will automatically create and populate your tables in BigQuery.
You can confirm this in the BigQuery Console; you should see tables fact_ads_performance, dim_campaign, dim_adset, dim_ad, and dim_account under your project.

Now that your tables are ready, let’s run a simple query to explore your Facebook Ads performance data.
SELECT
 date,
 effective_status,
 account_name,
 campaign AS campaign_name,
 adset_name,
 ad_name,
 spend,
 impressions,
 clicks,
 conversions
FROM `facebook_ads_performance.fact_ads_performance`
LEFT JOIN `facebook_ads_performance.dim_account` USING (account_id)
LEFT JOIN `facebook_ads_performance.dim_campaign` USING (campaign_id)
LEFT JOIN `facebook_ads_performance.dim_adset` USING (adset_id)
LEFT JOIN `facebook_ads_performance.dim_ad` USING (ad_id)
ORDER BY spend
This query combines your fact table with all relevant dimension tables. It retrieves both performance metrics and contextual attributes, like campaign names and ad details, so you can see what each ad spent, how it performed, and under which campaign it ran.
In short, it turns your raw warehouse tables into a readable, analysis-ready dataset.
Conclusion
Building a marketing data warehouse might seem daunting at first, but with a clear structure and the right tools, it becomes a powerful asset for your business.
In this guide, we covered:
- Dimensional modeling – organizing your data into facts and dimensions for efficient analysis
- Star schema design – creating scalable, reusable tables that make querying simple
- Windsor.ai integration – automating data ingestion from Facebook Ads into BigQuery
- Best practices – using DRY principles, planning for reusable dimensions, and keeping your tables clean and efficient
By following these steps, you’ll have a scalable data warehouse that grows with your marketing strategy and allows you to focus on insights instead of data wrangling.
🚀 Ready to take your Facebook Ads data analytics to the next level? Start your Windsor.ai free trial and pipe your advertising data into BigQuery in minutes, no code required.
Read more
Learn more about using the Windsor.ai platform for Facebook Ads to BigQuery integration through these helpful blogs and docs:
- Windsor.ai BigQuery Integration Documentation – A step-by-step guide with screenshots that explains how to integrate your data into BigQuery with the Windsor.ai no-code ELT connector.
- Free Facebook Ads BigQuery+dbt package – A production-ready dbt package that transforms raw Facebook Ads data integrated with Windsor.ai into clean, analytics-ready tables in BigQuery following standardized architecture patterns; you can also check the explanatory guide on how to use it.
- How to Integrate Facebook Ads into BigQuery: Top 3 Methods – A general blog describing the most common ways to integrate Facebook Ads data into BigQuery: using ETL/ELT tools like Windsor.ai, manual data export and upload, and API + custom script.
This blog covers some data modeling basics. If you want to dive deeper into the world of data modeling, I strongly recommend reading the following materials:
- Dimensional Modeling Techniques, by the Kimball Group – Dimensional modeling is a methodology introduced by Ralph Kimball. I strongly recommend going through his work for anyone looking to dive deeper into data modeling.
- Understand Star Schema and the Importance for Power BI – This blog uses great visuals to explain different scenarios you’ll encounter when doing dimensional modeling.
- Building the Data Warehouse – It’s impossible to talk about BigQuery integrations without mentioning Bill Inmon, the father of the data warehouse concept.

