 AI insights
 About us
 Careers
 Security
 Customer reviews
 Contact us
 Affiliate program
 Solution partners
 Looker Studio templates
 Tableau templates
 Facebook Ads templates
 Google Ads templates
 Data fields & Metrics
 AI prompt library & Guides
 Product documentation
 API documentation
 Case studies
 Blog
Blog Data models
 Windsor vs Supermetrics
 Windsor vs Fivetran
 Windsor vs Portermetrics
 Last updated: 21 May 2025

If you are using a Power BI connector for a dashboard, every time new data is generated, your dashboard will be updated.
In this article, we will go through three methods to append data in Power BI.
We will show you an example of how you can keep your past data into your Power BI dataset so that you can see both historical and new data in your real-time dashboard.
Method 1: Using a connector that caches Data
For this case, you can use a connector such as Windsor.ai, that caches data the first time you can connect a Data source, and then you can query all the data you need up to how much the API allows.
To do this you would just need to connect your data source, for this example will use Google Ads.
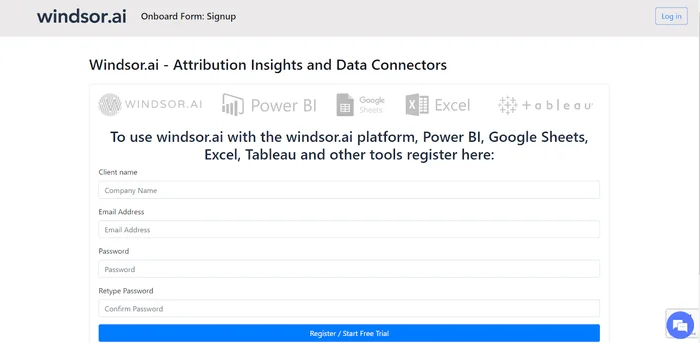
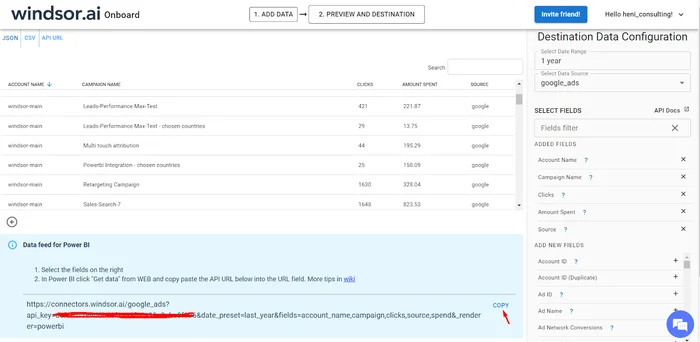
1. Go to Windsor.ai’s page and create an account
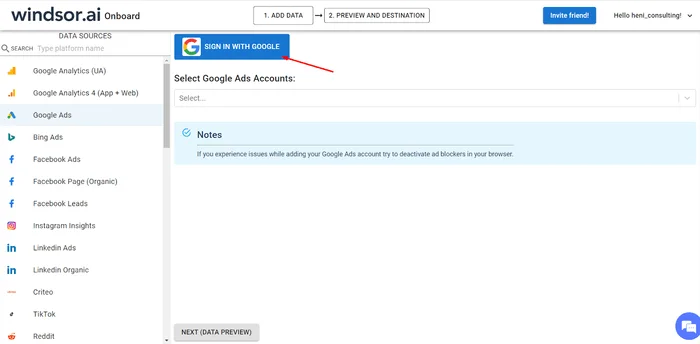
2. Select Google Ads and connect your account to Windsor.ai
3. Choose the fields, the data range you need to query and press on Power bi Desktop Logo
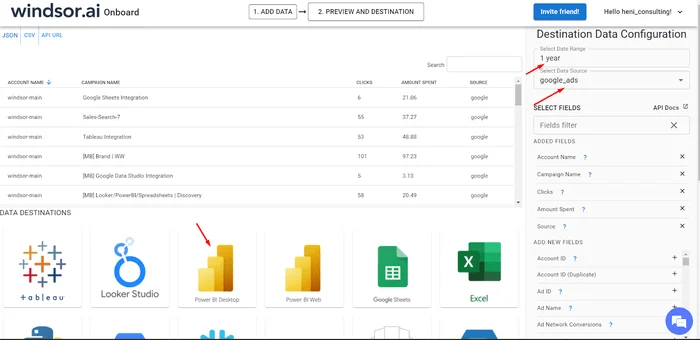
4. Copy your API Key and then in Power bi desktop, press Get data from the web and copy your API URL there
Now you can query historical in seconds.
Method 2: Appending Data using M query
For this method, you would need to have basic knowledge of M query.
1. Duplicate the table that you want to start with by right click on the main table
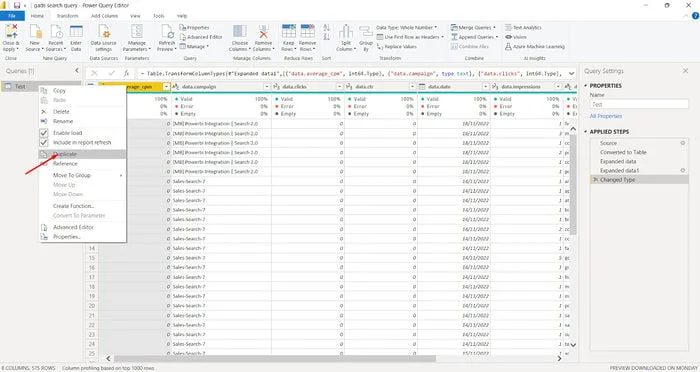
2. In the the new table go to advanced query editor and copy the query
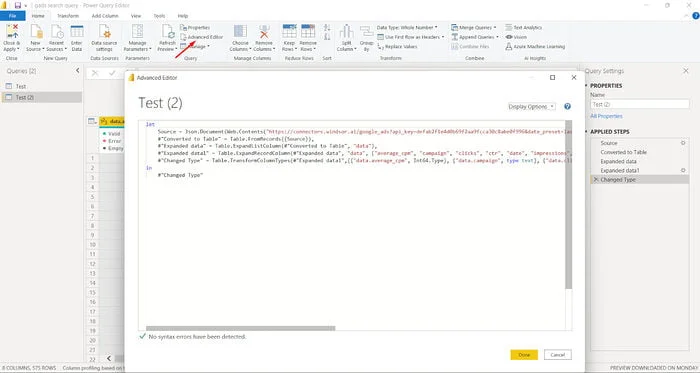
3. Copy the query in the advanced editor of the original table, delete the duplicated table and now refresh and the data should be appended.
Method 3: Creating a custom M query to append Data
This method is more complicated and would require an advanced knowledge of M query.
First create a function named “GetData” to get data of a specific date from that site.
(date1 as date) as table =>
let
Source = Web.Page(Web.Contents("http://www.xe.com/currencytables/?from=USD&date="&Date.ToText(date1,"yyyy-MM-dd"))),
Data = Source{0}[Data],
#"Changed Type" = Table.TransformColumnTypes(Data,{{"Currency code ▲▼", type text}, {"Currency name ▲▼", type text}, {"Units per USD", type number}, {"USD per Unit", type number}})
in
#"Changed Type"
Then use the formula below to create a new query to get all data from the date range which you can specify in the query.
let
Source = List.Dates(#date(2017, 12, 1), 10, #duration(1, 0, 0, 0)),
ToTable = Table.FromList(Source, Splitter.SplitByNothing(), null, null, ExtraValues.Error),
Renamed = Table.RenameColumns(ToTable,{{"Column1", "Date"}}),
Added = Table.AddColumn(Renamed, "Custom", each GetData([Date])),
#"Expanded Custom" = Table.ExpandTableColumn(Added, "Custom", {"Currency code ▲▼", "Currency name ▲▼", "Units per USD", "USD per Unit"}, {"Custom.Currency code ▲▼", "Custom.Currency name ▲▼", "Custom.Units per USD", "Custom.USD per Unit"})
in
#"Expanded Custom"
How to load historical marketing data into Power BI
Loading historical data in Power BI helps draw rich marketing insights. However, you must know how to do it right.
If you are an advertising agency or working with a marketing team at a large company, you must be familiar with Power BI’s challenge with high data volume. If the number of rows exceeds 10,000 from a single query Power BI runs into issues.
Storing a historical CSV export of marketing data in Power BI locally can help you overcome this problem. You can then create a new table that draws data from both web-based and local CSV-based tables.
Here’s how you can do it in 5 easy steps.
1. Download historical data from your query manager
Run a query for the date range and data on your query manager. If the data you are looking for is voluminous or the date range too big, you may want to break it into multiple CSV files.
2. Set up web-based data for automatic incremental update
For web-based data, copy the URL from your query manager and save it in a notepad. In the URL parameters, set the end date to today. Ensure the start date parameter in the URL of your web-based data is right after the last date in your CSV files.
3. Import the CSV files with historical data into Power BI
Under the Home tab in Power BI, click on Get Data and choose Text/CSV. Upload the relevant CSV files. Once the data is imported, name the table appropriately to distinguish it from incremental web-based data.
4. Import web-based table
Navigate to Home > Get Data > Web. In the pop-up that appears, select basic and choose basic. Paste the URL obtained in step 2 and click OK.

5. Create a UNION table

Under Table Tools, choose modeling and create a UNION of tables from CSV files and the one on the web.
The syntax for it is:
UNION(<table_expression1>, <table_expression2> [,<table_expression>]…), where table_expression is the name of the table.
While the historical data table remains constant, the web-based table will automatically refresh with a single click. The process of loading and using historical data into Power BI is fairly straightforward. However, it has a few limitations.
Limitations in loading historical data into Power BI
- You may have to run multiple queries if your data exceeds 1M rows. The queries can be split by days, weeks, months, quarters, or years.
- If your query manager cannot retrieve data in 30 minutes, it would time out. You will have to reduce the date range by splitting data to bring retrieval time to under 30 minutes.
- Similarly, you will have to slice the date range if the size of data exceeds 1GB.
- Although there isn’t a limit on files you can upload, keeping the cumulative size under 1GB helps you process data faster.
Using a cloud-based data warehouse like BigQuery, Snowflake, or Azure Synapse, can help you overcome most of these limitations. These warehouses do the heavy lifting of data and free up computing power for Power BI.
Conclusion: Appending Historical Data in Power BI
There are many ways to keep historical data in power while getting daily updates, but it is not advised to use these methods for big volumes of data.
To use the methods that we spoke about in the article, you would need to have basic and intermediate knowledge of M Query to be able to manipulate your data, by adding, removing or formatting your tables and columns.
That’s why we advise you to use Windsor.ai’s tool, because with windsor.ai’s software your data will be cached and can be queried at any time with any coding or hassle.

Try Windsor.ai today
Access all your data from your favorite sources in one place.
Get started for free with a 30 - day trial.
You May Be Also Interested in:
Free Power BI Templates in 2024
Connect Google Ads to Power BI
Connect Facebook Ads to Power BI
Connect Salesforce to Power BI
Connect Twitter Ads to Power BI
Connect Linkedin Ads to Power BI
Visualize Google Search Console in Power BI
Connect Tik Tok Ads to Power BI
Power BI Data Sources: Different Types & How to Connect Them

