 AI insights
 About us
 Careers
 Security
 Customer reviews
 Contact us
 Affiliate program
 Solution partners
 Looker Studio templates
 Tableau templates
 Facebook Ads templates
 Google Ads templates
 Data fields & Metrics
 AI prompt library & Guides
 Product documentation
 API documentation
 Case studies
 Blog
Blog Data models
 Windsor vs Supermetrics
 Windsor vs Fivetran
 Windsor vs Portermetrics
Connect Shopify to Power BI
Quickly integrate your Shopify data into Power BI with Windsor.ai’s ETL connectors.
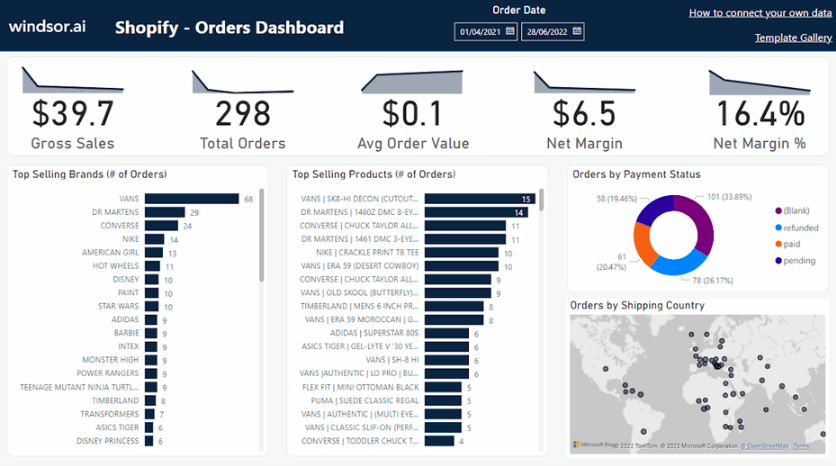
Our data integration platform automatically streams your Shopify data into real-time Power BI dashboards, giving you instant visibility into customer behavior, sales trends, inventory performance, and other essential areas. Leverage these insights to refine your e-commerce strategy, enhance the customer experience, and drive higher sales.
Forget CSVs. Stop copy/paste. Connect data in 2 minutes. No code required.


Elevate your e-commerce analytics with Shopify to Power BI integration
Integrating Shopify with Power BI through Windsor.ai helps you make the most out of your e-commerce performance analytics thanks to these features:

Automate reporting
Automate reporting
Windsor.ai connects Shopify with Power BI in a matter of minutes, turning your raw data into insightful reports. This automation saves time and reduces manual effort, allowing you to focus on scaling your store and improving business strategy.

Track business performance
Track business performance
Unlock actionable insights across your sales, marketing, and operations with this integration. Use automated dashboards and real-time data flows to identify trends, uncover growth opportunities, and respond to changes faster.

Optimize budget
Optimize budget
Power BI’s customizable dashboards let you measure Shopify campaign performance across key metrics like traffic, conversions, customer engagement, and ROI. Quickly identify top-performing campaigns and allocate your budget where it delivers the greatest impact.
Using Windsor.ai connector to import data from Shopify into Power BI
Most Shopify to Power BI integrations require manual data handling, technical expertise, or expensive third-party tools. Windsor.ai simplifies the process with a no-code ETL connector that automates data flow for efficient reporting and in-depth analysis.
In just a few clicks, Windsor.ai connects your Shopify data to Power BI, giving you real-time insights to optimize your e-commerce strategies and boost business growth with smarter, data-backed decisions.

How to connect Shopify to Power BI in Windsor.ai
Windsor.ai supports two Power BI integration methods: Desktop and Web.
Follow our step-by-step guide and video tutorials to get started quickly.
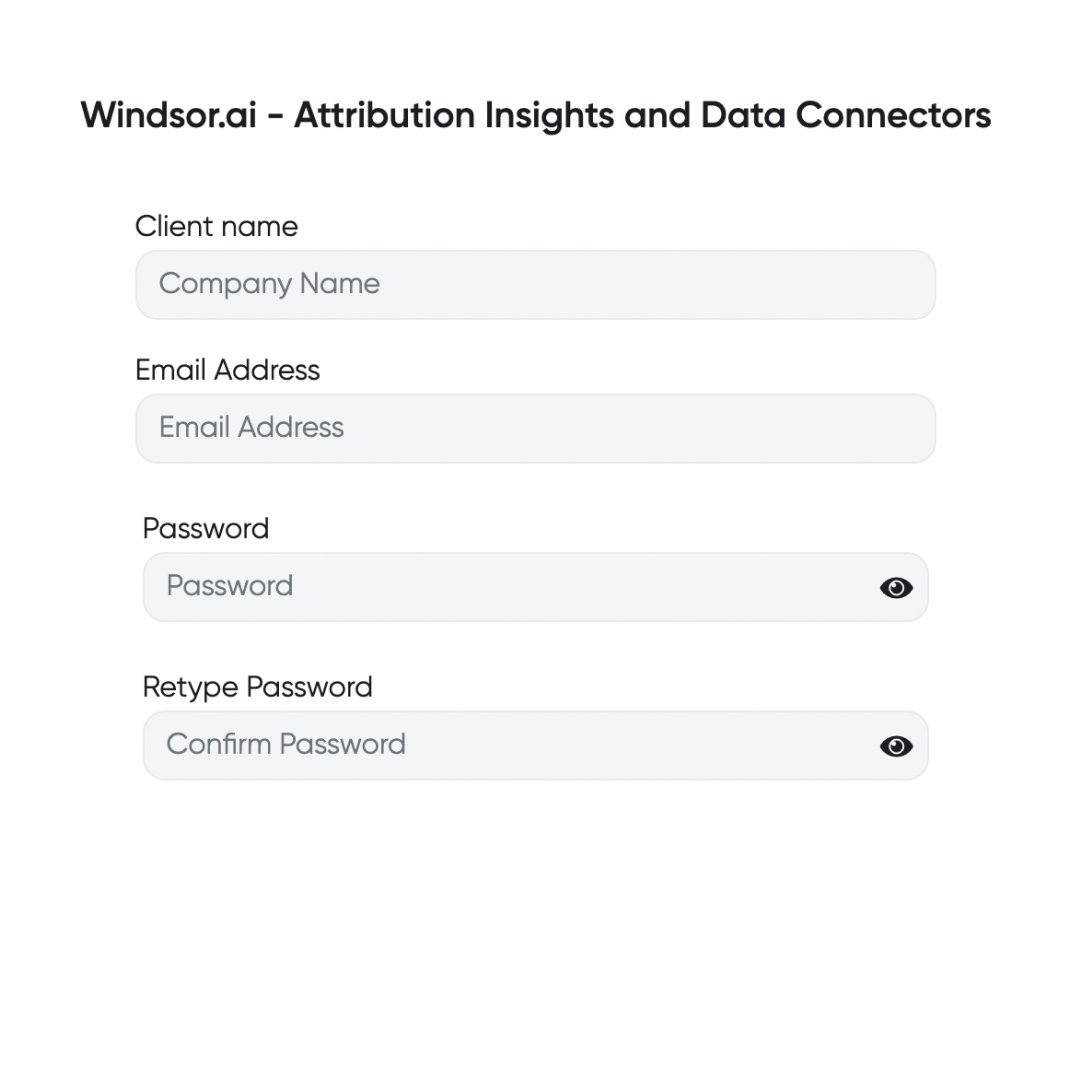
Register and log in to Windsor.ai
Create a new Windsor.ai account or log in if you already have one.
Select your data source
Choose Shopify as your data source and grant access to Windsor.ai.

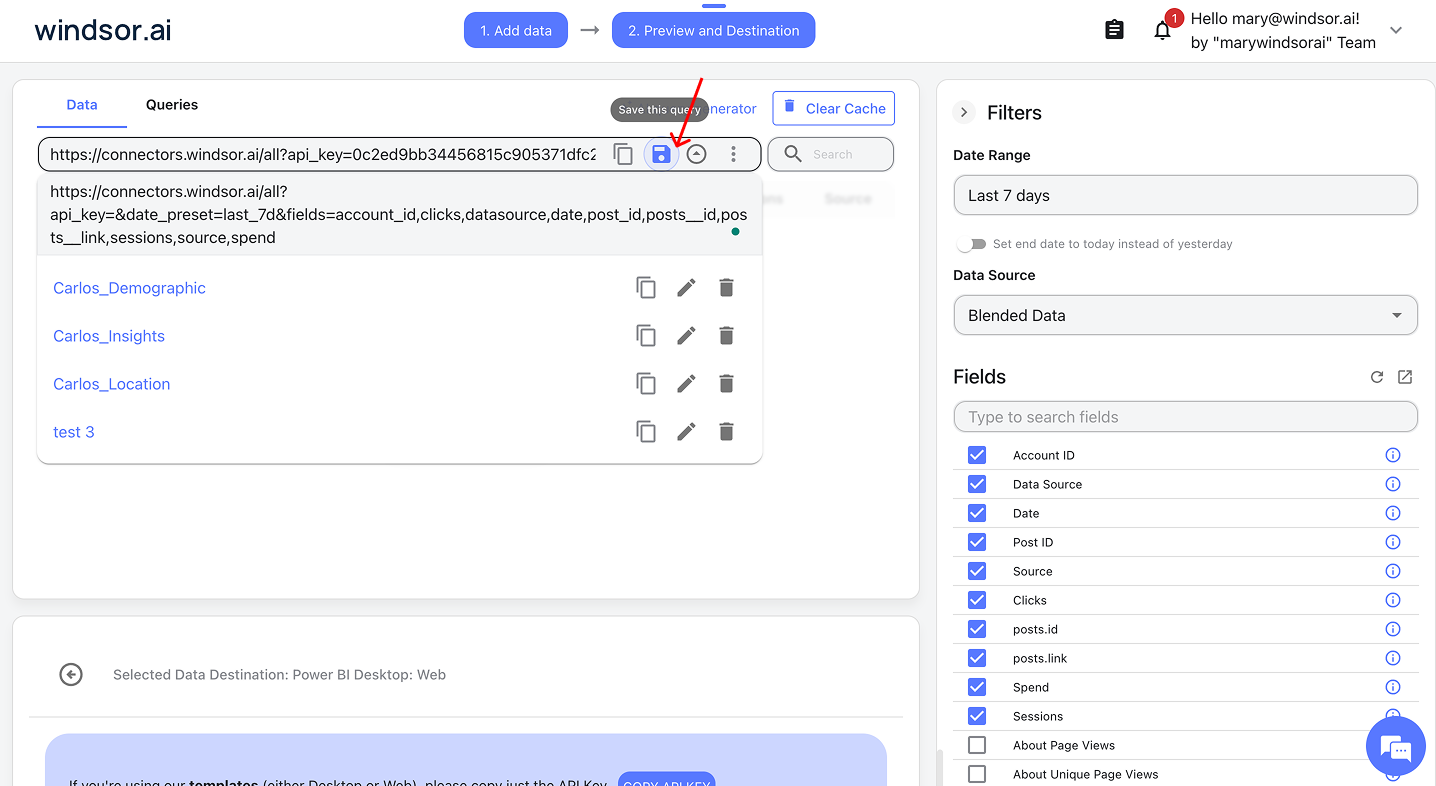
For Power BI Desktop: Save your query and select it in the app
- Save a query if you’re building a custom report in Power BI Desktop
- In Power BI Desktop, go to Get Data → Windsor → Sign in
- Select your saved query from Windsor and click Load
Video instructions: https://www.youtube.com/watch?v=Zf-3JYC1d1Q.
For Power BI Web: Copy your Windsor query URL
- Copy your query URL if you’re using Power BI Web
- In Power BI, go to Get Data → Web, paste your copied query URL, and click Ok
- Let the dashboard auto-load data
Video instructions: https://www.youtube.com/watch?v=L1NeAKUwqXk.
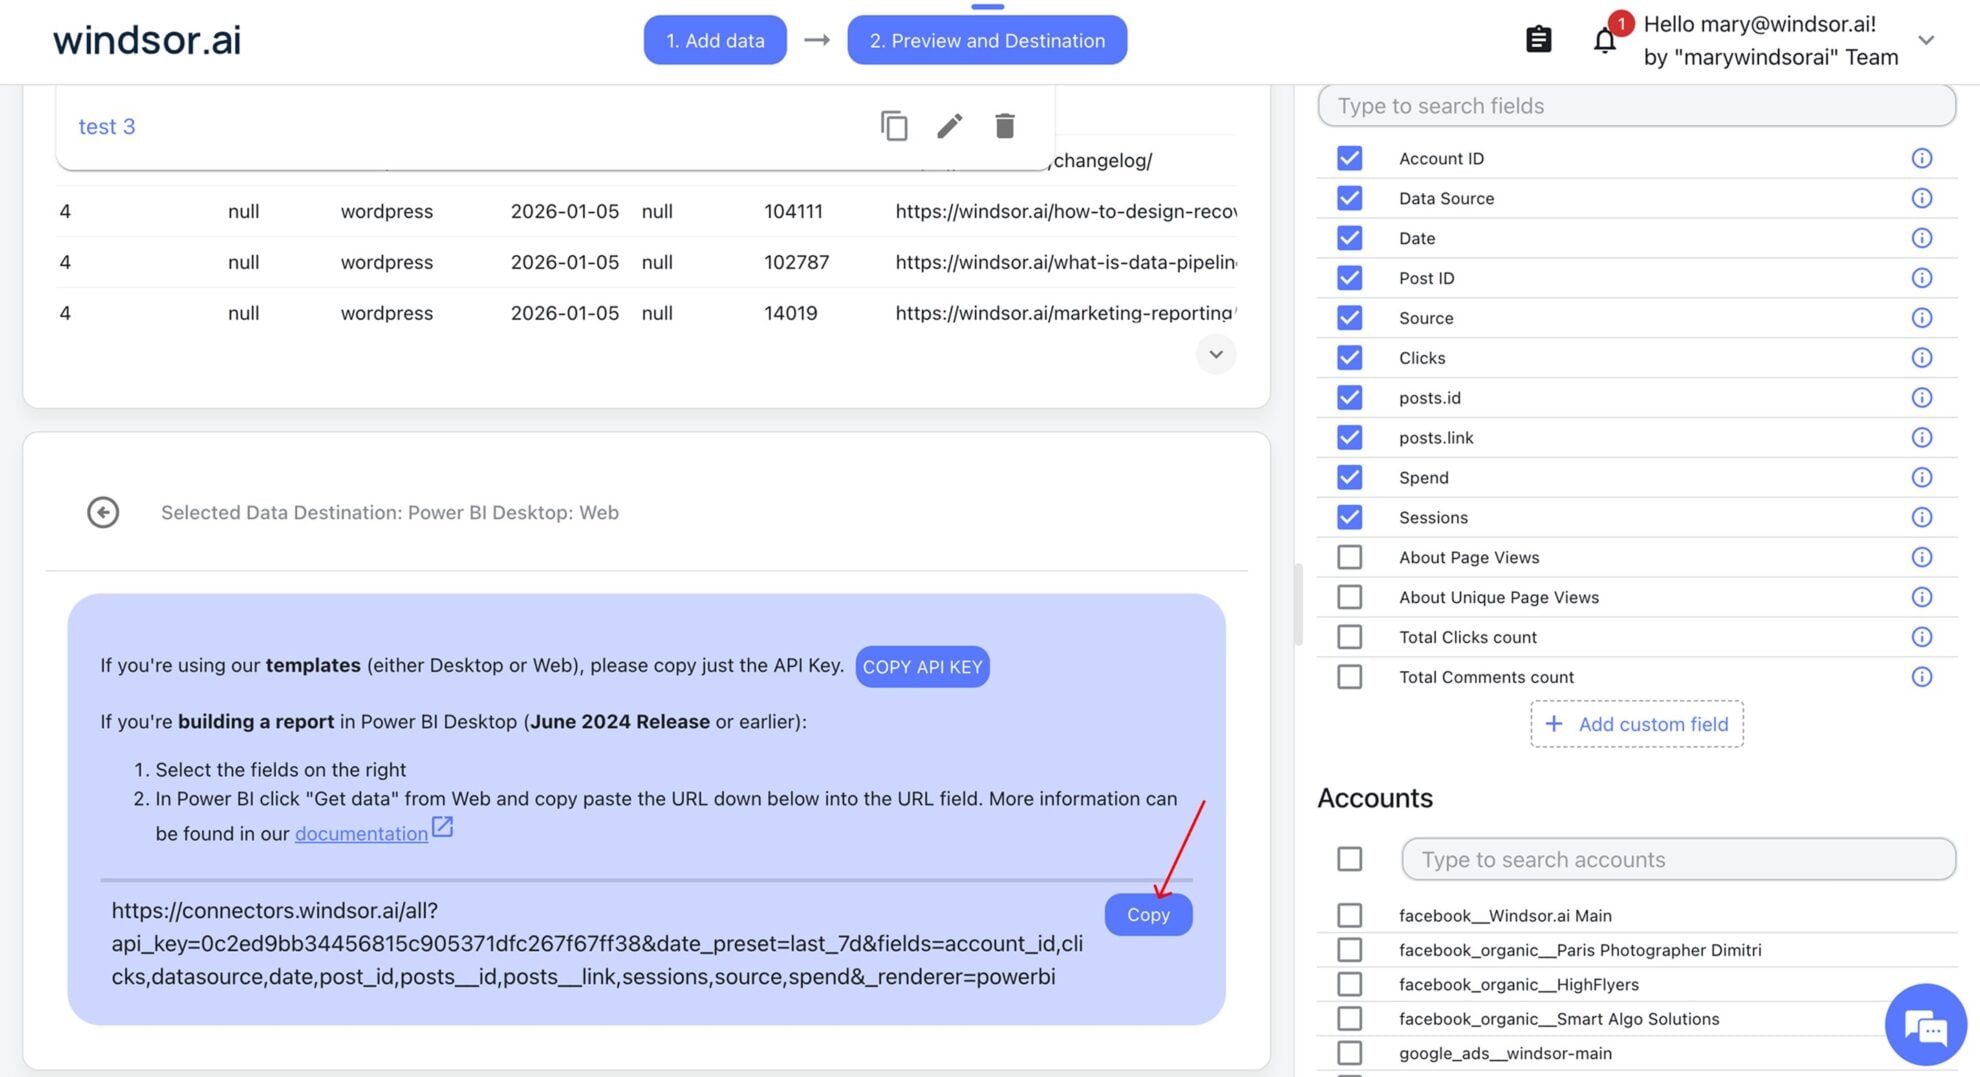
For Power BI templates: Connect your data via the API key
-Open the Shopify template (Web or Desktop) from our Power BI template gallery
-Copy your Windsor.ai’s API key and insert it into the template start screen to sync your data

Build and refresh your report
Congratulations, you’ve connected your Shopify data to Power BI via Windsor.ai. Now, you can visualize it in the preferred way.

FAQs
What is Power BI?
Power BI is a popular analytics tool developed by Microsoft for small and large businesses alike. It provides software services, connectors, and apps that work collectively to convert data into easy-to-interpret reports and dashboards. The insights gained can then be used to enhance an organization’s decision-making processes. Power BI also allows users to connect to hundreds of data sources, visualize, and share reports with the relevant people.
Do you have helpful links to get started with integrating Shopify and using Windsor.ai?
Yes, we have helpful resources to help you get started. You can explore our official documentation and ready-to-use templates for seamless Shopify to Power BI integration with Windsor.ai:
How much does it cost to integrate Shopify into Power BI with Windsor.ai?
Windsor.ai’s pricing for Shopify into Power BI data integration can vary depending on your use case. We offer transparent pricing plans tailored to diverse business needs and budgets.
How much time do I need to create the Shopify and Power BI integration?
Windsor.ai provides a user-friendly interface and a powerful data connector that enables you to integrate Shopify with Power BI in under 5 minutes, making the process quick and hassle-free.
Tired of manual Shopify data exports? Try Windsor.ai today to automate your reporting

