 AI insights
 About us
 Careers
 Security
 Customer reviews
 Contact us
 Affiliate program
 Solution partners
 Looker Studio templates
 Tableau templates
 Facebook Ads templates
 Google Ads templates
 Data fields & Metrics
 AI prompt library & Guides
 Product documentation
 API documentation
 Case studies
 Blog
Blog Data models
 Windsor vs Supermetrics
 Windsor vs Fivetran
 Windsor vs Portermetrics
 Last updated: 17 November 2025

Modern businesses manage dozens of channels, from Google Ads and Facebook campaigns to SEO and CRM analytics.
However, when it comes to reporting, paid and organic marketing data are often fragmented and tracked separately, making it challenging to obtain a comprehensive view of performance.
In this guide, you’ll learn how to track paid and organic campaigns together in one dashboard using Windsor.ai data integration platform.
We’ll cover why cross-channel analytics matters, how Windsor automates this process, and the way you can set up a unified paid and organic marketing dashboard in tools like Looker Studio and Google Sheets.
As a bonus, you’ll get a list of free, ready-to-use multi-channel marketing attribution templates for an instant start.
Why you need a unified paid and organic marketing dashboard
Most marketing teams rely on multiple platforms:
- Google Ads and/or Meta Ads for tracking paid media performance
- Google Analytics 4 or Search Console for tracking the website analytics
- CRM and sales tools for tracking conversions and revenue
When you manage these systems separately, your reports only show part of the story.
A unified paid and organic marketing dashboard synchronizes all the KPIs that matter. As a result, you gain a complete picture by combining all touchpoints like paid clicks, organic visits, conversions, revenue, and more, across every channel, into a single, interactive view.
Benefits of combining paid & organic data:
- Understand how paid and organic channels work together and side-by-side in driving conversions
- Identify cannibalization or synergy between different channels
- Optimize budgets based on total ROI, not just ad spend
- Simplify reporting and reduce manual spreadsheet work
The challenge: data fragmentation across platforms
Without automation of data ingestion, creating a cross-channel marketing dashboard means you have to:
- Export CSVs from each ad and analytics platform
- Clean and map field names manually
- Manage different date ranges, metrics, time zones, and currencies
- Rebuild and update reports every time you need fresh insights
In this way, the reporting process is not only time-consuming but also prone to data inconsistencies and errors.
That’s where Windsor.ai comes in.

How Windsor.ai automates paid and organic data blending
Using Windsor.ai, you can automatically connect and blend paid and organic marketing data from over 325+ sources, including Google Ads, Facebook Ads, Bing, TikTok, Google Analytics 4, Google Search Console, HubSpot, and more.
Windsor.ai covers these three key data ingestion processes:
- Connects and pulls data from all your required sources, paid and organic.
- Maps and normalizes fields like spend, clicks, impressions, sessions, and conversions across all channels.
- Blends data and sends this unified dataset to your destination of choice, whether Looker Studio, Google Sheets, BigQuery, or another analytical environment.
The best part—you do not need to write SQL, export files, or build manual joins. Windsor.ai automatically handles data blending, so you can visualize paid and organic performance together in an auto-refreshing dashboard or table with near real-time or scheduled syncs.
Ensure your reports are always fresh, accurate, and super easy to create with these Windsor.ai features:
| Feature | Benefit |
| Blended data model | Unified schema for paid and organic data |
| Automatic data mapping | Standardizes metrics like spend, clicks, sessions, and thousands more across all channels |
| Support for multiple destinations | Looker Studio, Google Sheets, BigQuery, Power BI, Tableau, Databricks, Snowflake, and more |
| No-code setup | Connect and visualize your cross-channel data without scripts or SQL |
| Automatic refresh | Keep dashboards up-to-date with scheduled syncs |
| MCP for AI-driven analysis | Send your blended data to LLMs (ChatGPT, Claude, Gemini, or others) and query it using natural language |
🔗 Connect all your paid and organic marketing channels in Windsor.ai now: https://onboard.windsor.ai/. All are free with a 30-day trial.
What data to include in a paid & organic marketing dashboard
For your first automated marketing dashboard for paid and organic data, consider combining the following key metrics and dimensions:
| Category | Suggested metrics | Platforms |
| Paid marketing | Spend, Clicks, Impressions, Conversions, CPC, ROAS | Google Ads, Meta Ads, LinkedIn Ads, Bing Ads |
| Organic marketing | Sessions, Impressions, Clicks, CTR, Avg. position | Google Analytics 4, Google Search Console |
| Cross-channel metrics | Conversion Rate, Cost per acquisition (CPA), Total conversions | Windsor.ai blended fields |
Thanks to Windsor’s unified schema, all these fields are automatically aligned, so your dashboard always stays consistent with no manual input.
Is your data blended now and ready for further reporting and analysis? It’s time to select the best tool for creating a paid & organic marketing dashboard. Looker Studio and Google Sheets are considered to be the simplest yet effective platforms for cross-channel performance tracking.
How to track paid and organic marketing performance in Looker Studio
You can use Windsor.ai’s native connector to bring blended paid and organic data into Looker Studio in just a few minutes.
Integration steps:
- Sign up for Windsor.ai and start your 30-day free trial.
- From the data source list, connect your platforms like Google Ads, Facebook Ads, Google Analytics, Search Console, and complete authentication for each.
- In each connected data source, select the specific account(s) you want to retrieve data from.
- After selecting the account(s), click Next to go to the data preview page.
- In settings, in the data sources dropdown, select All, and choose the reporting fields you want to track across all channels (e.g., source, medium, spend, clicks, impressions, sessions, conversions, etc.).
- Windsor will automatically fetch and display your data in the preview table. Ensure the correctness of data and scroll down to the Data Destinations section.
- Choose Looker Studio as your destination.
- Authenticate your Looker Studio account, and Windsor will automatically send your blended, analysis-ready data to the unified Looker dashboard.
- Build your own report or use a pre-built Windsor template.
Visit the full documentation: How to integrate data into Looker Studio with Windsor.ai.
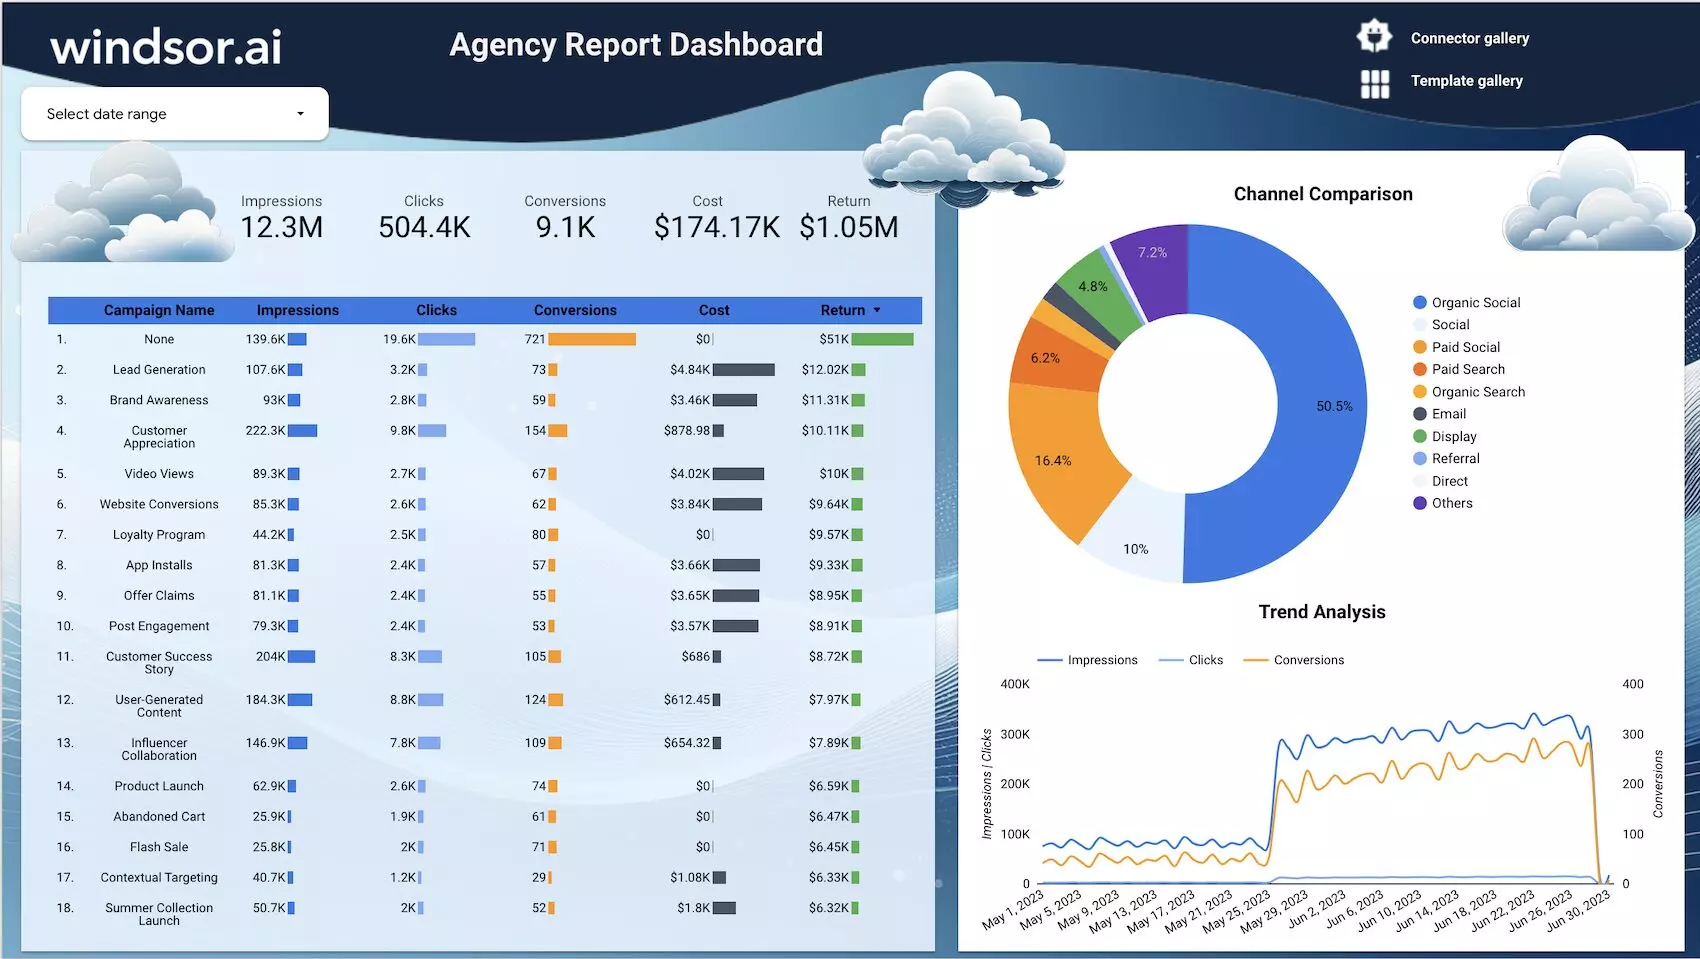
📚 Get started with multi-channel analytics instantly by choosing from Windsor.ai’s template gallery: Windsor.ai Looker Studio Dashboard Templates.

The majority of these templates include:
- Paid vs. organic traffic breakdowns
- Conversion performance charts
- Channel and campaign ROI comparisons
How to track paid and organic marketing performance in Google Sheets
Prefer a spreadsheet-based approach to reporting?
You can easily combine paid and organic marketing reports in Google Sheets via the Windsor.ai Sheets add-on.
Integration steps:
- Open your Google Sheets file, then go to Extensions -> Add-ons and search for Windsor.ai. Install the Windsor.ai extension.
- Log in to the Windsor.ai extension using your API key.
- Click Add new query in the right-hand panel.
-
Fill in the query details:
- Query name: Give your query a descriptive name (e.g., Cross-channel analysis 2025).
- Target sheet: Select or name the sheet tab where data will load.
- Data source: Choose Blended Data.
- Accounts: Select the specific accounts to pull data from.
- Date range: Set your reporting period (like last 14 days, 30 days, etc.).
- Fields: Choose all the fields you want to report on (like date, source, medium, spend, sessions, conversions, etc.).
- Filters: Apply optional filters if needed.
- Schedule: Select a data refresh period (like 15-min, hourly, daily).
- Click Load Data to pull information into your sheet.
Preview the integrated data and feel free to format it into charts, pivot tables, or Data Studio visualizations.
Visit the full documentation: How to integrate data into Google Sheets with Windsor.ai.
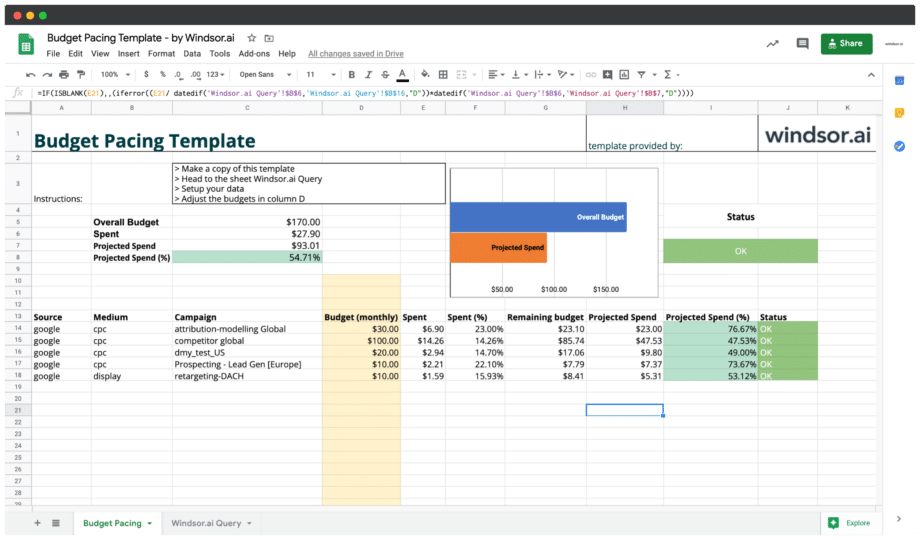
📋 You can get started quicker by applying Windsor’s pre-built templates for multi-channel performance tracking: Google Sheets Windsor.ai Dashboard Templates.
Conclusion
Tracking paid and organic marketing data together no longer needs manual input or CSVs.
With Windsor.ai, you can automatically blend and sync your data across 325+ platforms and visualize it in Looker Studio, Google Sheets, BigQuery, or any other BI tool you prefer.
🚀 Build your own cross-platform marketing dashboard today and compare how different channels and campaigns perform side by side: https://onboard.windsor.ai/.

