 Destinations
 Data sources
 AI insights
 About us
 Careers
 Security
 Customer reviews
 Contact us
 Affiliate program
 Solution partners
 Template gallery
 Looker Studio templates
 Power BI templates
 Excel templates
 Google Sheets templates
 Tableau templates
 Facebook Ads templates
 Google Ads templates
 Data fields & Metrics
 AI prompt library & Guides
 Product documentation
 API documentation
 Case studies
 Blog
Blog Data models
 Windsor vs Supermetrics
 Windsor vs Funnel.io
 Windsor vs Fivetran
 Windsor vs Rivery
 Windsor vs Portermetrics
 Windsor vs Coupler.io
 Last updated: 16 October 2026




The fastest free way to connect Instagram to Claude: authorize your account at onboard.windsor.ai/app/instagram, add the Windsor.ai connector from the Claude directory (search Windsor, click Add), and ask about your Instagram performance in a new chat. It takes a few minutes, needs no code, and works on Windsor’s free plan and on any Claude plan that supports connectors.
This guide covers Instagram Insights, the analytics for your own Business or Creator account. If you want to analyze someone else’s public account, see Instagram competitor analysis with Claude. For paid campaigns, see the Meta Ads to Claude integration.
Instagram is the most used data source on Windsor’s Claude connector, reaching roughly a third of active teams in an average week, so the prompts and field lists below are built from what those teams ask, not from a feature sheet. Once connected, Claude can tell you which Reels hold viewers, which posts earn saves and shares, when your followers are online, and produce a client-ready report like the one below in seconds.
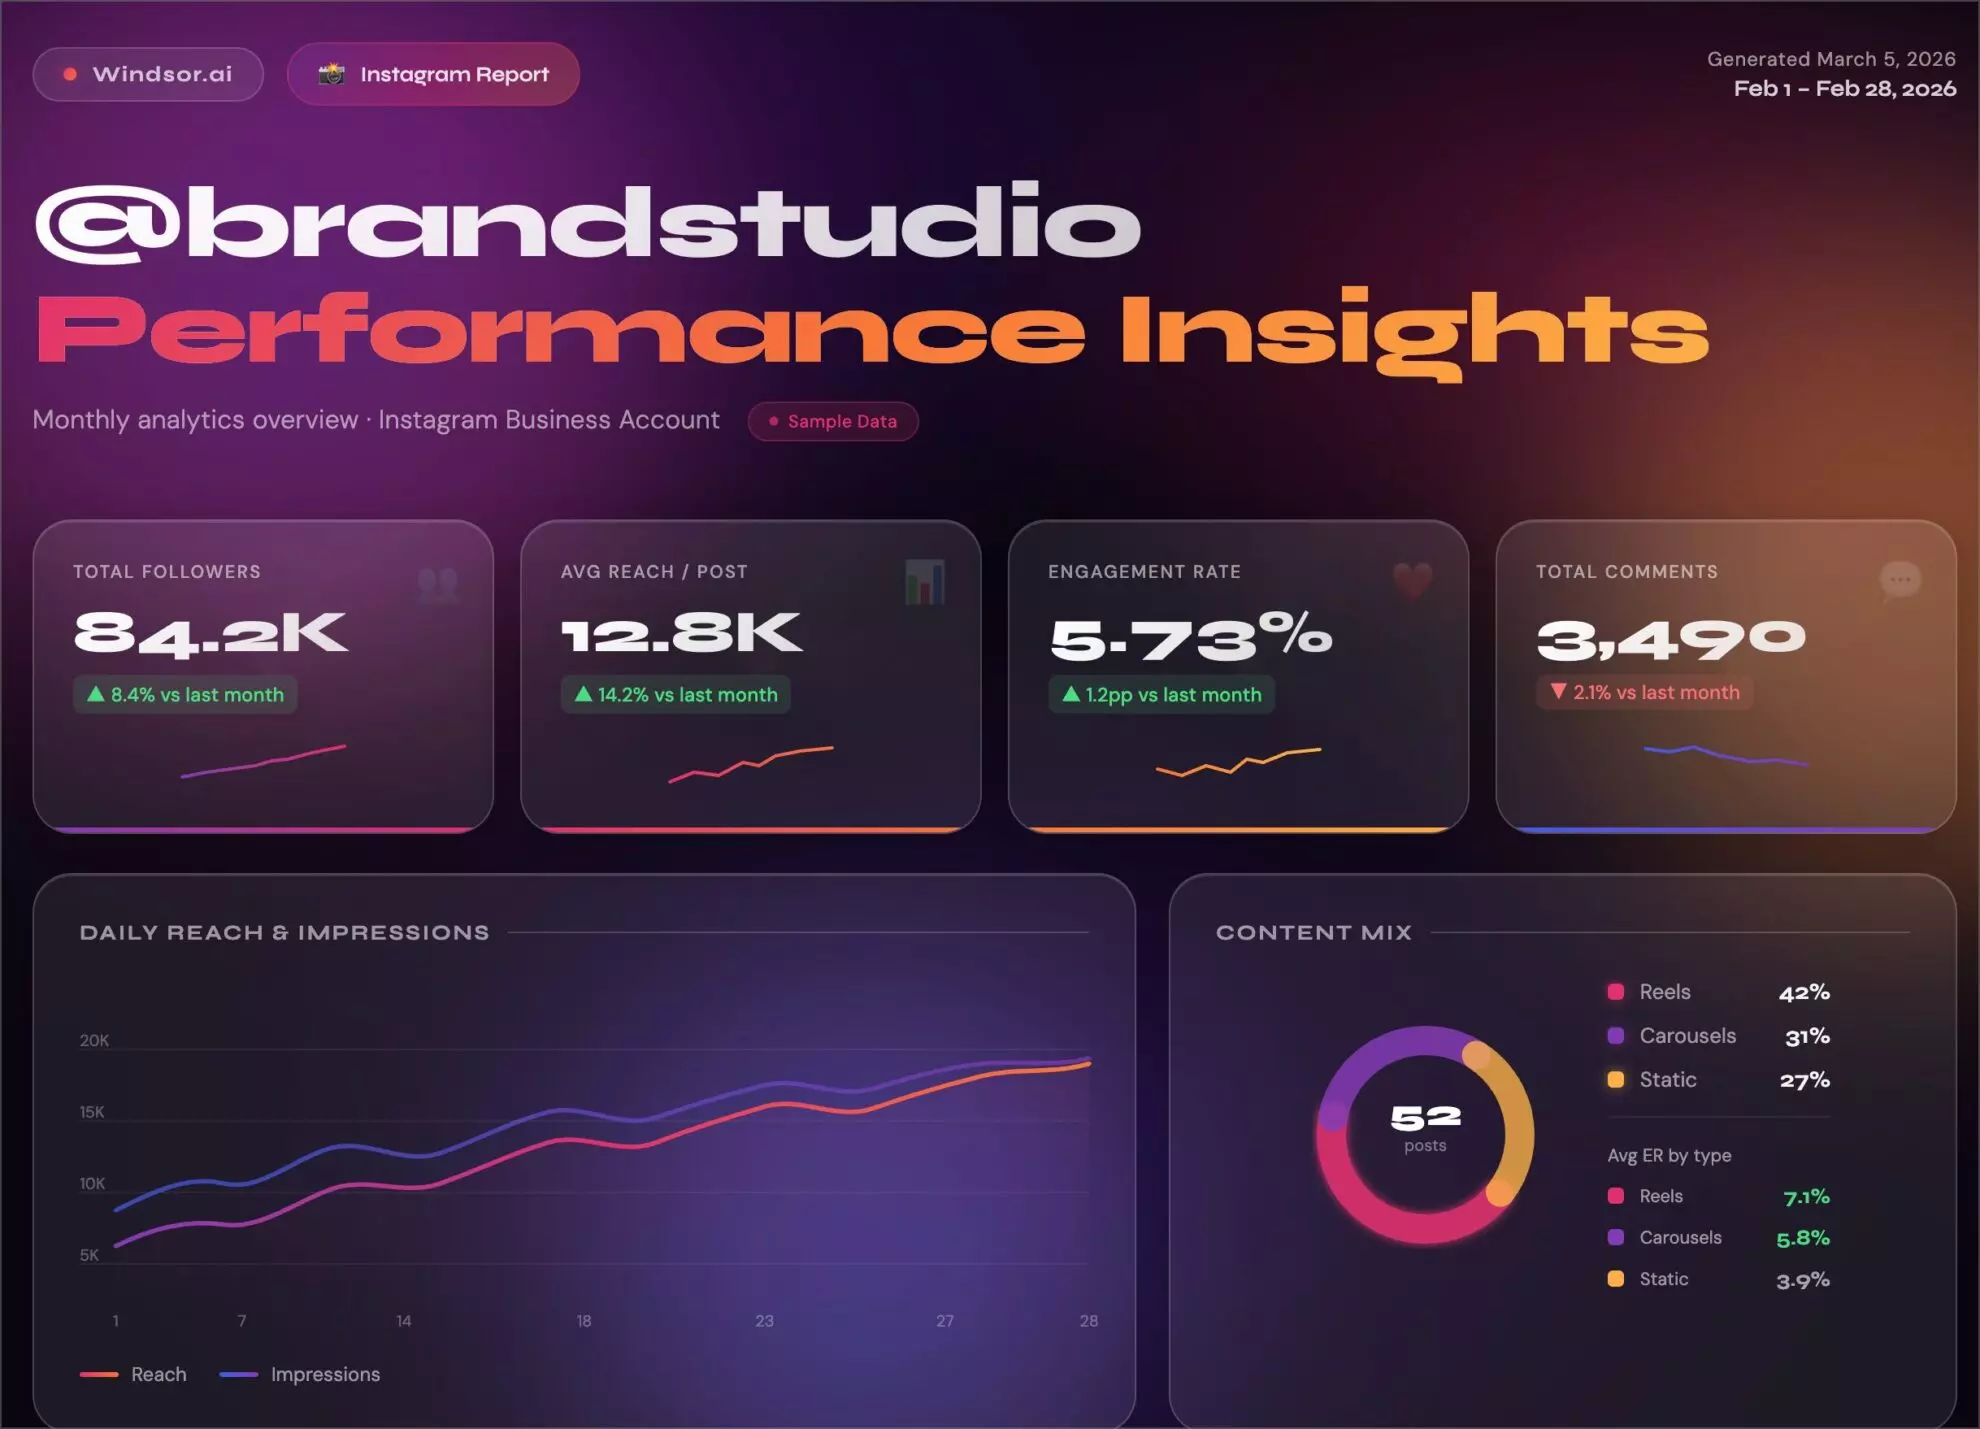
🚀 Build your first Instagram to Claude connection for free: https://onboard.windsor.ai/.
Four ways to connect Instagram to Claude, and which one is free
Anthropic’s Claude directory lists the Windsor.ai connector, which is how Instagram Insights gets into Claude with one click. Instagram itself has no first-party Claude connector, so every route goes through a connector, a file, a browser, or code. “Best for” leads so you can jump to the row that matches your situation.
| Windsor.ai connector | CSV export | Claude in Chrome | Claude Code + Instagram API | |
| Best for | Live analysis of your account, alone or next to ads and web data | One question about a fixed period | A quick look at what the Insights screen shows | Custom workflows for developers |
| Cost | Free plan (one source, one account) | Free | Paid Claude plan (Max and Team, Pro rolling out) | Developer time, Meta app review |
| Data | 124 fields: posts, Reels, Stories, daily account metrics, audience | Whatever the export contains, captions often missing | Only what is on screen, no history beyond what you scroll | Whatever the Graph API returns |
| Fresh data | Yes, queried at prompt time | No, static snapshot | Yes, while the tab is open | Yes, if you build it |
| Cross-channel | Yes, 350+ sources | Only what you upload | No | Only if you build it |
| Can post | Yes, single image posts with your approval | No | No | Yes, if you build it |
The rest of this guide walks through the connector route, then the prompts and fields that get the most use, with the browser and Claude Code routes covered further down.
Connect Instagram to Claude in 3 steps with the Windsor.ai connector
The connector runs on Windsor MCP (Model Context Protocol). Setup is a no-code process that takes a few minutes.
📖 Prefer video? Here is the same setup on screen:
Prerequisites
- A Windsor.ai account (free or paid plan)
- An Instagram Business or Creator account linked to a Facebook Page
- A Claude account on a plan that supports connectors
Step 1: Grant Windsor access to Instagram
- Log in to onboard.windsor.ai.
- Select Instagram Insights as your data source.
- Authenticate via Facebook and select the Instagram profiles you want to pull data from.
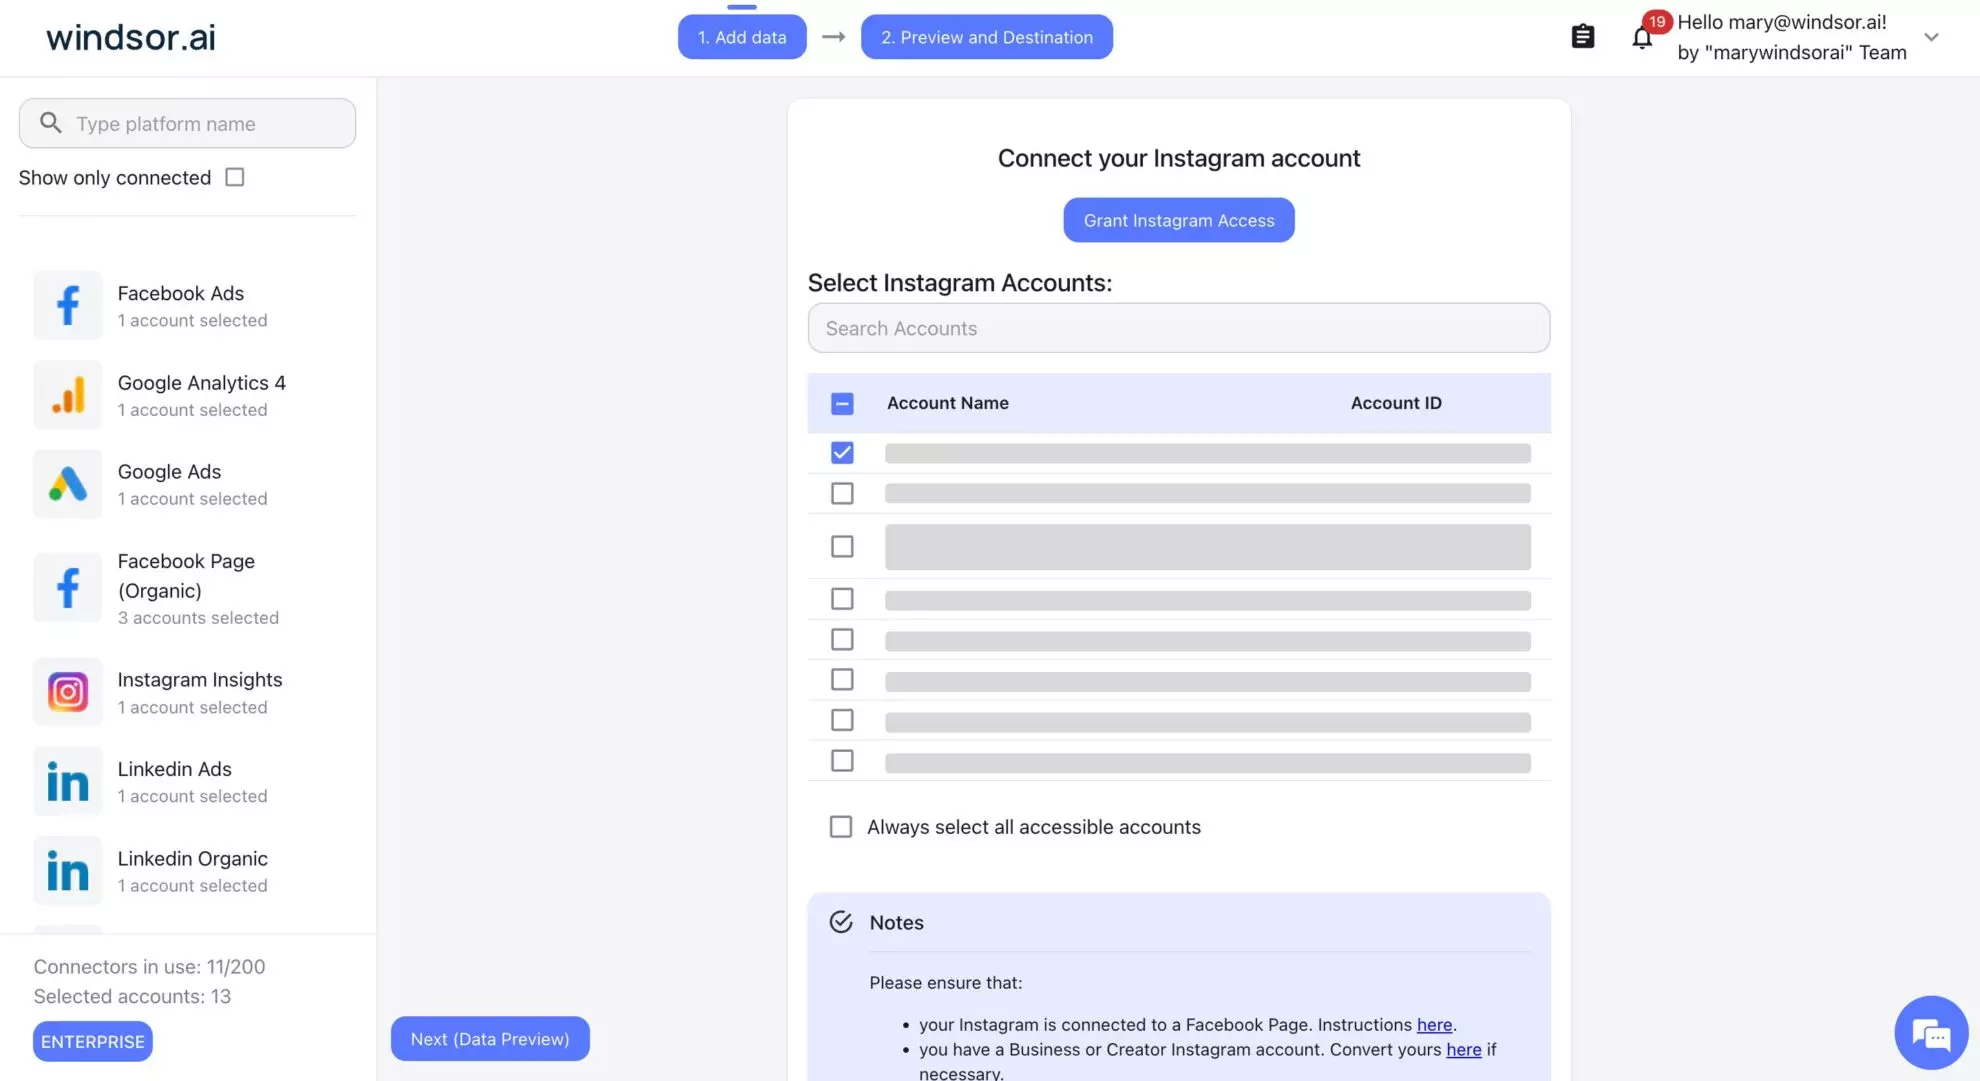
Windsor connects to the Instagram Graph API and normalizes the data, so posts, Reels, Stories, daily account metrics and audience breakdowns arrive in Claude as clean, structured tables.
Step 2: Add the Windsor.ai connector in Claude
In Claude, open Customize, then Connectors, search for Windsor and click Add. Sign in to your Windsor.ai account when prompted. You can also open the Windsor.ai listing in Claude’s directory and click Connect. The connector works in the Claude web app and Claude Desktop, and in any other MCP-compatible client, including Claude Code, following the setup guide.
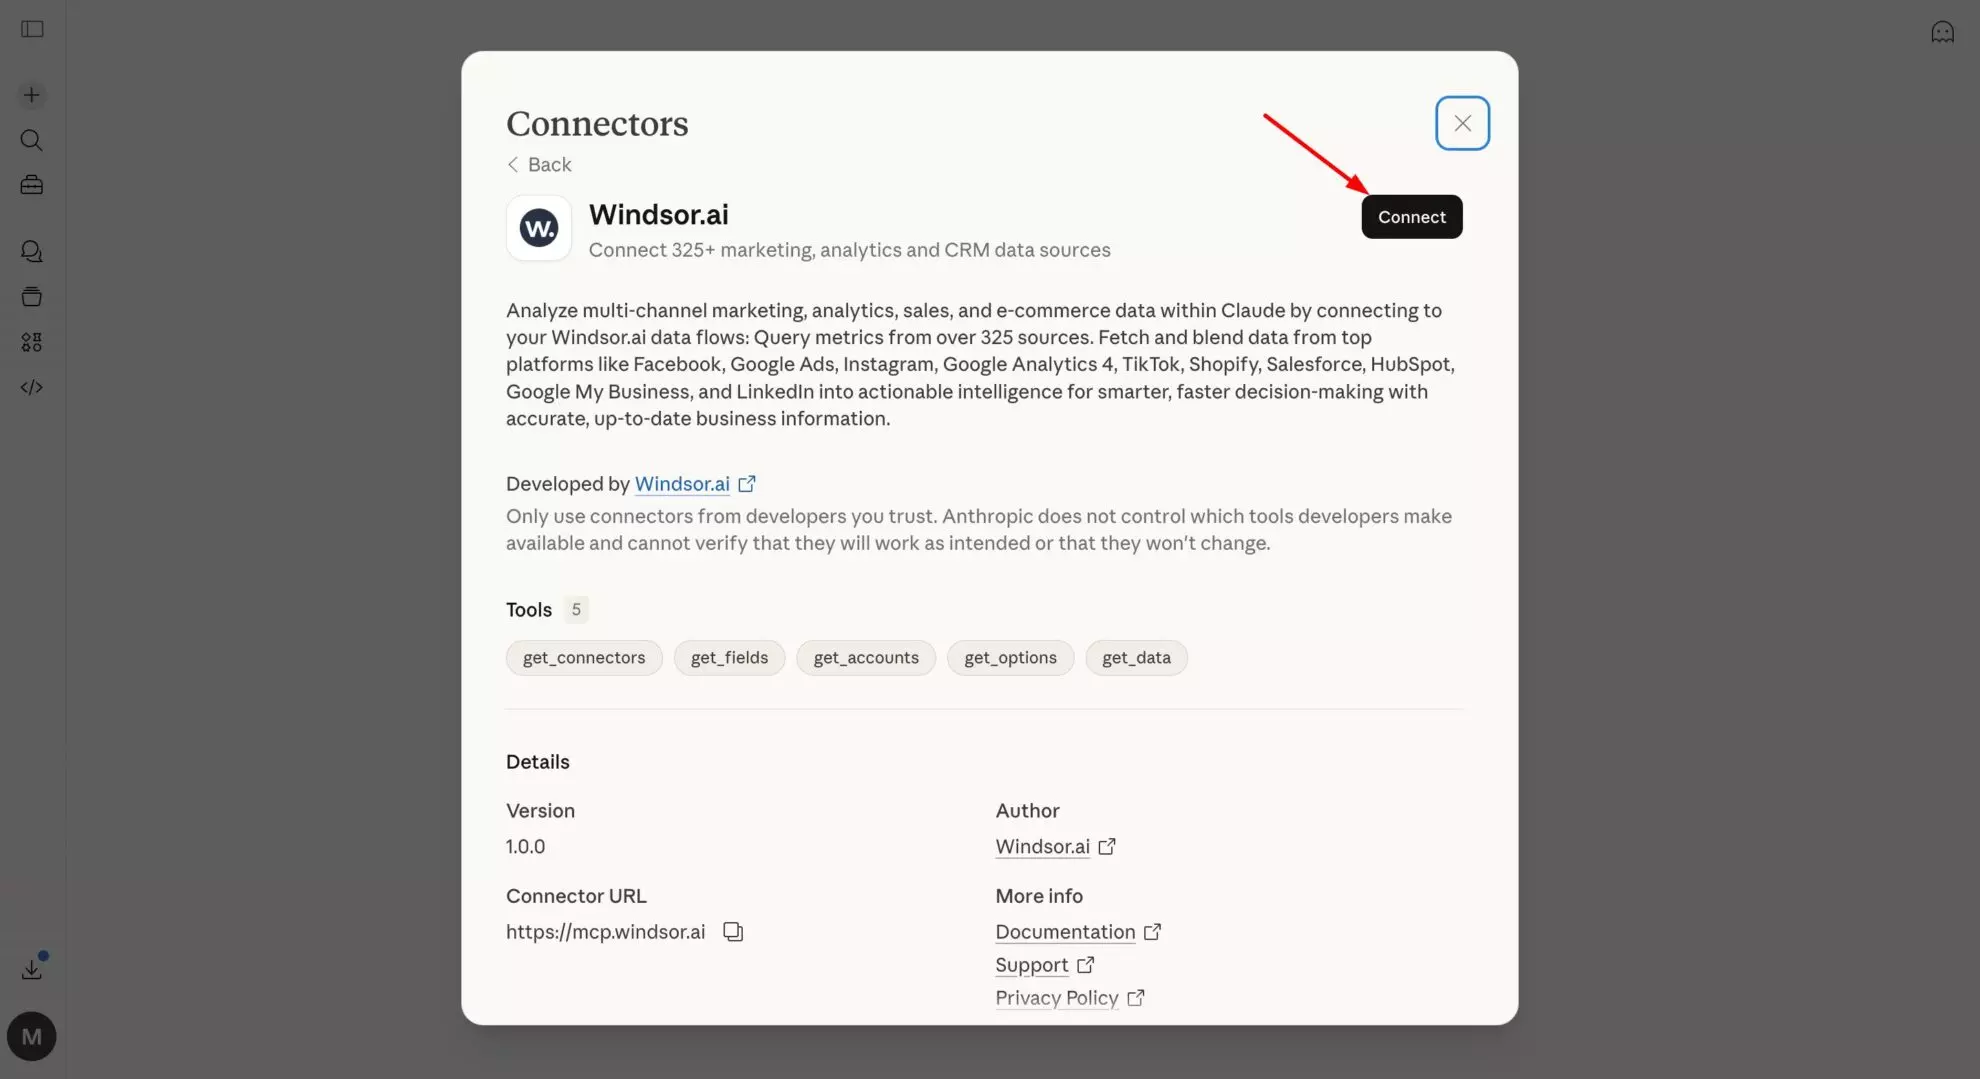
💡 Pro tip: Set permissions to “Always allow” so you can query follower growth and post reach across chats without re-authorizing every time.
Step 3: Start querying your Instagram data
Open a new chat, enable the Windsor connector, and ask in plain language. Three prompts to start with:
- “Which of my Reels had the highest share rate in the last 14 days?”
- “Compare the engagement rate of my posts from last month. Which content formats performed best?”
- “Show my daily reach and follower change for the last 30 days. Which days stand out, and what did I post on them?”
💡 Pro tip: Ask Claude for a chart, a table, or a step-by-step action plan. It will build the format from the same data.
Instagram prompts for Claude, in the order teams use them
These follow the query patterns we see on the connector. Most questions cover the last 30 days, then 90 days and 7 days, and a smaller group pulls up to two years for trend work. Each prompt names the fields it uses, so Claude fetches the right table the first time.
Account snapshot
The single most common request: a profile summary before any analysis.
Give me a snapshot of my Instagram account: username, followers_count, follows_count, media_count and biography. Then compare followers_count and reach_1d over the last 30 days with the 30 days before.
Post performance and content strategy
List my posts from the last 30 days with media_type, media_caption, media_reach, media_saved, media_shares, media_like_count, media_comments_count and media_views. Which content themes in the captions earned the highest save and share rates? Suggest three post ideas based on them.
Compare Reels, carousels and single images (media_product_type) for the last 90 days on median reach, saves and shares per post. Which format should I publish more of?
Reels audit
For my Reels from this month, show media_views, media_reel_avg_watch_time, media_reel_skip_rate and media_reel_total_interactions. Which Reels kept viewers longest and had the lowest skip rate, and what do they have in common (length, hook, topic)?
Growth and daily trend
Show date, follower_count_1d, reach_1d, accounts_engaged, total_interactions and profile_links_taps for the last 30 days. Which days had the biggest follower gains, and which posts went out on those days?
Audience
Break down my audience by audience_country_name and audience_gender_age_name. Which countries and age groups are growing fastest, and does my posting time match when they are online?
Discovery and new audiences
Which posts and Reels in the last 14 days brought the most media_follows and media_profile_visits relative to reach? Summarize what those posts did differently.
🤖 More prompts in the Windsor AI Prompt Library.
Instagram metrics Claude can read through Windsor
Windsor exposes 124 Instagram fields. The table lists the ones teams query most, with the field codes you can use in prompts. The full list is in the Instagram field reference.
| Area | Key fields | What Claude can do with it |
| Profile | username, followers_count, follows_count, media_count, biography, website | Account snapshots, agency roll-ups across accounts |
| Posts and Reels | media_type, media_product_type, media_caption, media_reach, media_views, media_saved, media_shares, media_like_count, media_comments_count, media_engagement, media_permalink, timestamp | Content ranking, theme analysis from captions, format comparison |
| Reels retention | media_reel_avg_watch_time, media_reel_skip_rate, media_reel_total_watch_time, media_reel_total_interactions | Hook and retention audits |
| Daily account metrics | date, follower_count_1d, reach_1d, accounts_engaged, likes, comments, saves, shares, views, total_interactions, profile_views_1d, profile_links_taps | Growth trends, weekly reports, spike detection |
| Discovery signals | media_follows, media_profile_visits | Which posts turn viewers into followers |
| Audience | audience_country_name, audience_country_size, audience_gender_age_name, audience_age_name, audience_city_size | Localized content, posting-time decisions |
Data is queried live from the Instagram Graph API each time you ask, so there is no fixed sync schedule.
Claude in Chrome vs the connector: which one for Instagram?
Claude in Chrome, now part of Claude Cowork on Max and Team plans and rolling out to Pro, can open your Instagram Insights in a tab and read what is on screen. That is enough for a one-off profile audit or a quick comparison of a few posts. It has limits for ongoing analysis: Claude only sees what you scroll to, there is no per-post history table to compute rates from, nothing from other channels, and it needs a paid Claude plan.
The connector gives Claude the tables behind the dashboard, works on the free Windsor plan, and puts Instagram next to your other sources. Use the browser for a look, the connector for the work. For other people’s accounts, neither is the right tool: use the Instagram Public connector, which reads public profile and post data without a login.
Connector vs automation platform: two different ways to connect Instagram to Claude
“Connect Instagram to Claude” covers two different jobs, and the tools are not interchangeable.
A data connector, such as Windsor.ai, gives Claude read access to your Instagram Insights inside the chat. You ask a question, Claude queries your account history through the connector and answers with the numbers. It covers 124 fields, keeps history beyond the 90-day window the Instagram app shows, and sits next to your ads and web data in the same chat. When you ask it to, the Windsor.ai connector can also publish a single image post.
An automation platform (a workflow tool that links apps through triggers and actions) moves single events between Instagram and the Claude API: a new comment arrives, a workflow sends it to Claude, Claude drafts a reply, the workflow posts it. That fits per-event tasks such as reply drafting or caption generation. It does not give Claude in the chat a view of your account performance, each new question means a new workflow, and automation platforms bill by task volume.
If the question is “how did my account perform”, use the connector. If the job is “do something every time X happens on Instagram”, use an automation platform. Both can run side by side on the same account.
Using Instagram data in Claude Code
Windsor’s connector is a remote MCP server, so it works in Claude Code the same way it works in the Claude app. Add Windsor as an MCP server following the setup guide, then query Instagram fields from your terminal, for example to build a weekly report script, push results into a spreadsheet, or combine Instagram with GA4 in a notebook. No Meta developer app or Graph API tokens to manage.
What to do with Instagram data in Claude
1. Content performance and trend discovery
Because Windsor sends captions along with the metrics, Claude can group posts by topic and compare them: “Posts about behind the scenes have a 20% higher share rate than product posts” is a typical answer.
2. Agency reporting across accounts
Connect several Instagram accounts in Windsor and ask Claude for one table across clients: followers, reach, engagement rate and top post per account, then a short written summary for each.
3. Cross-channel analysis
Among teams that query Instagram through Claude, the sources most often queried alongside it are Meta Ads, Facebook Pages, GA4, Google Ads and TikTok. That gives you questions no single dashboard answers:
Cross-reference my Instagram post dates with GA4 sessions from Instagram referrals. Which posts caused the biggest spikes in website traffic?
Put my organic Instagram reach next to Meta Ads spend and reach for the last 30 days. On days with paid boosts, did organic engagement rise or fall?
✨ For more, see the Windsor MCP use cases guide.
What Windsor sends to Claude
- Structured tables, not raw API output. Instagram’s endpoints for posts, Reels, Stories and account metrics are flattened into consistent fields, so engagement rates come out right.
- Captions, media types and permalinks alongside the numbers. Claude can connect what a post said with how it performed.
- Filtered at the source. Only the fields and date range you ask for are sent, which keeps chats fast.
- Live on every question. Data is fetched from the Instagram API when you ask, not uploaded once.
- Read and post. The connector can also publish a single image feed post with a caption to your account, after you approve it. See the Instagram write-action walkthrough.
The manual way: CSV export from Instagram Insights
For a single question about a fixed period, an export works and costs nothing.
- Log in to Meta Business Suite or Instagram Insights.
- Select your date range and export your “Content” or “Video” data as a CSV.
- Open a new Claude chat and upload the file.
- Ask Claude to summarize the performance.
Where it breaks down for regular use: the export is a snapshot, and Reel numbers on day one differ a lot from day seven. Captions and media URLs are often missing, so Claude cannot explain why a post worked. Stories, Reels and feed posts come from different reports that you have to stitch together. And there is no way to line up an Instagram Story with a spike in Shopify sales or GA4 traffic without matching timestamps across files by hand.
Conclusion
For a one-off question, export a CSV. For a quick look, Claude in Chrome will do if you are on a paid plan. For anything you will repeat, connect Instagram to Claude through Windsor.ai: it is free to start, takes a few minutes, gives Claude the full field set including Reels retention and audience data, and puts Instagram next to your ads and web analytics.
We also gave Claude and ChatGPT the same prompts on windsor.ai’s Instagram, Facebook, LinkedIn, TikTok and YouTube accounts. Claude was slower and asked for approval before each Windsor.ai data call, but it traced our Instagram and Facebook decline to paid Meta delivery that had stopped. The full comparison is in ChatGPT vs Claude for social media.
Instagram data can also go to Gemini Enterprise as a Windsor.ai data store: see how to connect Instagram to Gemini Enterprise.
🚀 Start for free at Windsor.ai and connect your Instagram account to Claude today.
FAQs
Is there a way to automate Instagram reporting in Claude?
Yes. Once Instagram is connected in Windsor.ai and the Windsor connector is added in Claude, you can ask for a weekly performance summary and Claude pulls the latest data each time, with no exports. In Claude Code you can turn the same prompt into a scheduled script.
Can Claude analyze Instagram Reels performance?
Yes. Through Windsor, Claude reads Reels fields such as media_views, media_reel_avg_watch_time, media_reel_skip_rate, media_reel_total_watch_time and media_reel_total_interactions, so you can ask which Reels hold viewers longest, which get skipped early, and what the keepers have in common.
Can Claude analyze my Instagram without a connector, using Claude in Chrome?
To a point. Claude in Chrome (part of Claude Cowork on Max and Team plans, rolling out to Pro) can read your Instagram Insights screen while the tab is open, which works for a quick audit. It only sees what you scroll to, has no per-post history to compute rates from, cannot bring in other channels, and needs a paid Claude plan. For repeat analysis, the connector is the better fit and works on the free Windsor plan.
Can Claude analyze competitor or public Instagram accounts?
Not through Instagram Insights, which covers your own Business or Creator account only. For any public account, connect the Instagram Public connector in Windsor.ai. It reads public profile and post data without a login, so Claude can compare posting frequency, engagement and content mix across accounts you do not own.
Do I need to be a developer to connect Instagram to Claude?
No. You authorize your Instagram account in the Windsor dashboard and add the connector inside Claude. No coding or API mapping is required. The developer route, Claude Code with the Instagram Graph API, exists for custom workflows but needs a Meta developer app.
Does the Instagram to Claude connection work in Claude Code?
Yes. Windsor’s connector is a remote MCP server, so you can add it to Claude Code following the setup guide and query the same Instagram fields from your terminal.
Does this setup support multiple Instagram accounts for agencies?
Yes. Connect several Instagram Professional accounts in Windsor.ai and ask Claude to compare them or roll them up into one report. The free plan covers one account; paid plans scale by accounts and sources.
What specific Instagram metrics can Claude access via Windsor?
124 fields, listed in the Instagram field reference, including:
- Post and Reel metrics: reach, views, likes, comments, saves, shares, engagement, watch time and skip rate, with captions and permalinks.
- Daily account metrics: follower change, reach, accounts engaged, profile views and link taps.
- Audience: country, city, age and gender breakdowns.
- Profile: followers, following, media count, biography and website.
How is using Windsor MCP different from just uploading an Instagram CSV?
A CSV is a snapshot that is out of date the moment you download it. The connector is a live link: every time you ask Claude a question it fetches the latest data from the API. It also carries captions, media types and permalinks that exports often miss, so Claude can explain why a post worked rather than only rank the numbers.
Can I combine Instagram data with other channels in Claude?
Yes. Windsor connects to 350+ sources. Among teams that query Instagram through Claude, the most common pairings are Meta Ads, Facebook Pages, GA4, Google Ads and TikTok, for questions like which posts drove website sessions or how organic reach behaved on days with paid boosts.
Is Windsor MCP free? What plan do I need to use it with Claude?
The Claude connector is included on every Windsor.ai plan, including the free forever plan, which covers one data source and one account. Paid plans depend on how many accounts and sources you connect; see the pricing page.
Can Claude also post to Instagram, not just analyze it?
Yes. Once the Windsor.ai Instagram connector is set up, you can ask Claude to publish a single image feed post (a JPEG with a caption) to your connected Business or Creator account. You review the image and caption before anything goes live. See the Instagram write-action walkthrough.


