Destinations
 Data sources
 AI insights
 About us
 Careers
 Security
 Customer reviews
 Contact us
 Affiliate program
 Solution partners
 Template gallery
 Looker Studio templates
 Power BI templates
 Excel templates
 Google Sheets templates
 Tableau templates
 Facebook Ads templates
 Google Ads templates
 Data fields & Metrics
 AI prompt library & Guides
 Product documentation
 API documentation
 Case studies
 Blog
Blog Data models
 Windsor vs Supermetrics
 Windsor vs Funnel.io
 Windsor vs Fivetran
 Windsor vs Rivery
 Windsor vs Portermetrics
 Windsor vs Coupler.io
 Last updated: 6 October 2026




A post can reach 2% of your followers for reasons Meta Business Suite doesn’t explain: whether the format worked, whether posting time mattered, whether one creative direction consistently outperforms another. The patterns are in your data, not in the dashboard.
Meta Business Suite shows what happened to a post, not why one got a long comment thread and another with the same reach didn’t. Claude can analyze your Facebook Page data directly and connect specific posts, formats, and timing to the engagement that followed.
Getting that data into Claude used to mean copying engagement stats by hand or working around CSV exports that drop fields. With the Windsor MCP (Model Context Protocol), your live Facebook Page metrics stream directly into Claude in under a minute.
🚀 Bridge your Facebook Page to Claude via Windsor MCP in seconds: https://onboard.windsor.ai/app/facebook_organic.
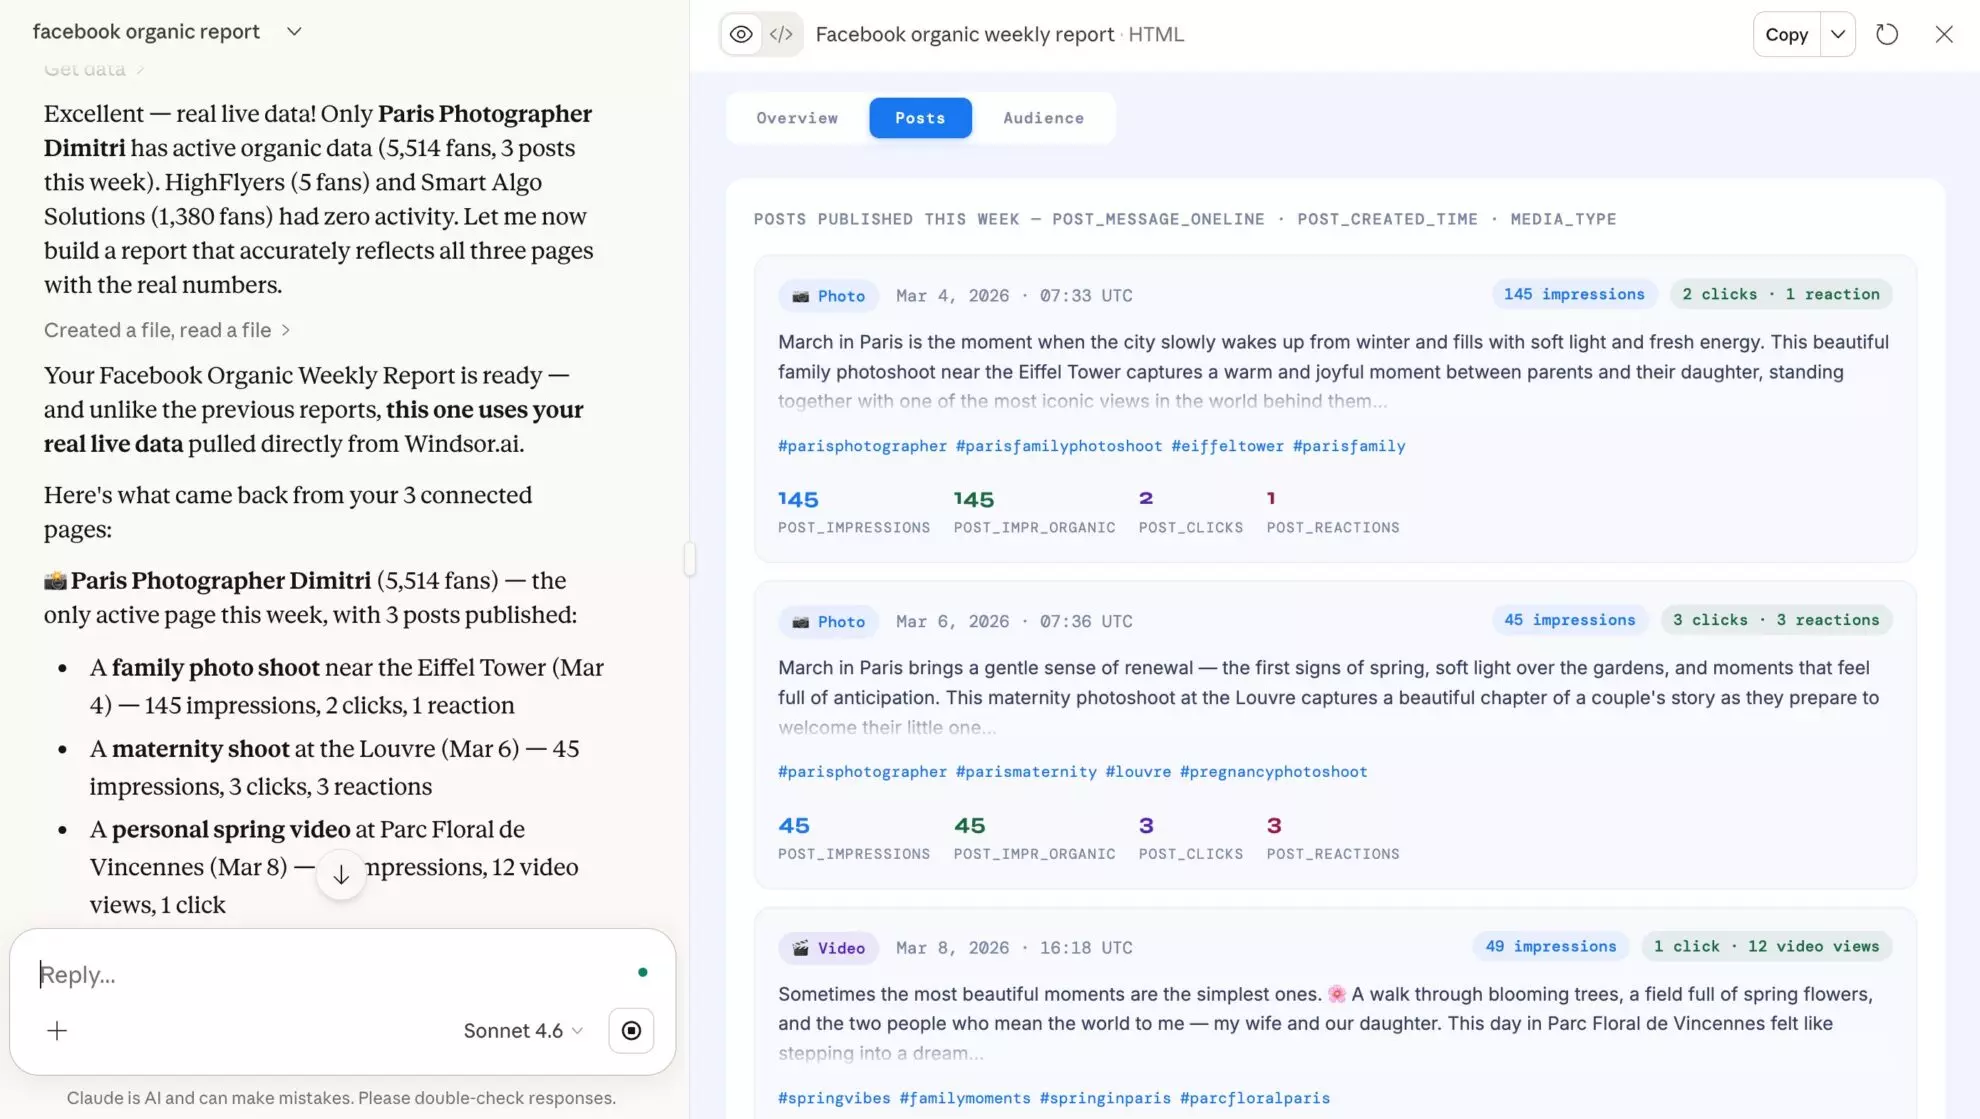
No manual entry, no stale spreadsheets, and no code. Ask questions about your Meta organic performance directly, request optimization ideas, or build visual reports like the one below. The connector isn’t read-only either: when you ask it to, it can publish a text or photo post straight to your Facebook Page.
3 steps to connect Facebook Page data to Claude via Windsor MCP
Using the Windsor MCP is a completely no-code process. Once set up, Claude acts as a live extension of your Facebook Insights analytical dashboard.
📖 Follow our quick step-by-step guide to automatically sync your Facebook Organic data to Claude.
Prerequisites
- A Windsor.ai account (Free or paid plan)
- Admin/Editor access to your Facebook Page
- A Claude.ai account
Step 1: Grant Windsor access to Facebook Organic
First, authorize Windsor to securely pull your page-level and post-level metrics:
- Log in to onboard.windsor.ai.
- Search for and select Facebook Page (Organic) as your data source.
- Authenticate and select the specific Facebook pages you wish to analyze in Claude.
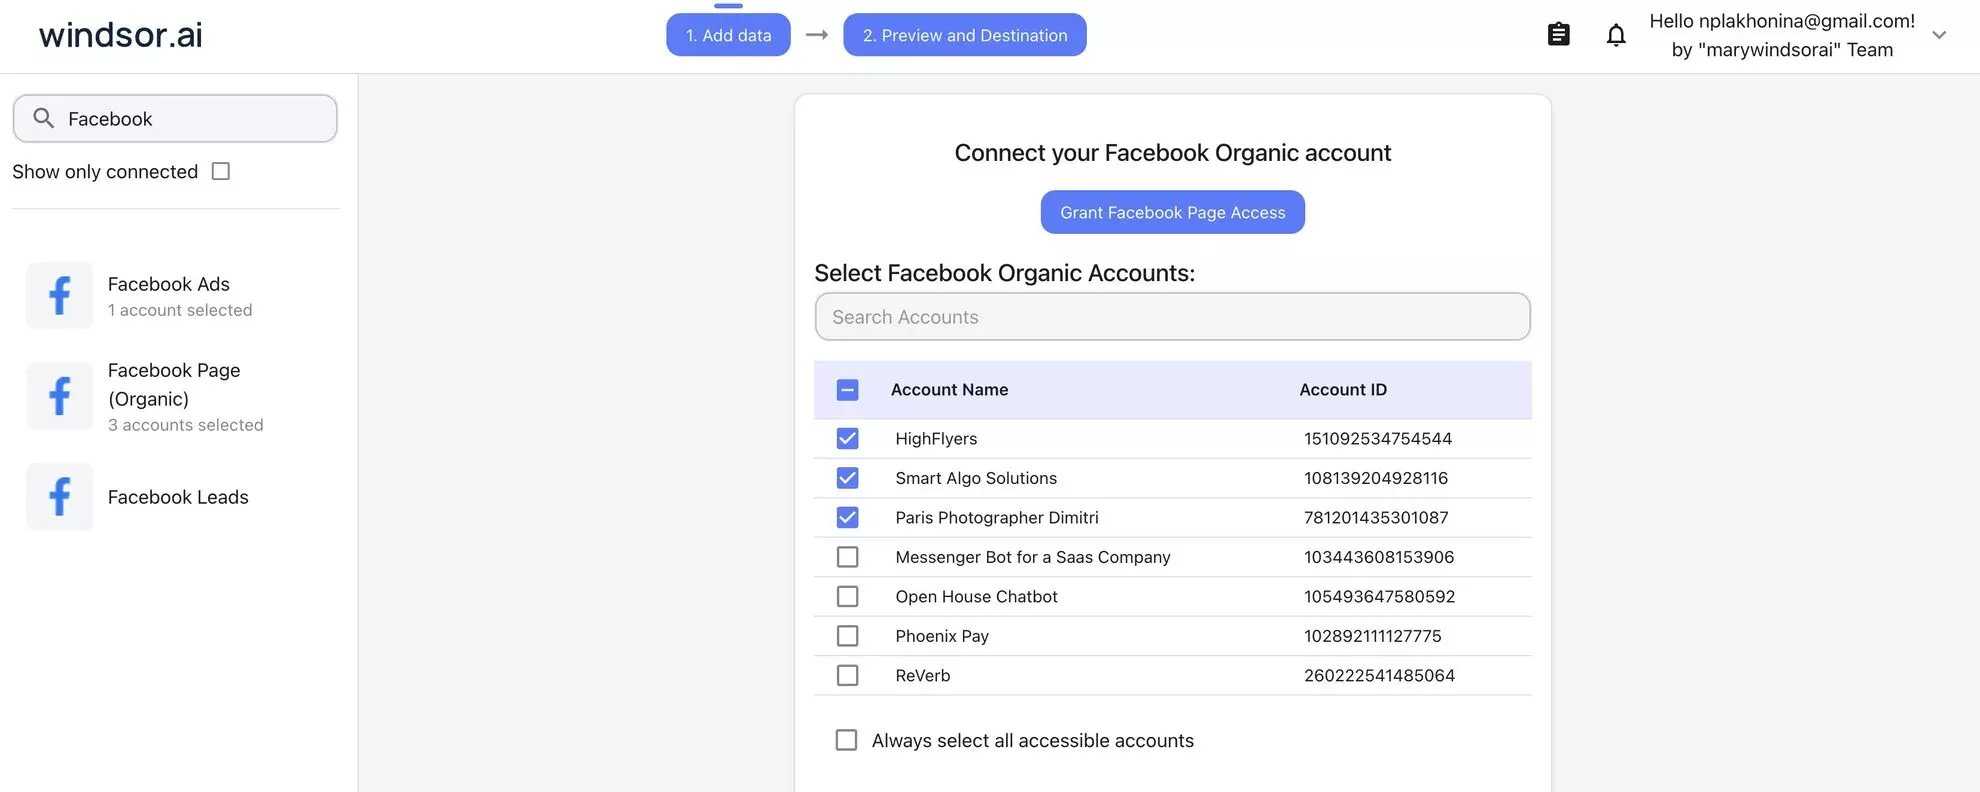
Windsor connects to the Facebook Graph API, cleaning and flattening over 315 metrics and dimensions (like page_fans, post_clicks, and blue_reels_play_count) so they are instantly readable by Claude’s reasoning engine.
💡 Pro tip: See the full picture of your Meta strategy by comparing paid and organic performance side by side. Plug Facebook Ads data into Claude alongside Facebook Organic.
Step 2: Activate the Windsor.ai connector in Claude
In Claude, open Customize, then Connectors, search for Windsor and click Add. Sign in to your Windsor.ai account when prompted. You can also open the Windsor.ai listing in Claude’s directory and click Connect.
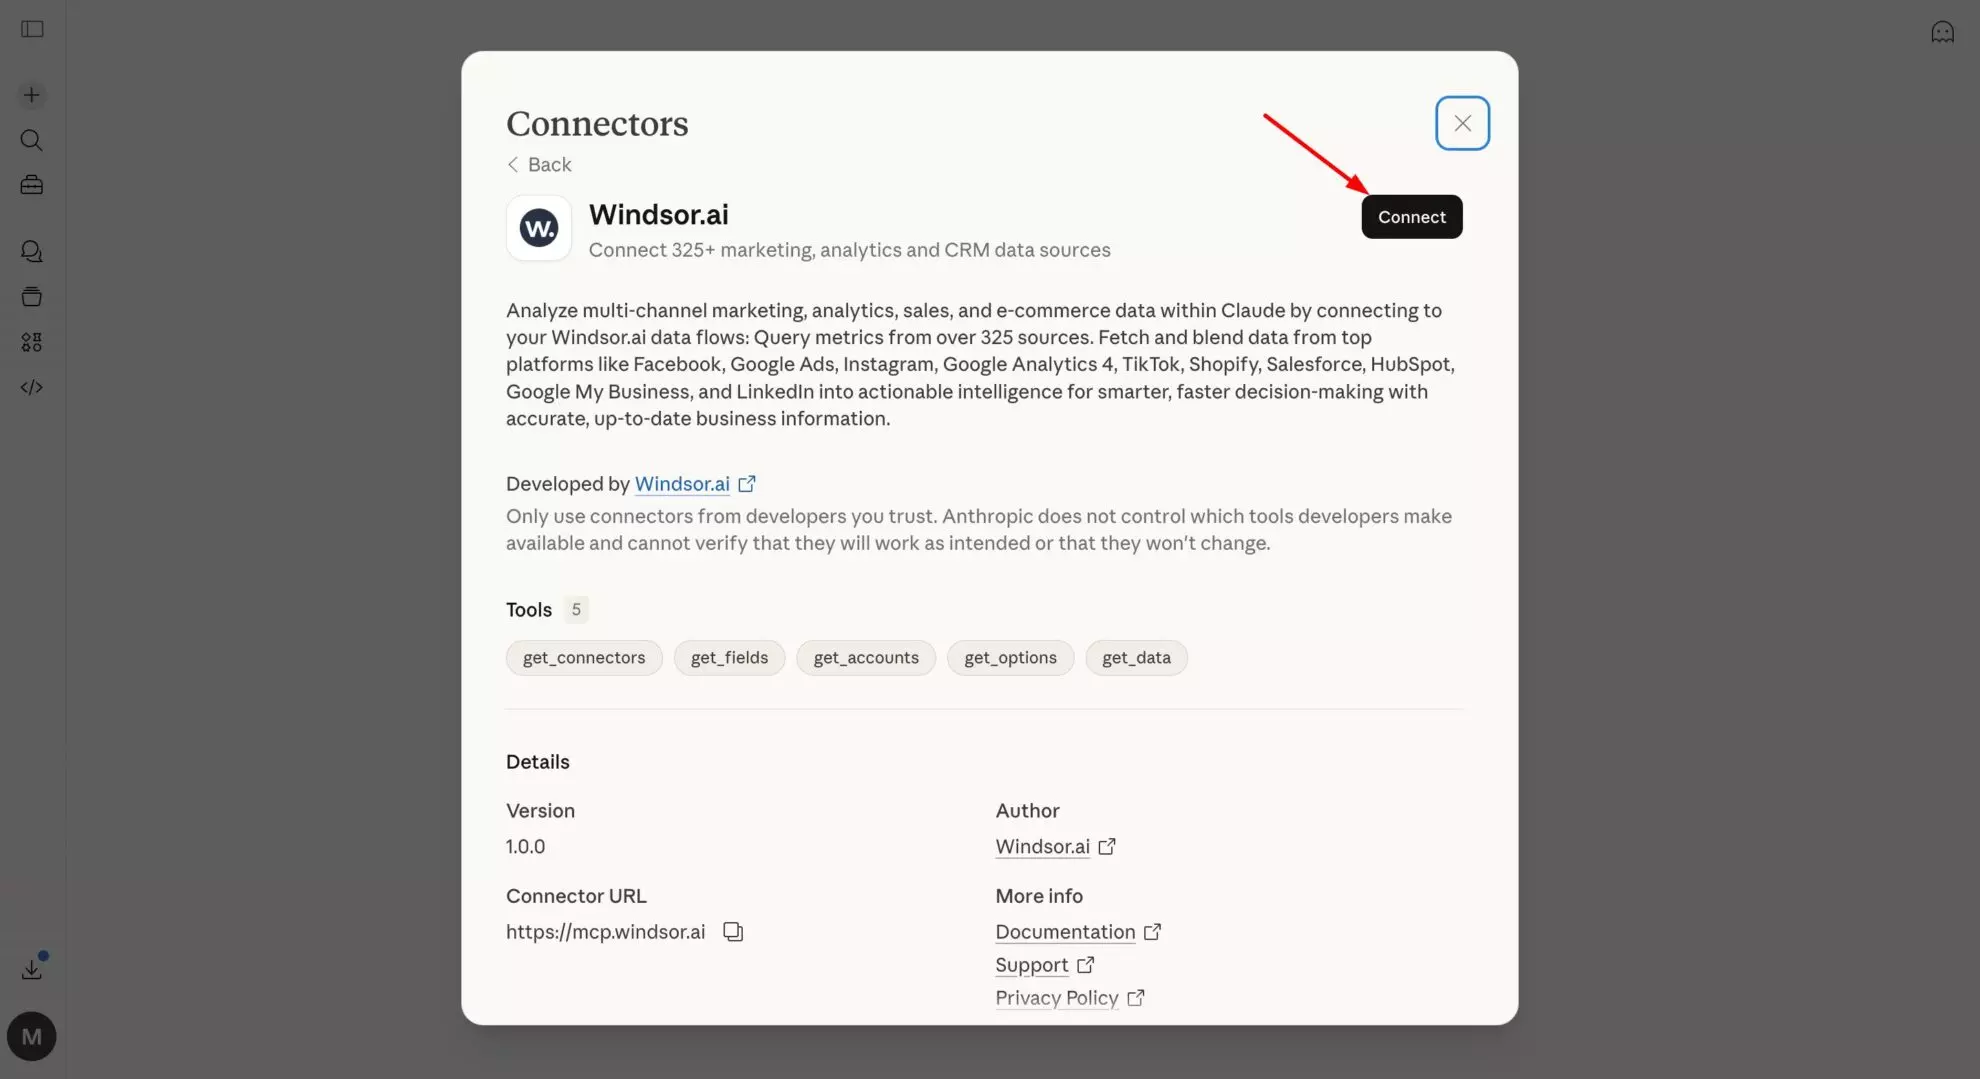
Optionally, you can set the connector permissions to “Always allow” to enable Claude to fetch real-time Facebook data across any new chat without asking for permission every time.
Step 3: Prompt your Facebook Organic data for strategic insights
Open a new chat and ask about your Facebook Page data in plain language.
Try these “quick start” Facebook prompts:
- “What was my most shared post in the last 30 days, and what was the sentiment of the top 5 comments?”
- “Compare the reach of my ‘Link’ posts vs. ‘Photo’ posts this quarter. Which drove more website clicks?”
- “Based on my ‘Fans by Hour’ data, when is the absolute best time to post a major announcement tomorrow?”
Bonus: Facebook Organic analytics prompt ideas for Claude
These prompts map to the data fields Windsor.ai supports for Facebook Organic.
Viral loop analysis
Finding which posts break out beyond your existing audience, rather than just reaching people who already follow you, usually means comparing viral and total reach post by post.
Prompt:
Analyze my 'Viral Reach' vs. 'Total Reach' for the last 14 days. Identify which specific posts triggered the highest non-follower discovery and explain why.
Video & Reel retention audit
View counts don’t show what keeps people watching or rewatching a video; that needs a look at watch time and replay rate.
Prompt:
Look at my Reels total plays. Which video has the highest replay-to-view ratio, and what does this tell me about the content hook?
Fan sentiment & loyalty check
Follower growth can look random day to day unless you compare new follows against unlikes on the same days.
Prompt:
Compare my 'New Likes' vs. 'Unlikes' for the past month. On the days I lost the most followers, what content did I post? Give me a 'Vibe Check' on my recent content strategy.
Intent & conversion mapping
High reach doesn’t mean a post drove traffic; link clicks against impressions shows which posts actually moved people toward your site.
Prompt:
List the top 10 posts by link clicks. Cross-reference this with post impressions. Which post was the most efficient at driving traffic to my site?
Engagement quality breakdown
Likes and comments measure different things; comparing reaction-heavy posts against comment-heavy ones shows which format drives real conversation versus a passive tap.
Prompt:
Compare posts with a lot of reactions vs. posts with many comments. Which content formats generate passive engagement vs. real conversation?
Content fatigue detection
A drop in engagement rate for a repeated format is easier to catch by tracking impressions and engagement rate together over time than by reviewing posts one by one.
Prompt:
Track post impressions and engagement rate over the last 30 days. Are there signs of content fatigue or declining performance for repeated formats?
Best posting time discovery
Posting time is usually a guess rather than a measured choice. Engagement rate by posting hour shows the actual window when your specific audience engages most.
Prompt:
Analyze engagement rate by posting hour. When is my audience most likely to engage, not just see my posts?
Content format winner analysis
Impressions alone don’t show which format, image, video or Reel, actually drives engagement and clicks, not just views.
Prompt:
Compare performance of images vs videos vs reels using impressions, engagement', and link clicks. Which format consistently performs best?
Evergreen vs trending content split
Some posts hold steady engagement for weeks; others spike and drop within days. Separating the two shows which content is worth repurposing.
Prompt:
Identify which posts maintain steady engagement over time vs. those that spike and drop quickly.
Content strategy diagnosis
Posting regularly doesn’t tell you which themes, formats or topics are actually earning engagement and reach.
Prompt:
Analyze my last 30 days of Facebook Organic performance. Break down what content themes, formats, and topics are driving the highest engagement and reach. Then recommend what I should post more, less, and stop entirely.
Content pillar discovery
Without a data-backed view of which themes consistently perform, a content calendar tends to feel scattered rather than built around what works.
Prompt:
Group my top-performing posts by topic/theme. Identify 3 to 5 content pillars that consistently generate the highest engagement and reach. Suggest an effective content plan for the next 20 posts based on this discovery.
Creative performance breakdown
Deciding between creative styles (educational, promotional, storytelling, behind-the-scenes) is usually a guess without a direct comparison of their engagement and reach.
Prompt:
Compare performance across different creative styles (educational, promotional, storytelling, behind-the-scenes). Which style drives the most engagement and which drives the most reach?
Social → website conversion tracking (Facebook + GA4)
Social traffic on its own doesn’t show whether it converts. Blending Facebook Organic with GA4 data shows which posts actually drove website sessions that converted.
Prompt:
Using both Facebook Organic and GA4 data, identify which Facebook posts drove the most website traffic and which of those sessions converted. Highlight posts with high reach but low conversion quality.
Paid vs organic synergy analysis (Facebook Ads + Organic)
Paid and organic are usually managed separately, which can hide where organic content is already proving out a creative direction worth boosting with ad spend.
Prompt:
Compare Facebook Ads performance with Organic post performance for the same campaigns/topics. Which content performs well organically but also boosts paid ad efficiency?
Publish directly from Claude
Once you’ve found a pattern worth acting on, you don’t have to leave the chat to post it.
Prompt:
Based on my top-performing post this month, draft a follow-up Facebook post in the same style and tone, then publish it to my Page.
🤖 For more advanced prompt ideas, browse the full Windsor AI Prompt Library.
Facebook Organic metrics you can stream into Claude with Windsor
While the standard Meta interface often aggregates data, the Windsor MCP gives Claude access to the granular level of your page performance. With over 315 Facebook Organic data fields, you can move beyond simple like counts to perform a full-scale audit of your organic strategy.
Here is a breakdown of the core data points Claude can analyze for you:
Post-level engagement (the “deep” stats)
-
Reaction breakdown: Claude doesn’t just see “Reactions.” It sees the specific count of
Love,Haha,Wow,Sorry, andAngerreactions, allowing for automated sentiment analysis. - Share & save rates: Track how many times your content was shared or saved, which are the primary signals the Facebook algorithm uses to boost organic reach.
-
Click tracking: Detailed metrics for
post_clicks_by_type_link_clicksandpost_clicks_by_type_other_clicksto see exactly how users are interacting with your posts.
Video & Reels performance
Facebook is increasingly video-first. Windsor streams the metrics that matter for retention:
-
View depth: Access
post_video_avg_time_watchedandpost_video_complete_views_organicto see where your audience is dropping off. -
Viral momentum: Track
blue_reels_play_countandpost_video_social_actions_shareto identify which Reels are breaking out beyond your existing followers. -
Captions & content: Because Windsor sends the
captionstext, Claude can correlate specific keywords or “hooks” in your video descriptions with higher watch times.
Page growth & audience health
-
Follower dynamics: Track daily
page_fansgrowth together withpage_daily_follows_uniquevs.page_daily_unfollows_uniqueto monitor audience retention.
Intent & profile activity
- Action tracking: See how many users clicked your Page’s CTA button, website link, or “Call Now” button.
- Geo-demographics: Claude can summarize your audience by top cities and countries to help you localize your posting schedule.
Four ways to get Facebook Page data into Claude
The connector route above is the one most teams use. Here is how it compares with the other three.
- Windsor.ai connector. No code. Authorize your Page once, add Windsor from the Claude directory, and Claude reads reach, engagement, video and Reels performance and audience data for every post in the chat. It can also publish a text, link or photo post to the Page when you ask. Free forever plan, no credit card.
- CSV export from Meta Business Suite. Free, but one period per file, and post, video and audience data come as separate exports you stitch together before uploading.
- Meta Graph API with Claude Code. Full control for developers, but it needs a Meta developer app, Page access tokens and ongoing maintenance.
- An automation platform. Moves single events, such as a new comment or message, to the Claude API for per-event tasks. It does not give Claude a view of the Page’s performance history.
Connector vs automation platform: two different ways to connect Facebook to Claude
“Connect Facebook to Claude” covers two different jobs, and the tools are not interchangeable.
A data connector, such as Windsor.ai, gives Claude read access to your Page Insights inside the chat: you ask a question, Claude queries the Page history through the connector and answers with the numbers, next to your Meta Ads, Instagram and web data if you connect those too. When you ask it to, the connector can also publish a post to the Page.
An automation platform (a workflow tool that links apps through triggers and actions) moves single events between Facebook and the Claude API: a new comment arrives, a workflow sends it to Claude, Claude drafts a reply, the workflow posts it. That fits per-event tasks such as reply drafting. It does not give Claude in the chat a view of how the Page performed, each new question means a new workflow, and automation platforms bill by task volume.
If the question is “how did my Page perform”, use the connector. If the job is “do something every time X happens on the Page”, use an automation platform. Both can run on the same Page.
Facebook Pages to Claude: The manual way vs. The Windsor way
| Feature | Windsor MCP (automated) | Manual CSV export |
| Data freshness | Real-time API Access | Static snapshot (outdated instantly) |
| Setup time | < 1 minute | 15+ minutes of “Download & Upload” |
| Context | Captions & comments included | Often stripped of basic exports |
| Analysis depth | Cross-channel | Siloed to one platform |
| Row limits | No UI export cap | Limited by UI export caps |
Conclusion
Connecting Facebook Pages to Claude with Windsor MCP replaces manual CSV exports with a live connection: ask a question in plain language and get an answer from current data instead of a static file.
The same connection supports reporting and, when you ask for it, publishing a post back to the Page.
🚀 Ready to talk to your Page data? Start for free at Windsor.ai and automate your Facebook Page reporting in Claude in just a minute.
FAQs
Does this setup include Facebook Ads data?
Windsor has a separate connector for Facebook Ads. However, you can connect both to the same Claude chat to compare your Paid vs. Organic ROI.
Why is the MCP approach better than uploading a CSV?
CSVs are “dead” data. MCP is a “live” bridge. With MCP, Claude can fetch the most recent data points (like a comment left 5 minutes ago) that a CSV would miss.
Can I analyze multiple Facebook Pages in Claude at once?
Yes. If you manage an agency, you can authorize multiple pages in Windsor and ask Claude to “Compare the engagement rate across all my retail clients.
Can I compare my Facebook Organic data with my Instagram data in one chat?
Yes! This is one of Windsor’s strongest features. You can ask Claude to: “Compare the engagement rate of my Facebook Reels vs. my Instagram Reels from the last 30 days and tell me which platform is better for my brand.”
Does it support Facebook Reels?
Yes. Windsor pulls dedicated Reel metrics like blue_reels_play_count and reels_share_count.
Can Claude help me write better Facebook posts?
Absolutely! By analyzing your past successful data via the connector, Claude can suggest new post copy that mimics your highest-performing historical hooks.
Is there a row limit for the data Claude can see?
The Facebook API has its own limits, but Windsor bypasses the standard 1,000-row export limit found in the Meta Business Suite UI.
Do I need to be a developer to use Windsor MCP?
No. The standard setup is 100% no-code. You simply “click to authorize” and “click to add” the connector in Claude.
Can I see who my top fans are?
Claude can analyze demographic trends (Top Cities, Countries), but Facebook API privacy rules prevent seeing individual user names.
Is the Windsor MCP free?
Yes. Windsor MCP is included on our free-forever plan, no credit card required. To connect more accounts and data sources in Claude, paid plans start at $19/month.