 AI insights
 About us
 Careers
 Security
 Customer reviews
 Contact us
 Affiliate program
 Solution partners
 Looker Studio templates
 Tableau templates
 Facebook Ads templates
 Google Ads templates
 Data fields & Metrics
 AI prompt library & Guides
 Product documentation
 API documentation
 Case studies
 Blog
Blog Data models
 Windsor vs Supermetrics
 Windsor vs Fivetran
 Windsor vs Portermetrics
 Last updated: 2 March 2026

Most marketing teams start by relying on Meta’s native reports for Facebook Ads analytics and quickly hit the same wall. There are thousands of Facebook Ads metrics, split across multiple views, with different naming and attribution logic. As a result, Facebook Ads analysis is slow, manual, and often confusing.
To keep up, teams export spreadsheets, copy KPIs into slides, and jump between multiple Facebook Ads reporting screens. This leads to delayed decisions, inconsistent Facebook Ads performance tracking, and zero cross-channel visibility.
So how do you analyze Facebook Ads data in a way that’s fast, accurate, and connected to the rest of your funnel?
The answer is through the use of Facebook Ads reporting automation tools. By sending Facebook Ads data into a central reporting environment, like Looker Studio, Power BI, or a data warehouse such as BigQuery, and automating that pipeline with Windsor.ai, you can replace manual reporting with always-up-to-date dashboards. Windsor also lets you blend Facebook Ads with 325+ other sources (Google Ads, LinkedIn Ads, HubSpot, GA4, etc.) for full-funnel, cross-channel analysis.
In this blog, we’ll walk through the main challenges of Facebook Ads analytics and the common reporting methods (manual vs automated), and explore how Windsor.ai‘s no-code connectors help teams build reliable Facebook Ads reporting without copy-paste or CSV exports.
What is Facebook Ads analytics?
Let’s start with the basics. Facebook Ads analytics is the systematic process of collecting, measuring, and interpreting performance data from Meta advertising campaigns.
It answers critical questions such as:
- What results do your ads generate?
- How do different audiences convert?
- How efficiently is the budget used?
- Which campaigns deliver the highest ROAS?
- and many others
In general, Facebook Ads analytics is used to track user behavior from impressions to conversions. It helps identify when performance shifts and which optimization actions drive better outcomes.
Facebook Ads analytics typically happens in multiple environments. You can use native Meta tools like Ads Manager and Events Manager to have basic monitoring. More advanced analytical workflows involve ETL and ELT pipelines into data warehouses and BI dashboards for deep insights and multi-platform comparisons.
When done correctly, Facebook Ads analytics transforms raw data into actionable insights that enable real-time campaign and budget optimization, accurate forecasting, and transparent reporting.
Key Facebook Ads metrics you should track
Let’s consider the most essential Facebook Ads metrics that show the performance of your campaigns.
| Metric | Definition | Why it matters |
| Impressions | Total number of times an ad is shown | Measures awareness and reach |
| Clicks | Number of user actions on an ad | Indicates initial engagement and funnel entry |
| CTR (Click-Through Rate) | Clicks ÷ impressions | Primary indicator of creative and audience relevance |
| CPC (Cost per Click) | Spend ÷ clicks | Shows the cost efficiency of generating a potential lead |
| CPM (Cost per Mille) | Spend per 1,000 impressions | Key for awareness and top-of-funnel scale |
| Conversions | Tracked outcomes such as purchases, leads, signups | Aligns advertising to business results |
| CPA (Cost per Acquisition) | Spend ÷ conversions | Evaluates the cost efficiency of achieving desired actions |
| ROAS (Return on Ad Spend) | Revenue attributed to ads ÷ spend | Measures ad campaign profitability |
| Attribution Window | Time range to credit clicks for conversions | Ensures consistent conversion logic across reports |
| Frequency | Average impressions per unique user | Helps identify and prevent ad fatigue |
| Campaign/Ad IDs | Stable identifiers for ad assets | Required for accurate joins and cross-platform reporting |
You can define a custom set of Meta Ads data fields that matter most to your reporting needs. Reuse them across dashboards and reports to maintain data accuracy.
Common Facebook Ads analytics challenges
The analysts spend 60–80% of their time preparing data instead of analyzing it. The issues below explain this trend.
- Channel silos: ad spend in Meta, revenue in CRM/e-commerce → no true ROAS without joins.
- Limited UI/breakdown history & throttling: warehousing daily extracts preserves YOY trends.
- Manual exports: CSV + Sheets don’t scale; version drift and formula errors.
- Attribution conflicts: Meta vs last-touch CRM → double counting without a consistent model.
- Taxonomy drift: inconsistent campaign names; you should use IDs + standard naming.
- Time zone and currency mismatches: you have to manually normalize them to avoid false spikes.
- API limits: you should use incremental loads, paging, and retries for data completeness.
How to analyze Facebook Ads data: the main ways
The Facebook Ads analytics process can be manual or automated. The manual approach gives you a basic understanding of your campaign performance. Automation gives you scale and reliability.
Read on to define which method suits you best.
Method 1: Using native Meta tools (manual method)
Meta Ads Manager and Ads Reporting offer quick access to direct campaign insights. Analysts can customize columns, filter by breakdowns such as age or placement, and download CSV exports for deeper review in any external analytical environment.
These native Facebook Ads reporting tools are designed to highlight performance in real-time without setting up a custom data infrastructure.
Advantages:
- No engineering work involved.
- Low-cost setup.
- Flexibility for custom transformations.
Limitations:
- Native Meta tools are quite limited when accounts and campaigns scale.
- You can’t natively join Facebook Ads with other channels, for example, Shopify revenue or HubSpot lifecycle metrics, for effective cross-platform analysis.
- Meta’s historical data retention is restricted, which makes year-to-year analysis impossible.
- Manual exports often cause version drift, data inconsistencies, and errors in reporting dashboards.
Steps to use this method:
- Open Meta Ads Manager and set the necessary date range.
- Select the required columns like spend, clicks, conversions, IDs, etc.
- Export this dataset as CSV.
- Upload the CSV file into your preferred reporting tool, e.g., Google Sheets or Excel.
- Clean the data and add the required KPI formulas.
- Create simple charts or pivot views.
- Repeat this flow whenever you need fresh data.
Summary:
With this approach, you can get a superficial view of your Facebook Ads campaign performance. However, native Meta tools do not handle complex analytical tasks such as cross-channel attribution, taxonomy governance, or timezone consistency.
Talking about the costs associated with this method, there are no software fees. The expense is human time and effort. As complexity increases, data collection slows, analysts spend hours in spreadsheets, and insights are delayed. This is often the point where teams consider working with a Facebook ads agency or investing in automation.
Best suited for:
A manual-only workflow is fine for one-off Facebook Ads audits or isolated investigations. For continuous analytics with frequent updates and large datasets, you need an automated approach.
Method 2: Spreadsheet-based automation
Spreadsheet automation layers connectors like Windsor.ai or custom API scripts on top of Google Sheets or Excel. Scheduled pulls extract Meta data directly into sheets where pivot tables and formulas drive lightweight reporting. It’s a tactical bridge between manual exports and complicated data pipelines.
Advantages:
- This workflow is useful for small teams tracking a limited number of accounts.
- Setup is inexpensive and flexible.
- Quick iterations foster faster experimentation.
- Analysts can test new KPIs without code deployments.
Limitations:
- As volume increases, spreadsheets become fragile and messy.
- Joins across campaigns, regions, and channels create complex formulas that are prone to breaking or errors.
- Version control challenges lead to mismatches in numbers across stakeholders.
- Performance slows when row counts grow.
- Security and access governance are weak.
Steps to use this method:
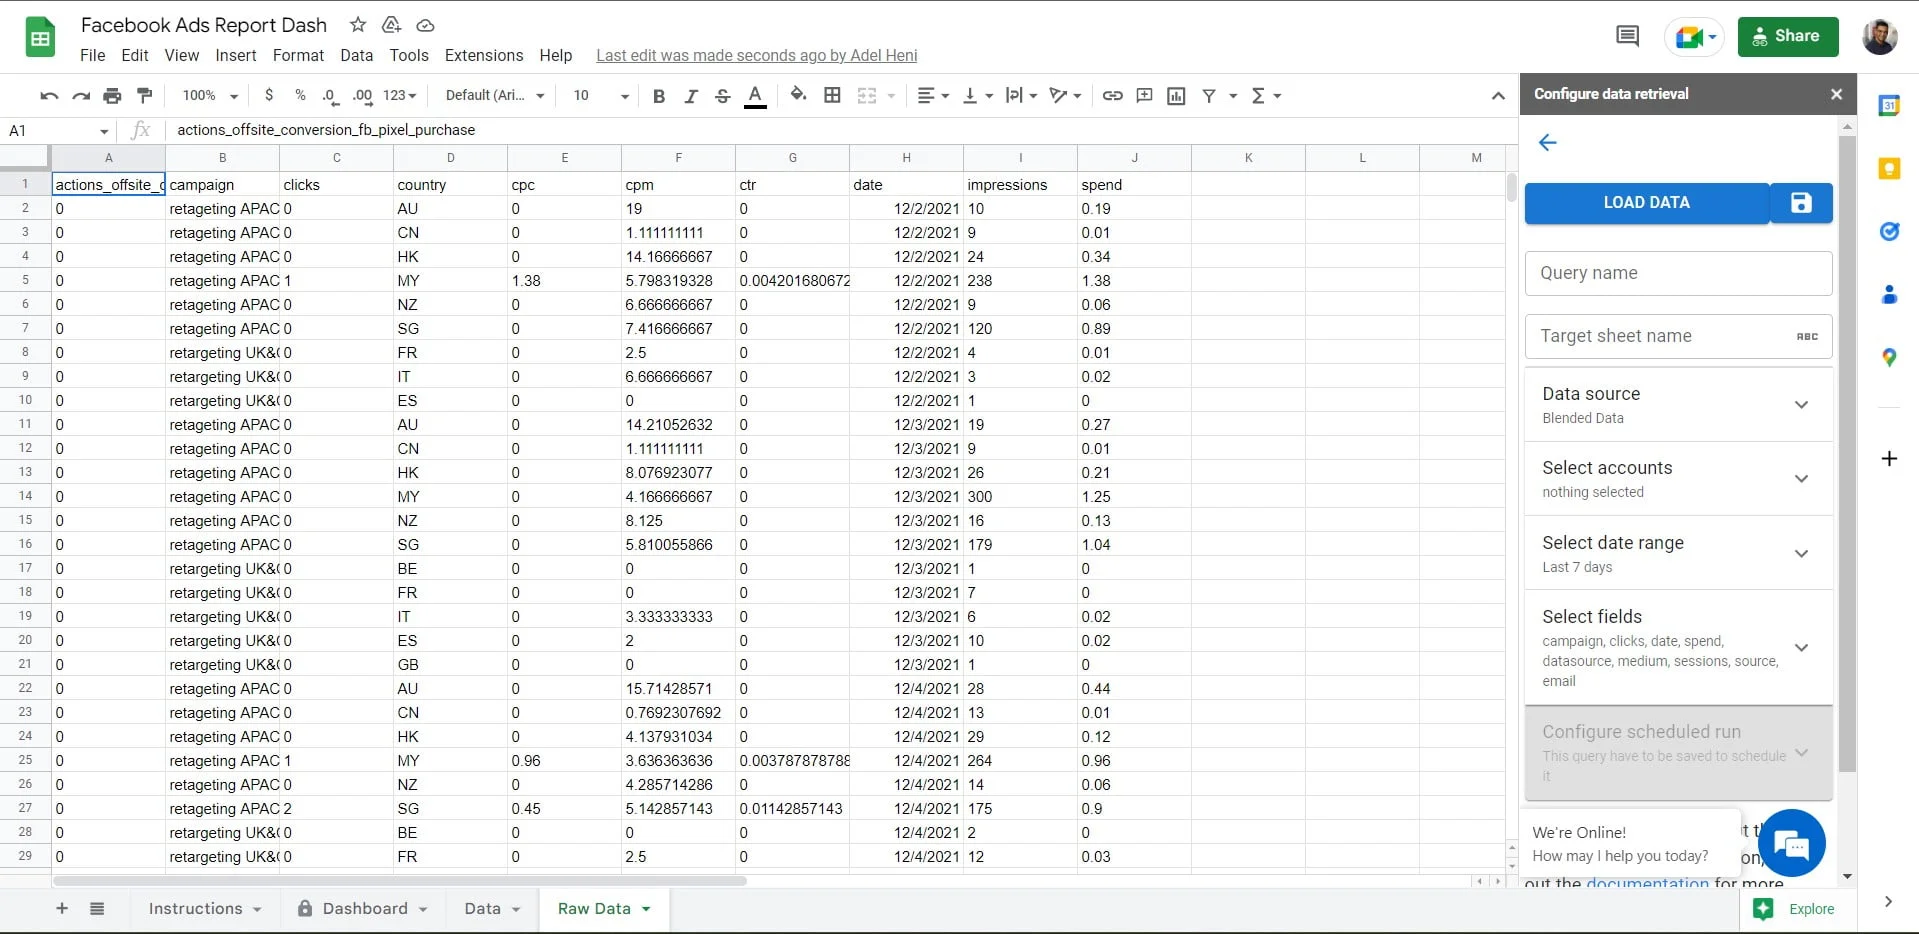
- Install the Windsor.ai extension for Google Sheets and log in (instructions).
- Pick the reporting fields and refresh frequency.
- Load the data into a sheet.
- Use pivots and charts for reporting.
- Monitor the updated data in the sheet.
Summary:
Spreadsheet automation via Windsor.ai solves silo problems because you can blend Facebook Ads data with information from other sources. However, alignment of attribution, timezone normalization, and multi-market currency scaling remains difficult. Historical storage still depends on file retention hygiene.
Costs include connector subscriptions and the risk of productivity loss when sheets fail. Maintenance overhead eventually exceeds the value for growing teams.
Best suited for:
This method helps analysts learn data shapes before migrating to structured analytics environments.
Method 3: Warehouse-first approach (recommended for scale)
A warehouse-first architecture exports raw Meta Ads Insights into a central data warehouse such as BigQuery, Snowflake, Redshift, etc. Server-side conversion data and CRM records join the same destination. Blending with offline conversions (CRM/POS) via CAPI/warehouse joins completes the funnel. SQL and dbt standardize metrics and create a shared semantic layer for BI consumption.
It creates a reliable, long-term foundation for reporting and advanced modeling.
Advantages:
- One source of truth for all business channels.
- Full historical visibility (overcome data retention limits).
- Reproducible and scalable approach.
- Ready for advanced analysis like cohorting and incrementality.
Limitations:
- Setup requires engineering resources, API governance, schemas, and transformation logic.
- Initial implementation takes longer compared to spreadsheet connectors.
- Data quality is only as strong as the models applied.
Steps to use this method:
- Set up a warehouse and a marketing schema.
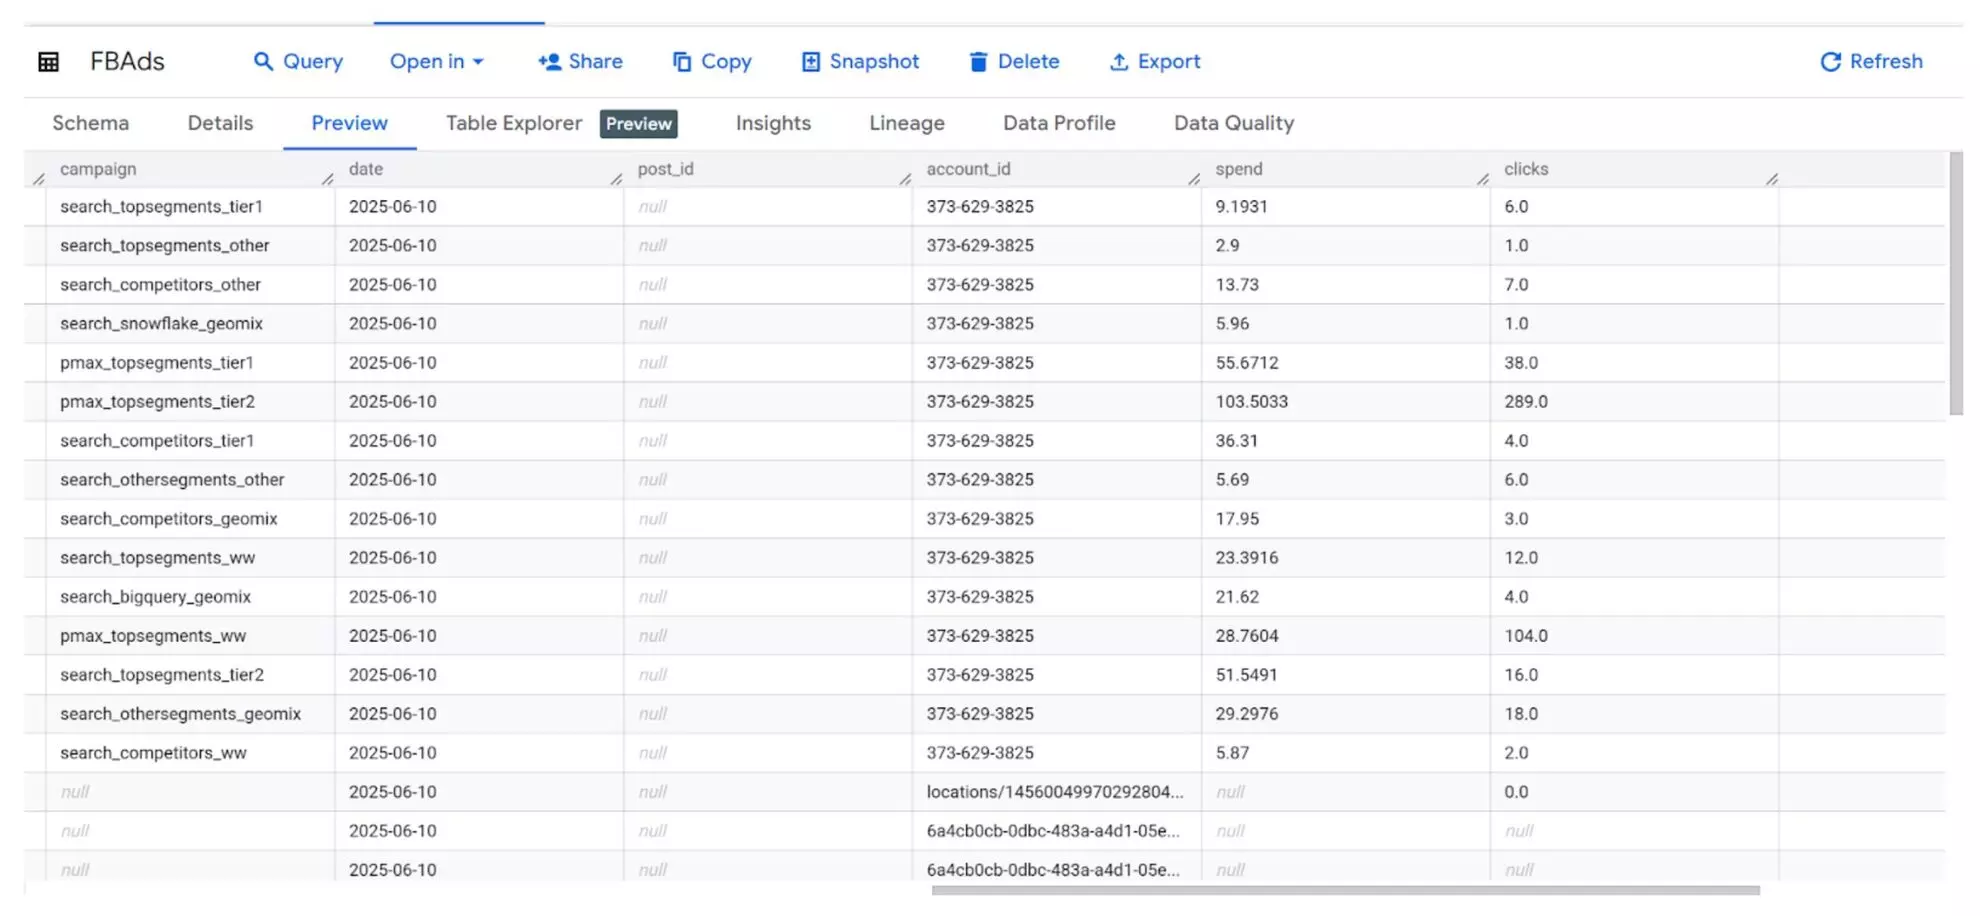
- Pull Meta Ads data daily into raw staging tables manually or using Windsor.ai.
- Transform it with SQL or dbt into clean reporting tables.
- Connect Looker Studio or Power BI for downstream analytics in dashboards.
- Monitor data quality and storage costs.
Summary:
The warehouse-first approach solves nearly every structural analytics challenge. It eliminates data silos, retains unlimited history, applies consistent attribution, normalizes campaign taxonomy, and aligns time zones and currencies globally. Data lineage is transparent and scalable.
Costs vary based on warehouse compute usage and pipeline tools. Long-term ROI is high because analysts shift from cleanup to optimization.
Best suited for:
Data-driven organizations that need scalable, trusted analytics across multiple channels.
Method 4: Using a dedicated ETL/ELT platform like Windsor.ai
Dedicated ETL/ELT platforms like Windsor.ai automate the extraction, normalization, and delivery of Meta (Facebook) Ads data to your analytics stack. They maintain schemas, run incremental syncs, and blend multiple channels for cross-channel analysis without custom code.
This approach accelerates no-code deployment: teams bypass API engineering, avoid schema drift, and can use pre-built dashboards in Looker Studio, Power BI, or Tableau. Data can also stream to spreadsheets, databases, or data warehouses. Scheduling and alerting keep reports fresh and trustworthy with minimal oversight.
Advantages of using Windsor.ai ELT tool:
- Onboarding and setup in under 5 minutes.
- Scheduled or near real-time syncs with incremental loads.
- Automatic schema and taxonomy mapping (normalized fields, unified IDs).
- Pre-built dashboards for instant reporting.
- Automated Meta Ads data stream to LLMs (ChatGPT, Claude, Gemini, etc.) for AI-driven analytics through the Windsor MCP server.
- Out-of-the-box multi-channel blending (Meta + Google Ads + GA4, etc.).
- Built-in governance & security (e.g., SOC 2, encryption, regional hosting).
- Broad connector and destination coverage (BI, sheets, DBs, DWHs) at every pricing plan.
- Built-in validation improves trust through automatic schema checks, null/duplicate detection, and source-of-truth reconciliation.
Limitations:
- Subscription cost.
- Advanced modeling/transformations may still require SQL/dbt in the warehouse.
- Connector specifics (field availability, API limits) vary by source/vendor.
- Very high row volumes can affect cost/frequency depending on the plan (especially with tools like Fivetran).
Top ELT platforms directly address major analytics challenges. They unify data sources, store historical data, harmonize attribution-friendly identifiers, and normalize currency and timezone fields. All with full automation, no code, and no engineering bottlenecks.
Steps to use this method:
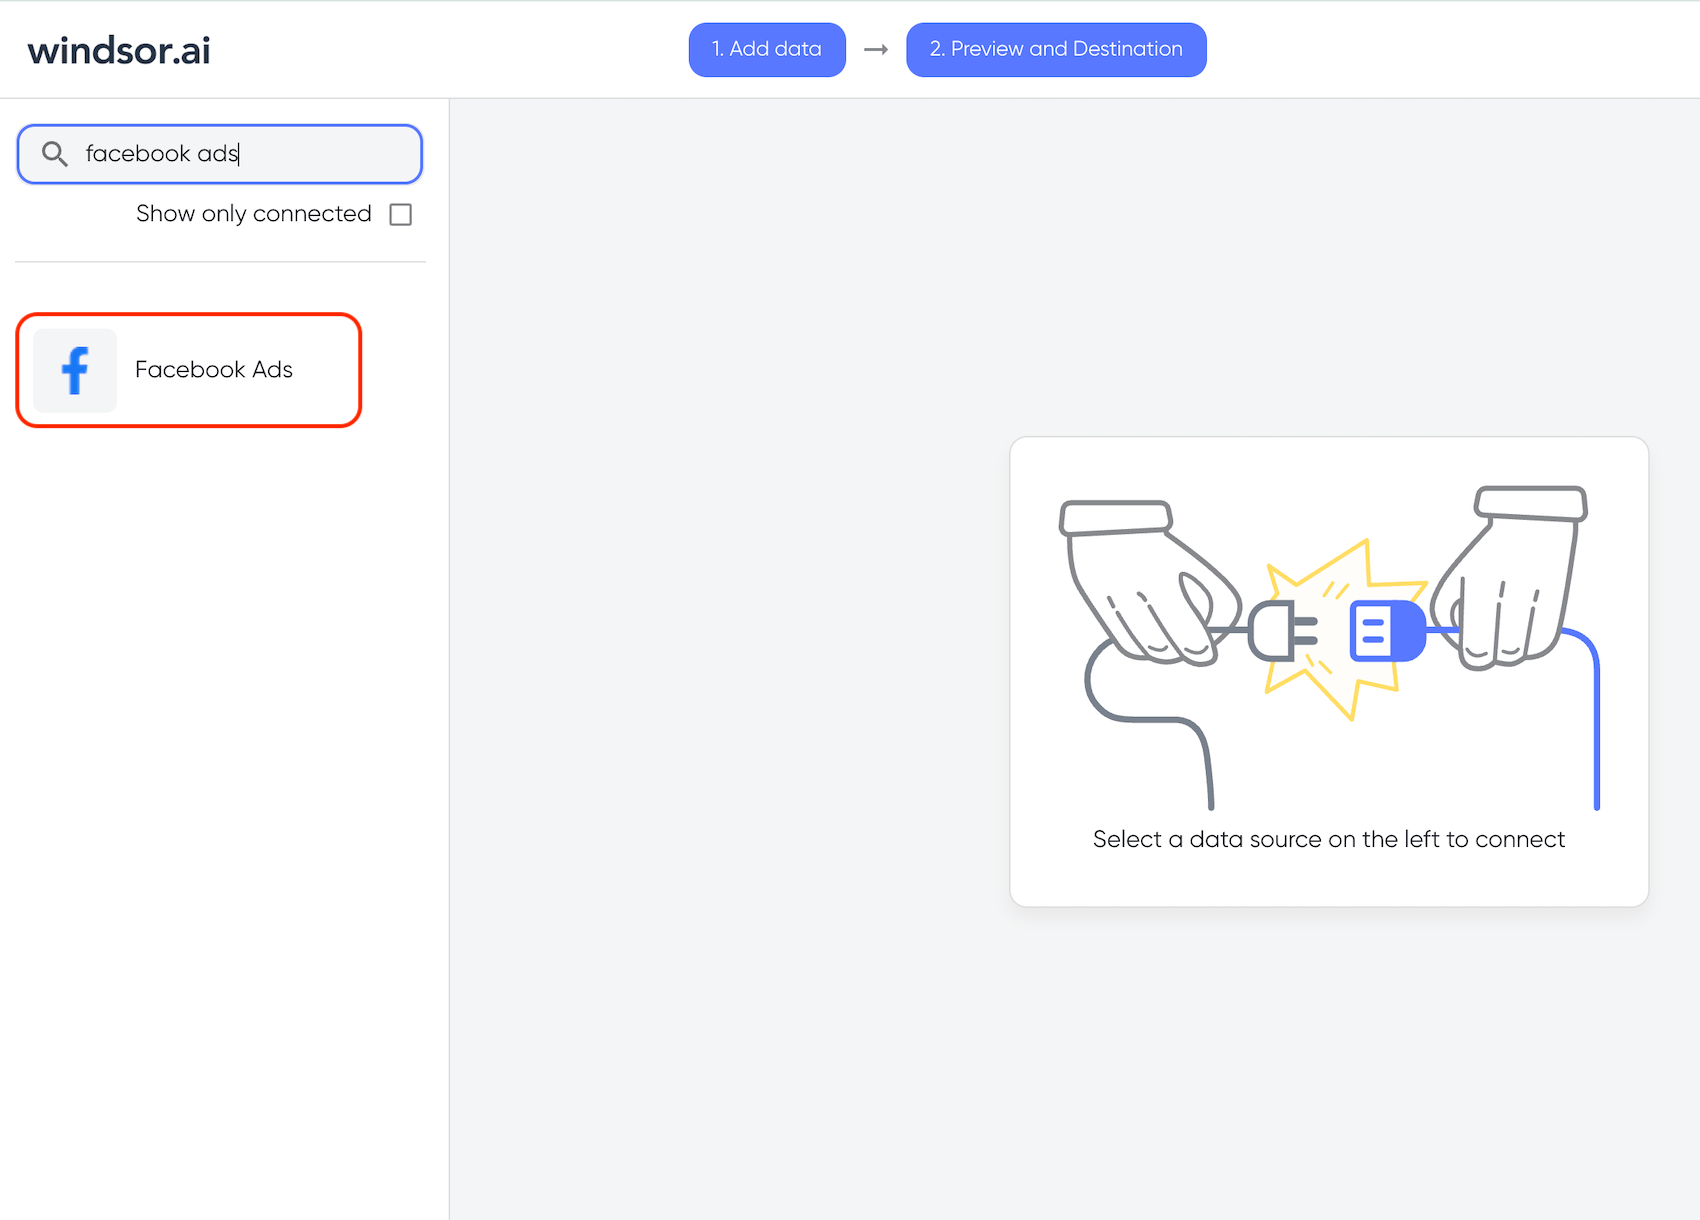
- Create an account at Windsor and connect Meta Ads through OAuth.
- Select your preferred destination warehouse or BI tool.
- Select scheduled syncs.
- Validate KPIs match your Ads Manager report data.
- Share dashboards with your team and conduct in-depth analysis.
Summary:
This method delivers end-to-end automation and flexibility for Facebook Ads analytics. Large-scale Meta datasets, optionally combined with other channels, reach your chosen tools in minutes, with no code.
Software fees apply, and some advanced logic may still live in your warehouse or BI layer, but for most teams this is faster, cheaper, and more reliable than building and maintaining custom pipelines or uploading data manually.
Best suited for:
Using automated ELT/ETL tools like Windsor is best for agencies and marketing teams managing many accounts and channels who want automated, cross-channel reporting without engineering support.
This method is also beneficial to data teams that prioritize speed and stability over custom pipelines, requiring incremental syncs, schema-drift handling, and easy outputs to BI tools, spreadsheets, and data warehouses.
The best method depends on scale and use case: use a spreadsheet upload for lightweight Facebook Ads automation, warehouses for enterprise data, and ETL/ELT tools like Windsor.ai for fully automated workflows that deliver accurate, near real-time insights across channels to any analytical environment.
Why automate Facebook Ads analytics
As you can see, automation helps transform Facebook Ads analytics from a manual routine into a reliable, scalable reporting system.
1) The first major benefit is time savings and error reduction. Automated extraction and transformation eliminate repetitive copy-and-paste tasks, which often lead to broken formulas and inconsistent KPIs. The result is higher data accuracy and less analyst fatigue. For small teams, a spreadsheet connector from Windsor.ai is a suitable option.
2) Next, near real-time tracking and scheduled refreshes become possible. Automated syncs update spend, clicks, and conversions every 15 minutes, hourly, or daily. This level of data freshness helps identify performance drops before budgets burn. For this, a warehouse-first setup through Windsor is ideal.
3) Automation also unifies ad spend and conversions across platforms. You can combine advertising data from Facebook, Google, LinkedIn, TikTok, and other channels into a single schema. This brings true multi-channel ROAS and attribution insights that manual exports can’t achieve.
4) Finally, it scales efficiently. Once pipelines are built, adding more accounts doesn’t increase reporting workload. Teams get faster decision cycles through scheduled dashboards and automated reports at any scale.
Automate Facebook Ads analytics with Windsor.ai
Windsor.ai eliminates all the complexities and restrictions of managing Facebook Ads analytics by fully automating the process:
- It connects directly to the Facebook Ads API and continuously syncs your data to the connected destination without manual exports.
- Beyond Facebook, Windsor.ai blends metrics from 325+ sources, including Google Ads, LinkedIn Ads, GA4, and more, to provide a unified, cross-platform dataset.
- This integration sends data seamlessly to BigQuery, Snowflake, Looker Studio, or Power BI, creating a single analytical environment.
- In-built schema normalization ensures every metric aligns across platforms, simplifying ROAS, CAC, and attribution modeling.
- Scheduled syncs deliver near real-time or hourly/daily updates, so your Facebook automated reports always reflect the latest spend and conversion metrics.
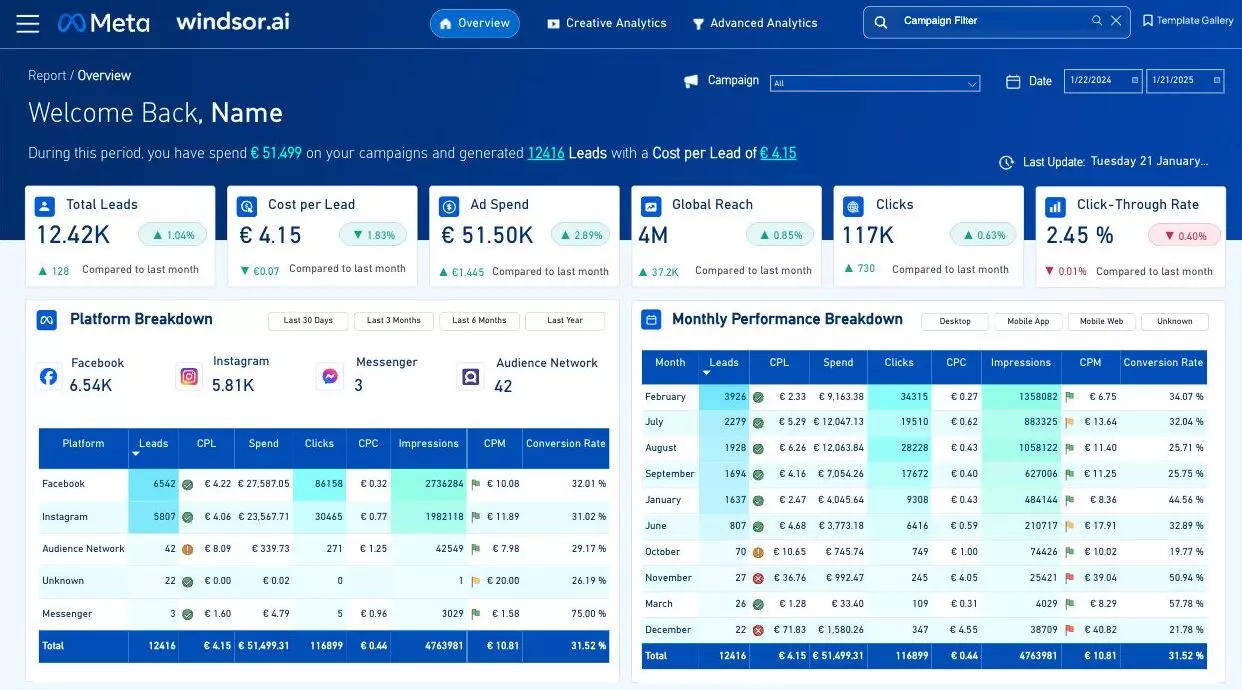
- For instant FB Ads automation, Windsor.ai also offers pre-built Facebook Ads dashboards, enabling analysts to start tracking performance within minutes.
The result is a complete, automated Facebook advertising reporting pipeline that reduces manual work, eliminates data silos, and accelerates data-driven decision-making across teams.
Key Facebook Ads metrics you can track with Windsor.ai
The key Facebook Ads metrics you can track with Windsor.ai cover spend, performance, conversions, identification, and hundreds more.
Here’s a breakdown of the KPIs and their corresponding data fields:
| KPI category | Key Performance Indicator (KPI) | Corresponding Windsor.ai data fields (example) | Type | Description |
| Spend | Spend | amount_spent | NUMERIC | Current amount spent by the account. |
| account_balance | NUMERIC | Bill amount due for this Ad Account. | ||
| Performance | CPC / CPM | CPC (Cost Per Click) is generally a calculated metric (spend/clicks), but the predefined field includes: cpc | NUMERIC | The number of clicks on your ads. The number of times your ads were on-screen. |
| CTR | CTR (Click-Through Rate) is generally a calculated metric (clicks/impressions), but the predefined field includes: ctr | NUMERIC | The number of clicks on your ads. The number of times your ads were on-screen. | |
| Impressions | impressions | NUMERIC | The number of times your ads were on-screen. | |
| Conversions | Conversions | A wide range of specific conversion actions: actions_purchase actions_lead actions_complete_registration actions_add_to_cart | NUMERIC | The number of purchases, leads, registrations, adds to cart, etc., attributed to your ads. |
| ROAS | ROAS (Return On Ad Spend) is generally a calculated metric (action_values_purchase/spend), but the related fields include action values: action_values_purchase, action_values_total | NUMERIC | The total value of purchase conversions. Total values of actions. | |
| Identification | Campaign ID / Ad ID | campaign_id | TEXT | The unique ID of the campaign, ad, and ad set. |
| Attribution Data | attribution_window (available option) | SELECT_MULTI | Defines the attribution window for actions (e.g., 28d_click, 7d_view). |
The Facebook Ads connector by Windsor.ai provides a wealth of Meta data, pulling from Facebook and Instagram Ads at the campaign, ad set, ad, and creative levels.
- Metrics: The connector supports 500+ metrics.
- Dimensions: It also supports 145+ dimensions.
Check out all dimensions and metrics here.
Key dimensions for grouping and context
Dimensions are crucial for segmenting your KPIs. Important ones available include:
- Time: date, ad_created_time, adset_start_time, etc.
- Account/campaign structure: account_id, campaign_name, adset_name, ad_name.
- User/demographics: age, gender, country.
- Creative: ad_object_type, body, image_asset.
Attribution Window option
A critical option for conversion tracking is the Attribution Window, which determines how far back a view or click is considered to have influenced a conversion. The available options include:
- 1d_view, 7d_view, 28d_view (for post-view attribution)
- 1d_click, 7d_click, 28d_click (for post-click attribution)
How to set up Facebook Ads analytics with Windsor.ai: integration steps
Setting up Facebook Ads analytics with Windsor.ai takes only a few minutes and eliminates the manual integration hassle.
Step 1: Connect data sources
After creating a Windsor.ai account, connect your Facebook Ads account through a secure OAuth connection. You can also add other platforms such as Google Ads, LinkedIn Ads, or GA4 for full cross-channel visibility.
Step 2: Select metrics and settings
Choose the reporting date range and Facebook Ads fields you want to track, such as spend, impressions, CTR, conversions, ROAS, and more.
Use the preview option to validate your data before loading. Windsor automatically handles schema mapping, so you don’t need to adjust column names or data types manually.

Step 3: Choose your destination
Send your Facebook Ads or blended data to Looker Studio, Power BI, BigQuery, Snowflake, or any other destination. This flexibility lets teams visualize and query data in their preferred analytical environment.

Step 4: View and customize reports
Once synced, open your Facebook Ads dashboard to monitor campaign performance. To get started faster, you can use these ready-made templates:

Conclusion
Facebook Ads analytics has shifted from spreadsheet exports to automated, end-to-end pipelines. Manual reporting can surface basics, but it’s slow, error-prone, and can’t keep up with daily optimization, especially when true insights require joining ad metrics with revenue, CRM, and other channels.
Windsor.ai automates the entire flow: it connects the APIs, normalizes schemas, preserves history, blends hundreds of sources, and syncs clean data to your warehouse or dashboards in near real-time. The result is faster, more accurate decision-making, so teams spend less time wrangling data and more time forecasting and scaling what works.
🚀 If you’re ready to replace manual exports with trustworthy, cross-channel insights, automate Facebook Ads reporting with Windsor.ai. Start your free trial, connect your Meta account, and turn raw ad data into actionable intelligence in minutes!
FAQs
What is Facebook Ads analytics?
It’s the process of collecting, modeling, and interpreting Meta (Facebook/Instagram) ad data, from impressions to conversions, to optimize spend, creative, and audiences.
Which Facebook Ads metrics matter most?
Start with impressions, clicks, CTR, CPC/CPM, conversions, CPA, ROAS, frequency, and stable IDs (account/campaign/adset/ad). Add revenue, lead quality, and LTV when available.
How does Windsor.ai automate Facebook Ads analytics?
It securely connects via Facebook’s API, extracts and normalizes data, then syncs it to BI tools or data warehouses automatically with scheduled refreshes. All with no code.
Can I still use Meta Ads Manager with Windsor.ai?
Yes, you’ll still manage campaigns there. Windsor.ai only automates data collection, reporting, and dashboard updates, helping you unlock deeper insights.
How does Windsor.ai improve attribution accuracy?
It unifies campaign identifiers, normalizes time zones, and merges cross-channel data for consistent, accurate ROAS and conversion tracking.
When is Meta Ads manual reporting acceptable?
For one-off tasks: quick audits, isolated checks, or small accounts. For continuous analytics with frequent updates or many accounts, move to automated pipelines.
What are the costs of Facebook Ads automation?
Costs vary by tool and data volume, but automation typically saves more time and resources than manual reporting. For example, Facebook Ads automation with Windsor.ai is available from just $19/month or even at a Forever Free plan for 1 data source and 1 account.
Are spreadsheets viable for ongoing reporting?
They work for lightweight cases, but become fragile at scale (joins, large row counts, version drift). Use them as a bridge, not the long-term system of record.
Why use a warehouse-first approach for Facebook Ads analytics?
It centralizes all channels, preserves history, enforces consistent taxonomy, and supports advanced modeling (SQL/dbt) and cross-channel attribution. The DWH approach is the most robust for scale.
What does an ETL/ELT platform (like Windsor.ai) automate?
As a top ELT/ETL tool, Windsor automates data extraction, normalization, schema mapping, incremental syncs, and delivery to BI tools, spreadsheets, databases, and warehouses, plus multi-channel blending and drift detection.
What method for Facebook Ads analysis should I choose?
How does Windsor.ai help with Facebook Ads data validation and quality?
Windsor.ai provides normalized schemas, incremental syncs, schema-drift detection, and the ability to create calculated fields. You can implement null/type/duplicate checks and reconcile KPIs against Ads Manager while streaming to Looker Studio, Power BI, Sheets, BigQuery, Snowflake, etc.
How far back can I analyze Facebook Ads history?
UI exports and some breakdowns have limited lookbacks and throttling. Store daily snapshots in a warehouse (BigQuery/Snowflake/another) to preserve full history for YoY and cohorting.
How do I validate that my Facebook Ads numbers match Ads Manager?
Run a daily reconciliation: compare aggregated spend, clicks, impressions, and conversions in your dashboard/warehouse to Ads Manager totals for the same date range, time zone, and attribution window. Flag variances beyond a small tolerance (e.g., ±1–2%) and investigate extract windows, filters, and attribution settings.

