 Destinations
 Data sources
 AI insights
 About us
 Careers
 Security
 Customer reviews
 Contact us
 Affiliate program
 Solution partners
 Template gallery
 Looker Studio templates
 Power BI templates
 Excel templates
 Google Sheets templates
 Tableau templates
 Facebook Ads templates
 Google Ads templates
 Data fields & Metrics
 AI prompt library & Guides
 Product documentation
 API documentation
 Case studies
 Blog
Blog Data models
 Windsor vs Supermetrics
 Windsor vs Funnel.io
 Windsor vs Fivetran
 Windsor vs Rivery
 Windsor vs Portermetrics
 Windsor vs Coupler.io
Connect Google Search Console to Excel
Load Search Console data into Excel with one URL: Windsor.ai builds it from the fields you pick, and Excel’s Data, From Web reads it as a table. Clicks, impressions, CTR and average position by date, query, page, country and device, past the 1,000 rows the Performance report shows.
Refresh the table from Excel whenever you need the latest days. No add-in is needed.
 Sign up with Google
 Free forever plan
No credit card needed
Free forever plan
No credit card needed










What to do with Search Console data in Excel
A few uses that need more than the Performance report’s 1,000 rows:

Follow queries day by day
Insert a pivot table with date in columns and query in rows to see when a query gained or lost clicks.

Split branded and non-branded search
Add a column that tests whether the query contains your brand name, then compare clicks and CTR for both groups in a pivot table.

Find pages that compete for one query
Count the pages per query. Several pages with impressions for the same query can split its clicks.
Limits to plan for
Size. An Excel worksheet holds 1,048,576 rows. Three days of date, query and page rows for windsor.ai came to 46,297 rows; at that rate a month would be about 460,000 rows, under the limit, though we did not load a full month. A large site may need fewer fields or a shorter range.
Refresh. The table refreshes when you choose Data, Refresh All. In the query’s properties you can also refresh when the file opens, or every set number of minutes while it is open.
Freshness. Search Console publishes the newest days with a delay. On 4 October 2026 the latest day available was 29 September.
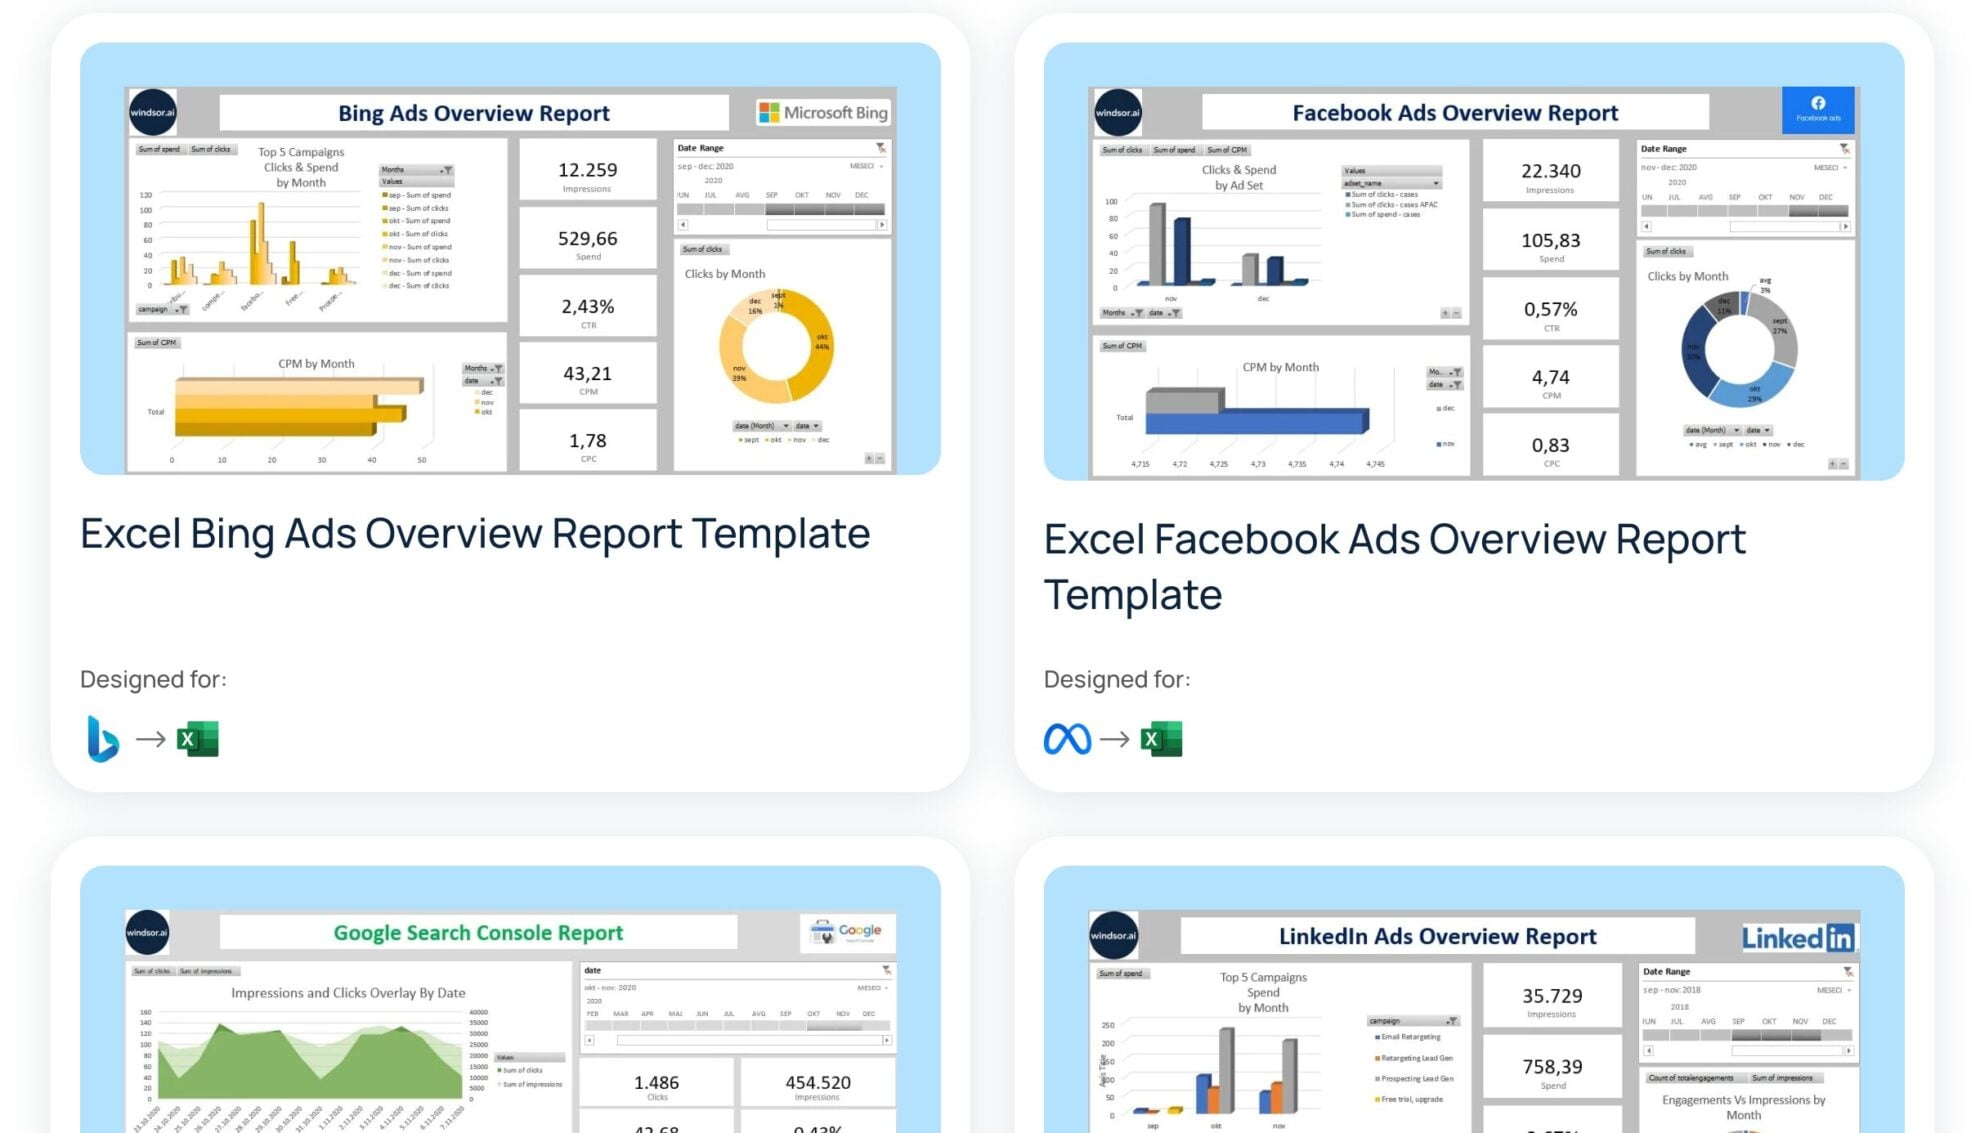














How to connect Google Search Console to Excel
You need:
- Access to a Search Console property
- A Windsor.ai account (free forever plan, no credit card)
- Excel with Data, From Web (we tested Excel for Microsoft 365 on Windows)
Connect Search Console to Windsor.ai
Sign in at onboard.windsor.ai, choose Google Search Console and select your property. Domain properties appear as sc-domain:example.com and include every subdomain.

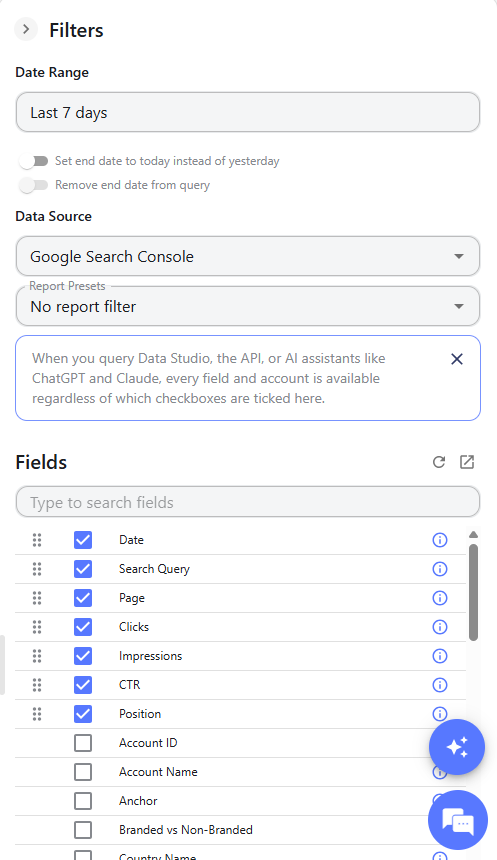
Set the data source and fields in the right-side panel
On the Preview and Destination page, use the panel on the right. Set Data Source to Google Search Console: choosing Search Console in the first step does not change this setting. Then set the date range and tick the fields you want under Fields.
Do not click the Get data button in the middle of the page. The URL for Excel comes from the destinations list in the next step.
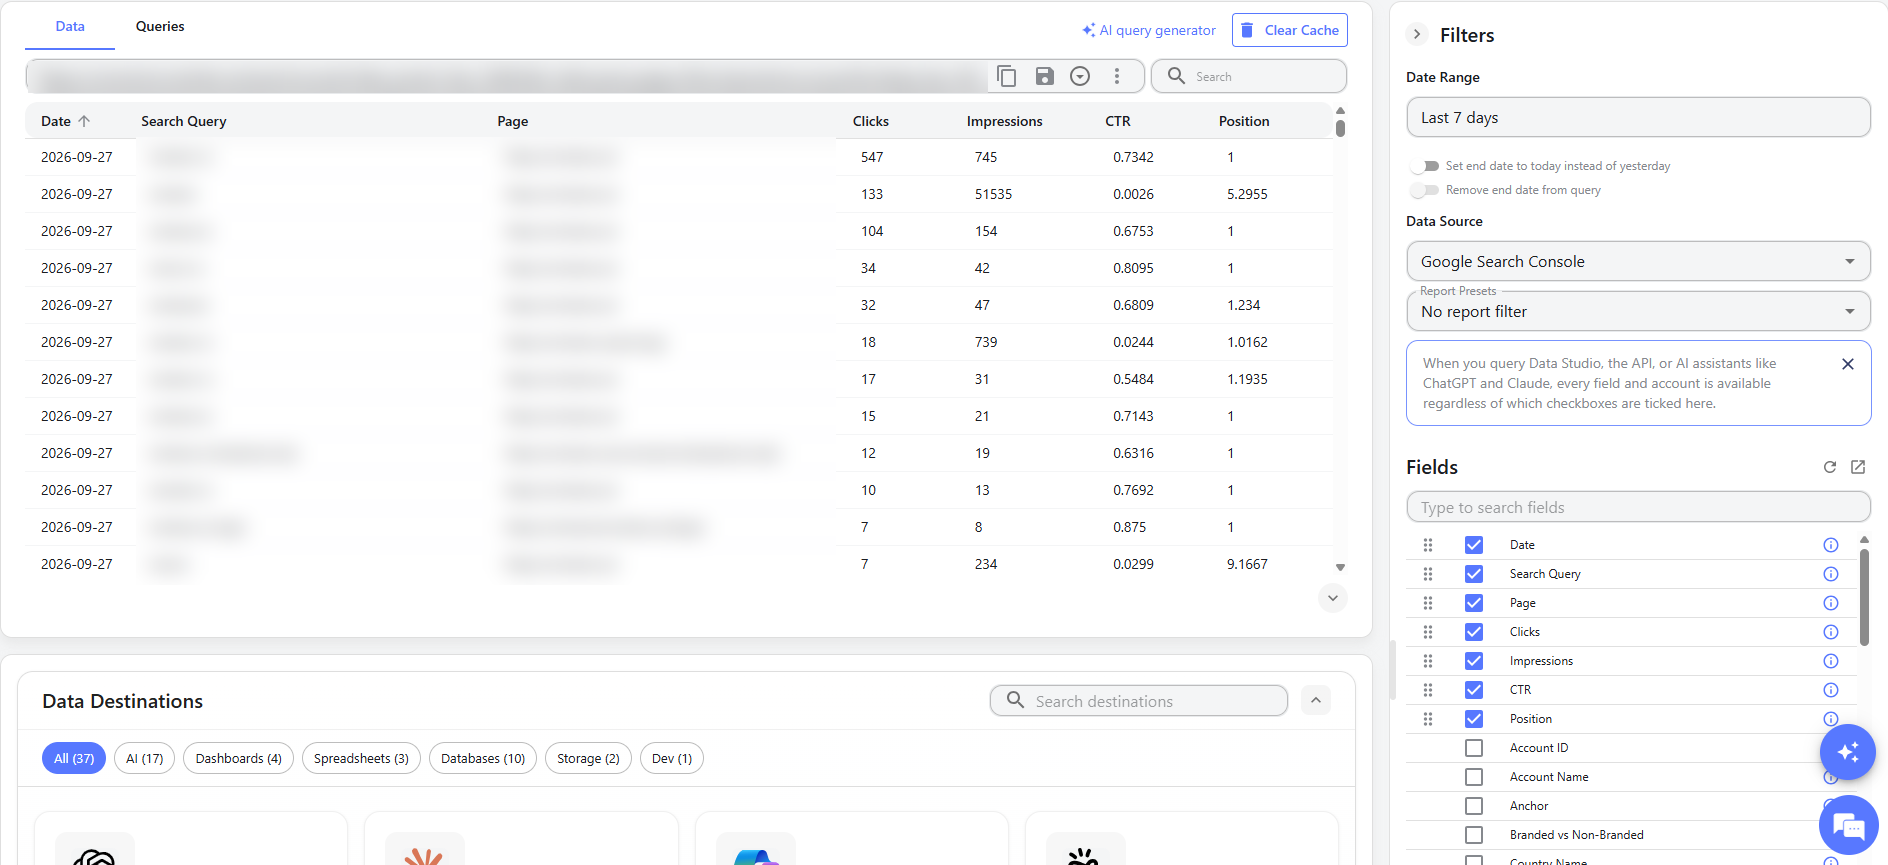
Copy the Excel URL
Under Data Destinations, choose Excel and copy the URL from the instructions. Check that it starts with https://connectors.windsor.ai/searchconsole? and lists only your fields. If it starts with /all and includes fields such as campaign or spend, the data source in the right-side panel is not set to Search Console.
The URL contains your API key. Keep it private.
Load the URL in Excel
In Excel, choose Data, From Web, paste the URL and click OK. In the Access Web content window, choose Anonymous, keep https://connectors.windsor.ai/ as the level to apply the setting to, and click Connect. The Navigator shows the data as a CSV preview. Click Load.
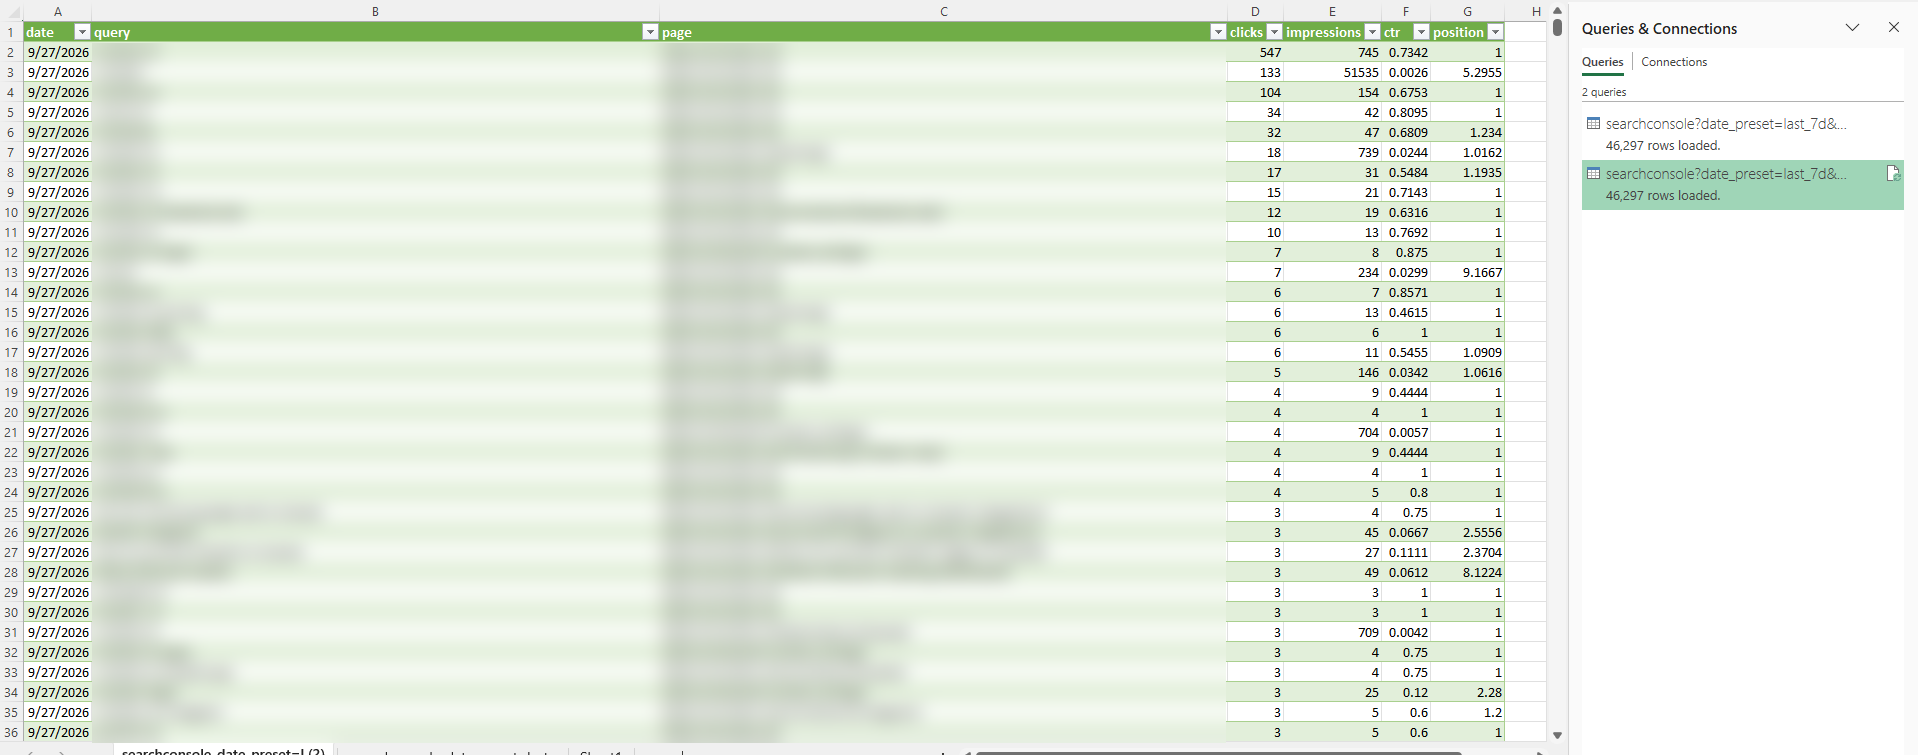
What lands in Excel
The URL returns one row per combination of the fields you pick. These are the Search Console fields we used in our test:
| Field | What it contains |
|---|---|
| date | The day of the search |
| query | The search query, for queries Google reports |
| page | The full URL that appeared in the results |
| clicks, impressions, ctr | Clicks, impressions and click-through rate (as a ratio, for example 0.0244) |
| position | Average position |
Country, device, search type and sitemap fields are also available; the Search Console field reference lists them all.
Our test on windsor.ai
On 4 October 2026 we loaded windsor.ai’s own Search Console property into Excel for Windows with the last 7 days preset. Excel loaded 46,297 rows in 5 to 6 seconds. Dates arrived as dates and the five metrics as numbers. The table had these totals by day:
| Date | Clicks | Impressions |
|---|---|---|
| 27 Sep 2026 | 1,323 | 123,271 |
| 28 Sep 2026 | 2,341 | 143,811 |
| 29 Sep 2026 | 2,370 | 156,894 |
The preset returned three days, not seven, because 29 September was the latest day in Search Console itself on 4 October. The totals cover rows that carry a query; Google does not report rare queries, so the Performance report’s totals are higher.

Above: the loaded table, with the query and page columns blurred.
FAQs
Is the Search Console to Excel connection free?
Yes, on the free forever plan, which covers one data source with no credit card. Paid plans start at $19 a month for more sources; see pricing.
Does the Excel table refresh automatically?
No, not by default. Choose Data, Refresh All, or open the query’s properties and set it to refresh when the file opens or every set number of minutes. Each refresh loads the data again from Windsor.ai.
Why does my table show campaign, sessions or spend columns?
The URL was created with the data source set to all sources, so it starts with /all and carries a default set of fields. In the right-side panel on the Preview and Destination page, set Data Source to Google Search Console, tick your fields, and copy the Excel URL again. It should start with /searchconsole.
Why does the last 7 days preset return fewer days?
Search Console publishes the newest days with a delay, and the preset returns only the days that exist. On 4 October 2026 the latest day in Search Console was 29 September, so the preset returned 27 to 29 September.
Why are my totals lower than in Search Console?
Google does not report rare queries, so a table that includes the query field has fewer clicks than the site total. A table by date or country without the query field comes closer to the Performance report.
Should I use Excel or Google Sheets?
Use Excel if your reports already live there; the URL needs no add-in. For a shared, scheduled sheet, the Search Console to Google Sheets connection uses an add-on with a refresh schedule, and there is a free Sheets dashboard template.
Where is the documentation for Excel?
The documentation explains how to integrate data into Excel with Windsor.ai, including Excel templates.
Load your Search Console data into Excel. Try Windsor.ai free


