 Destinations
 Data sources
 AI insights
 About us
 Careers
 Security
 Customer reviews
 Contact us
 Affiliate program
 Solution partners
 Template gallery
 Looker Studio templates
 Power BI templates
 Excel templates
 Google Sheets templates
 Tableau templates
 Facebook Ads templates
 Google Ads templates
 Data fields & Metrics
 AI prompt library & Guides
 Product documentation
 API documentation
 Case studies
 Blog
Blog Data models
 Windsor vs Supermetrics
 Windsor vs Funnel.io
 Windsor vs Fivetran
 Windsor vs Rivery
 Windsor vs Portermetrics
 Windsor vs Coupler.io
Connect Google Search Console to Tableau
Get Search Console clicks, impressions, CTR and average position by date, query, page and device into Tableau, past the 1,000 rows the Performance report shows. Windsor.ai fills a Google Sheet that Tableau reads, or gives you a CSV file to open in Tableau.
We tested both routes in Tableau Public with windsor.ai’s own data, including one row limit to check for.
 Sign up with Google
 Free forever plan
No credit card needed
Free forever plan
No credit card needed










What to build in Tableau with Search Console data
A few views that need more than the Performance report’s 1,000 rows:

Clicks by day and device
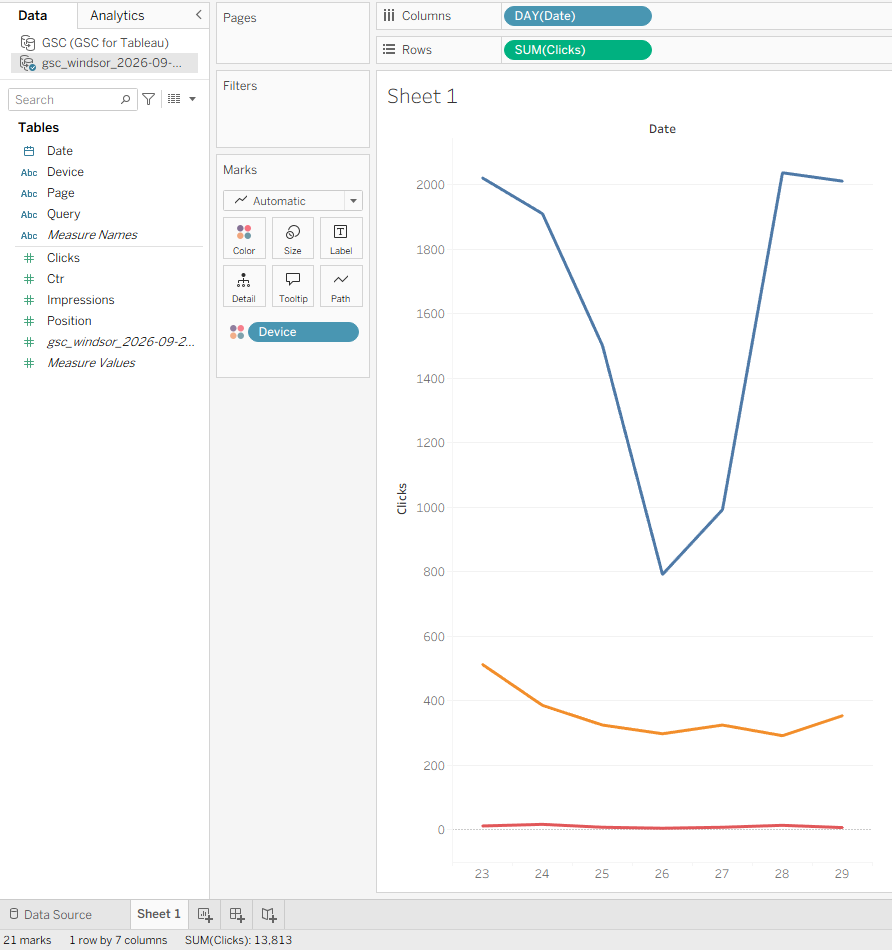
Put a continuous Day of date on Columns, SUM(Clicks) on Rows and device on Color to see which device a change came from.

Branded and non-branded search
Create a calculated field with CONTAINS(LOWER([Query]), "yourbrand") and use it as a filter or on Color.

Pages that compete for one query
Add a calculated field with {FIXED [Query] : COUNTD([Page])} to find queries where several pages get impressions.
If Tableau reads fewer rows than your sheet
Load less into the sheet. Drop a field you do not chart, such as page, or load fewer days, then compare the row counts again.
Use a CSV file. Tableau’s Text file connector read every row in our test.
Use a warehouse. Windsor.ai can send Search Console data to BigQuery, and the paid editions of Tableau connect to BigQuery directly.
Use another tool. We tested Search Console data in Power BI, Excel and Data Studio, and loaded a month of 547,336 rows in Python.















How to connect Google Search Console to Tableau
You need:
- Access to a Search Console property
- A Windsor.ai account (free forever plan, no credit card)
- Tableau Public or Tableau Desktop, and a Google account for the sheet route
Connect Search Console to Windsor.ai
Sign in at onboard.windsor.ai, choose Google Search Console and select your property. Domain properties appear as sc-domain:example.com and include every subdomain.

Load the data into a Google Sheet
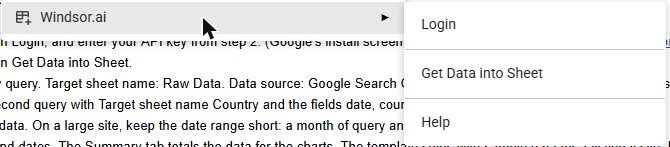
In a Google Sheet, install the Windsor.ai add-on and choose Extensions, Windsor.ai, Get Data into Sheet, then + Add new query. Pick Google Search Console, your property, the dates and the fields, name the target sheet, and click Save and load data. The Search Console to Google Sheets page has the details.
Connect Tableau to the sheet
In Tableau, choose Connect, To a Server, Google Drive. Sign in with the Google account that owns the sheet and allow all three permissions Google lists. Pick the file and drag the sheet into the canvas.
Check the row count
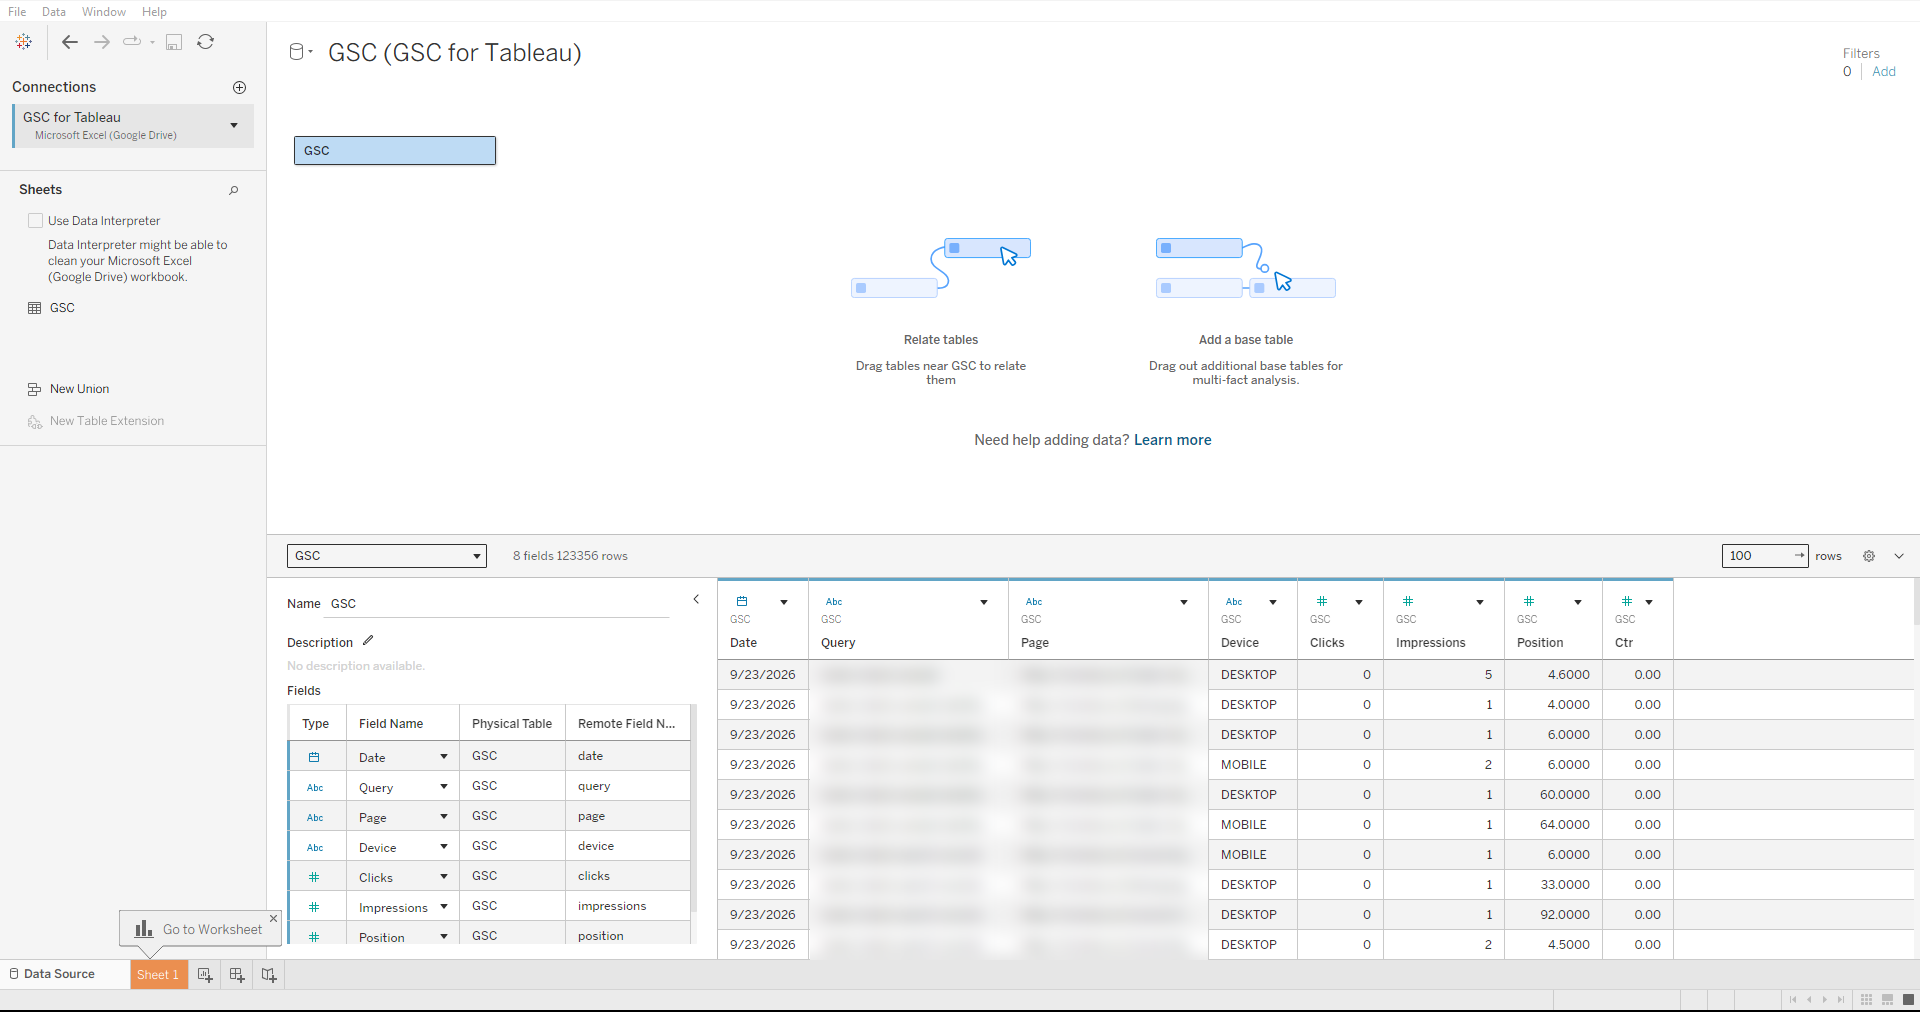
Compare the row count Tableau shows next to the field count with the last row of your sheet. In our test Tableau read 123,356 of the sheet’s 136,565 rows. If your count is short, use the CSV route in the next step.
Or open a CSV file
Request the same data from the Windsor.ai API with _renderer=csv, save it as a .csv file, and choose Connect, To a File, Text file in Tableau. Tableau read all 136,565 rows this way. A file is a snapshot, so request it again when you need newer days.
Our test in Tableau Public
On 4 October 2026 we loaded windsor.ai’s own Search Console data for 23 to 29 September with the fields date, query, page, device, clicks, impressions, CTR and position.
| Route | Rows Tableau read | Clicks |
|---|---|---|
| Windsor.ai API (reference) | 136,565 | 13,813 |
| Google Sheet, Google Drive connector | 123,356 | 11,269 |
| CSV file, Text file connector | 136,565 | 13,813 |
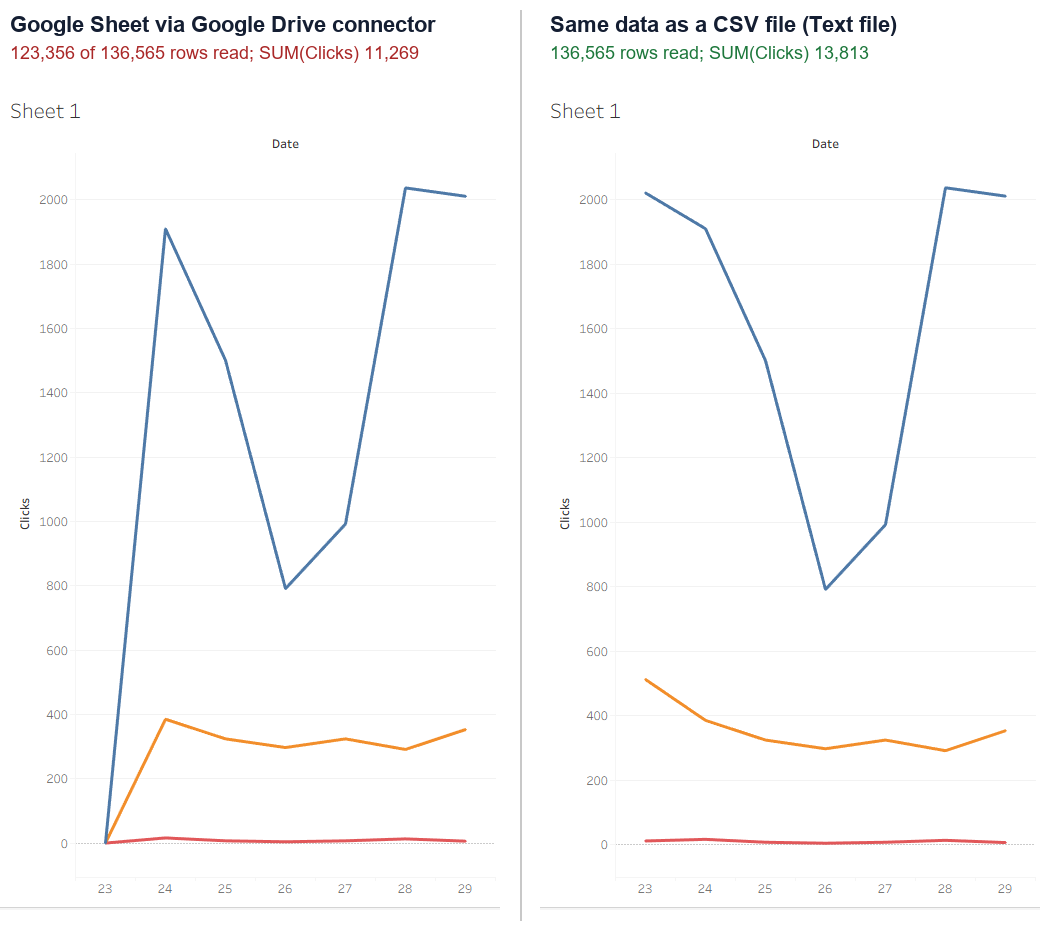
The sheet itself held all 136,565 rows. Tableau listed the connection as Microsoft Excel (Google Drive), read 13,209 fewer rows, and refreshing the data source did not change the count. The missing rows included the clicks for 23 September, so a chart of clicks by day started at almost zero:

Dates arrived as dates and the metrics as numbers in both routes. CTR is a ratio, so Tableau shows it as 0.00 until you format the field as a percentage.
Getting the CSV file
We saved the file with this Python code; it took 9 seconds and wrote 16 MB:
import os
import requests

params = {
    "api_key": os.environ["WINDSOR_API_KEY"],
    "date_from": "2026-09-23",
    "date_to": "2026-09-29",
    "fields": "date,query,page,device,clicks,impressions,ctr,position",
    "_renderer": "csv",
}
r = requests.get("https://connectors.windsor.ai/searchconsole", params=params, timeout=600)
open("gsc.csv", "wb").write(r.content)
The Search Console to Python page explains the API key and fields.
FAQs
Why does Tableau show fewer rows than my Google Sheet?
In our test Tableau’s Google Drive connector read 123,356 of 136,565 rows, every time we refreshed. Check the row count Tableau shows against the sheet’s last row. If it is short, load fewer rows into the sheet or open the data as a CSV file, which Tableau read in full.
What does "Google Drive has rejected this request because of insufficient permissions" mean?
We got this error even after allowing all three permissions Google listed. What fixed it: in Tableau, Help, Settings and Performance, Clear Saved Sign-ins; remove Tableau at myaccount.google.com/permissions; restart Tableau and connect again.
Is it free?
Yes. Tableau Public is free, and Windsor.ai has a free forever plan for one data source with no credit card. Paid Windsor.ai plans start at $19 a month; see pricing.
Why does CTR show as 0.00?
CTR arrives as a ratio, for example 0.0244. Format the field as a percentage in Tableau, or calculate it as SUM([Clicks]) / SUM([Impressions]) for totals.
Which Search Console fields can I load?
Date, query, page, page path, country, device and search type, with clicks, impressions, CTR and average position. The field reference lists all of them.
Is there a Tableau dashboard template for Search Console?
See the Tableau Search Console dashboard template and the Search Console dashboard templates page, which compares the Tableau, Data Studio, Power BI and Google Sheets templates.
Load your Search Console data into Tableau. Try Windsor.ai free


