 AI insights
 About us
 Careers
 Security
 Customer reviews
 Contact us
 Affiliate program
 Solution partners
 Looker Studio templates
 Tableau templates
 Facebook Ads templates
 Google Ads templates
 Data fields & Metrics
 AI prompt library & Guides
 Product documentation
 API documentation
 Case studies
 Blog
Blog Data models
 Windsor vs Supermetrics
 Windsor vs Fivetran
 Windsor vs Portermetrics
 Last updated: 21 May 2025

Structured data helps your website speak the same language as Google and search engines. This way, they can understand your content well and you will get more organic traffic and better rankings. Not only that, but you can also use it to enable rich results in SERPs. Users will then find more valuable information for their search queries and you can get more clicks and grow your business through more visits and sales.
You can make a difference with structured data in search engine optimization, and that impact is measurable whether you have a large or small business.
In this article, we are going to show you how to do this by blending your structured data with Google Analytics traffic data. The result will not only help you measure the performance of your website in numbers but also the importance of content that can drive your business.
What Is Semantic Analytics?
The Semantic Web has shifted the focus from keywords to entities. These represent “concepts” and allow search engines and voice assistants to interpret what we know about a person, organization, place, or anything else described in a piece of content.
That’s why we talk about Semantic Web Analytics, which is the use of entities and related vocabularies like schema.org to analyze traffic to a website. By cross-referencing data from Google Analytics 4, Google Search Console, or your CRM, this type of analytics can help you learn more about your users and their behavior, and give you a greater strategic advantage than just impression and traffic data for your website.
How To Blend Structured Data In Looker Studio
With WordLift and similar solutions, you can add structured data to your content. Then, if you want to get semantic web analytics, you can extract structured data from web pages with just a few clicks and blend it with Google Analytics traffic in Looker Studio. And below I show you how to do it.
Step 1
If you have a small business with a small number of products, you can crawl your content with a Streamlit app. If you are more advanced and have a large number of products, you can use Colab, which works with Advertools SEO Crawler, the free library developed by Elias Dabbas. With this system, you can scan hundreds of thousands of URLs. But be careful, because you will not be able to detect structured data injected with Javascript.
Step 2
Once the crawler is done, you can paste the data into a Google Sheets.
Step 3
Now you can use Looker Studio to create a dashboard where you can select and display the most interesting insights for your business.
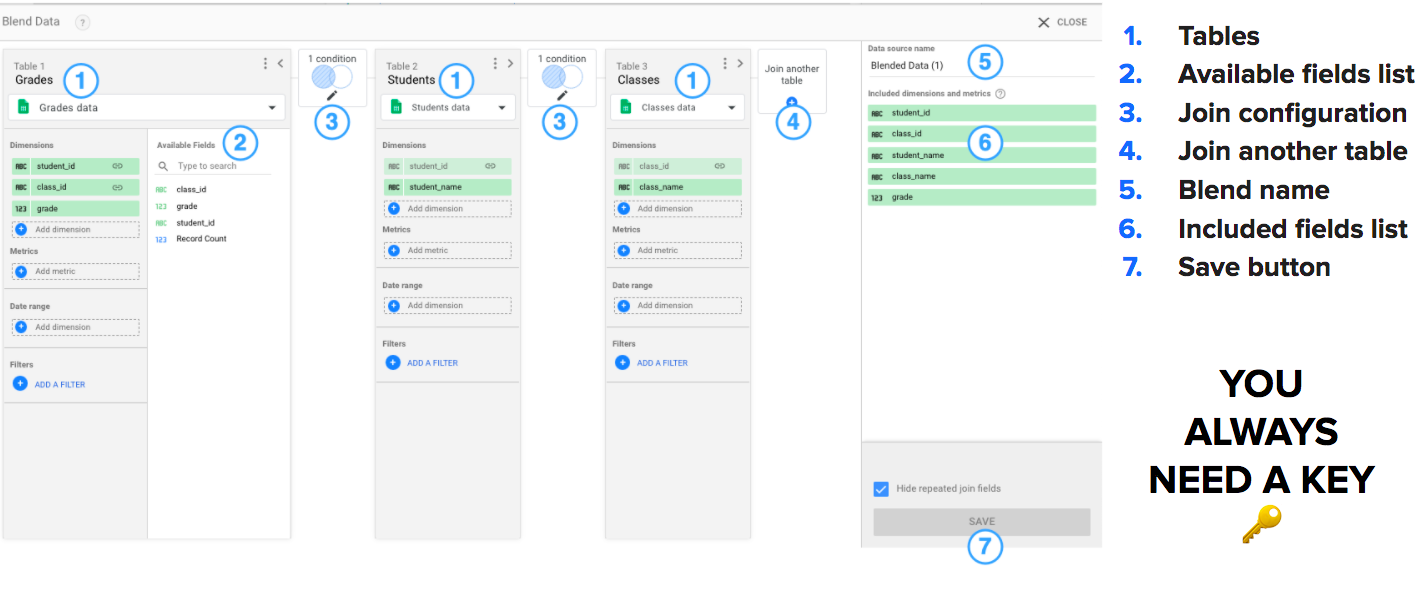
As you can see in the image, you have tables (in our case Google Sheets and Google Analytics) and a list of available fields that you can use from that table within the join to create a view with combined fields.
Then you have the join configuration, i.e. how you want to combine this data. You can decide if you want to take everything from the left table that overlaps with the right table, or if you want to look at the close overlap inside.
Then you have the name of the merged source you want to create and the fields you want to represent in that merged source, which is a view over one, two or more tables combined by a unique key. In this example, the unique key is the URL.
You use the URL on both pages to combine them, and these allow you to look at the analysis, for example, the session, by category.
Step 4
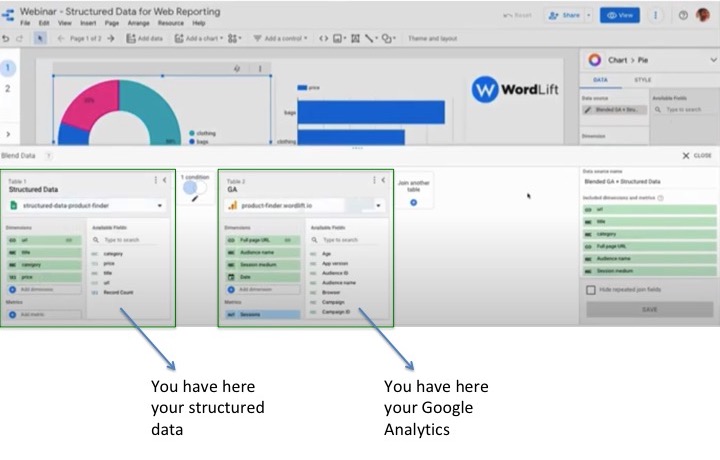
If you want to see something more advanced, you can mix the second spreadsheet with Google Analytics. In this case, you’ll have more data available, such as the color and brand name, and you can create a chart with the product category, session, and price. This way you can see the traffic for each product category and the price. You can also see the breakdown of the colors and the brands.
By extracting structured data from your web pages and blending it with Google Analytics data, you can get a more precise and accurate picture of your users’ behavior in just a few clicks. This can make all the difference in learning how to improve your marketing strategy and grow your business.
Structured Data Pitfalls
- Structured data inserted with JavaScript is not easily scannable;
- The data is messy and/or inconsistent;
- Multiple syntaxes appear on the same page;
- Multiple tools can add conflicting statements;
- Competitors have better data.
In partnership with Worldlift we recorded for you this webinars, that explain thouroughly how to get structured Data into Google Data Studio”
More to read:
Best Looker Studio Examples in 2023
Looker Studio vs Power BI in 2023: Which is better?
Looker Studio Template Gallery
What can you use Looker studio for?
Google Data Studio SEO Reporting Template
Benefits of Google Data Studio Templates

