 Destinations
 Data sources
 AI insights
 About us
 Careers
 Security
 Customer reviews
 Contact us
 Affiliate program
 Solution partners
 Template gallery
 Looker Studio templates
 Power BI templates
 Excel templates
 Google Sheets templates
 Tableau templates
 Facebook Ads templates
 Google Ads templates
 Data fields & Metrics
 AI prompt library & Guides
 Product documentation
 API documentation
 Case studies
 Blog
Blog Data models
 Windsor vs Supermetrics
 Windsor vs Funnel.io
 Windsor vs Fivetran
 Windsor vs Rivery
 Windsor vs Portermetrics
 Windsor vs Coupler.io
 Last updated: 3 September 2026




Search for “best Claude connectors” and you will find plenty of lists. The ones we found are ranked by editorial judgment: someone tried a handful of connectors, liked some, and wrote them up. That is a fine way to discover tools. It tells you nothing about what people keep using once the novelty wears off.
We can answer that second question with data. Windsor.ai’s connector is natively listed in Claude’s directory and moves business data from 350+ platforms into Claude chats for the 35,000+ marketing teams on the platform. Every data query leaves a log line. So instead of ranking connectors by opinion, we ranked them by how many teams queried each one through Claude over a full quarter: thirteen weeks, June 1 to August 28, 2026, covering millions of data queries.
Scope: this measures business data sources (ad platforms, analytics, CRMs, e-commerce) queried through Windsor’s connector. Anthropic’s directory also lists productivity connectors like Gmail and Google Drive, and we have no visibility into those. The full methodology is at the end of the article.
- What are Claude connectors?
- How we measured
- The ranking: weekly share of teams per connector
- Three connectors reach a third of all teams
- Usage more than doubled over the summer
- Monday is the busiest day on almost every connector
- GA4 and Search Console: the measurement pair
- The organic and local block
- The long tail runs 212 connectors deep
- What teams let Claude change
- How to connect your own data
- Frequently asked questions
- Methodology
What are Claude connectors?
Claude connectors are integrations that let Claude read data from outside tools (ad platforms, analytics, CRMs, databases, productivity apps) and, on some platforms, act on that data with your confirmation. They install with one click from Claude’s connector directory, and once a source is connected, Claude can answer questions about that data directly in the chat.
How we measured
We took thirteen weeks of production logs (June 1 to August 28, 2026), kept only queries made through the Claude client, and counted the distinct teams that queried each connector in each week. A connector’s score is its average weekly share of active teams. Ranking by teams stops one team’s scheduled automation from skewing the list, and averaging across weeks stops a single spike from deciding the order. All figures are shares and ratios from that window.
The ranking: average weekly share of teams querying each connector
| # | Connector | Share of active teams | Query success rate |
|---|---|---|---|
| 1 | Instagram Insights | 34.8% | 89.2% |
| 2 | Meta Ads (Facebook and Instagram Ads) | 33.6% | 92.3% |
| 3 | Google Ads | 31.8% | 89.7% |
| 4 | Google Analytics 4 | 19.4% | 91.3% |
| 5 | Google Search Console | 10.5% | 93.3% |
| 6 | TikTok Organic | 4.6% | 89.3% |
| 7 | Instagram Public Data | 3.9% | 79.2% |
| 8 | Facebook Page Insights | 3.9% | 90.7% |
| 9 | YouTube | 3.1% | 87.5% |
| 10 | Google Business Profile | 3.0% | 91.1% |
| 11 | TikTok Ads | 2.9% | 95.1% |
| 12 | LinkedIn Ads | 2.1% | 94.5% |
| 13 | Shopify | 1.9% | 90.3% |
| 14 | LinkedIn Pages | 1.6% | 90.2% |
| 15 | Google Merchant Center | 1.2% | 85.1% |
Three connectors reach a third of all teams
Instagram Insights, Meta Ads, and Google Ads each reached roughly one in three active teams in an average week. Nothing else comes close: the gap between third place (31.8%) and fourth place (19.4%) is larger than the entire share of any connector from sixth place down.
The order changes when you count queries instead of teams. Google Ads produced 27.4% of all data queries made through Claude over the quarter, ahead of Meta Ads at 21.4%, and a Google Ads team averaged about 18 queries per week against about 13 for a Meta Ads team and about 7 for an Instagram Insights team. Instagram reaches the most teams; Google Ads gets worked the hardest. Together, the top five connectors carried 80.2% of all Claude data queries.
Usage more than doubled over the summer
Thirteen weeks is long enough to see a direction, and the direction is steep. The number of teams querying data through Claude in a given week grew 2.3x between the first week of June and the last week of August, and weekly query volume grew 3.6x. Queries are growing faster than teams, which means the average team is asking more questions over time, and the success rate held between 90 and 91 percent in every single week while volume tripled.
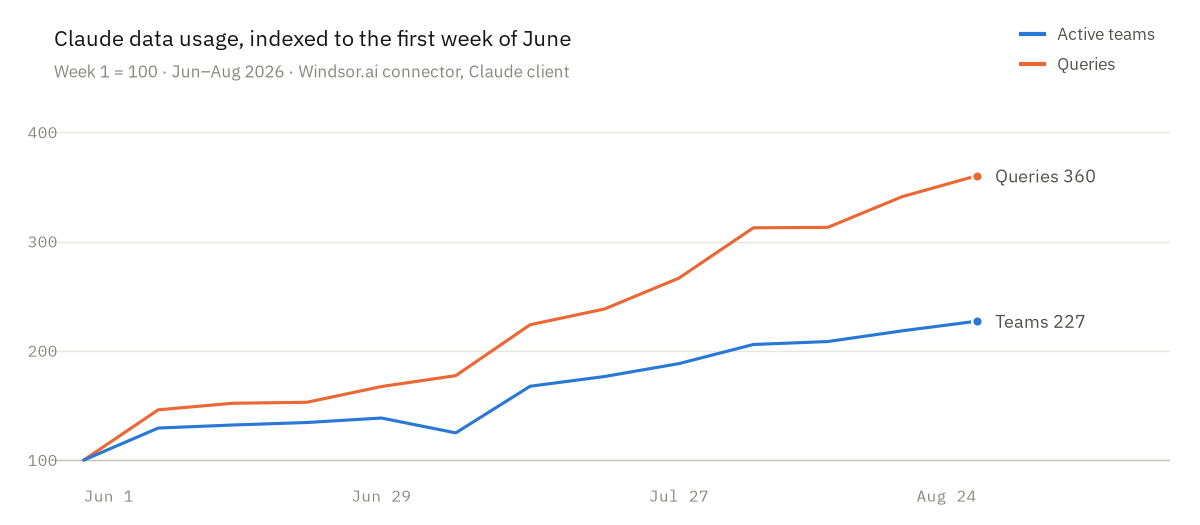
Growth is not evenly spread. Comparing each connector’s first four weeks to its last four, the fastest growers are commerce and local connectors: Google Merchant Center (2.3x), Google Business Profile (2.1x), Microsoft Clarity (2.1x), CallRail (2.0x), Microsoft Ads (2.0x), and WooCommerce (2.0x) all roughly doubled their weekly team counts. The big three grew too (Meta Ads 2.0x, Google Ads 1.9x), while Instagram Insights, already the widest-reaching connector in June, grew a slower 1.5x.
Monday is the busiest day on almost every connector
Daily logs answer a second question: is this usage constant, or does it come in bursts? For the ten highest-volume connectors we profiled, the answer is a steady weekly rhythm. Not one of the big connectors had a single burst day in thirteen weeks; volume follows the work week instead. Monday is the heaviest day on nine of the ten, carrying 17 to 23 percent of each connector’s weekly queries where a flat week would put 14.3 percent on every day, and Friday is the quietest weekday across the board. Shopify has the strongest Monday (22.9% of its week), followed by Salesforce (22.5%) and GA4 (22.0%).
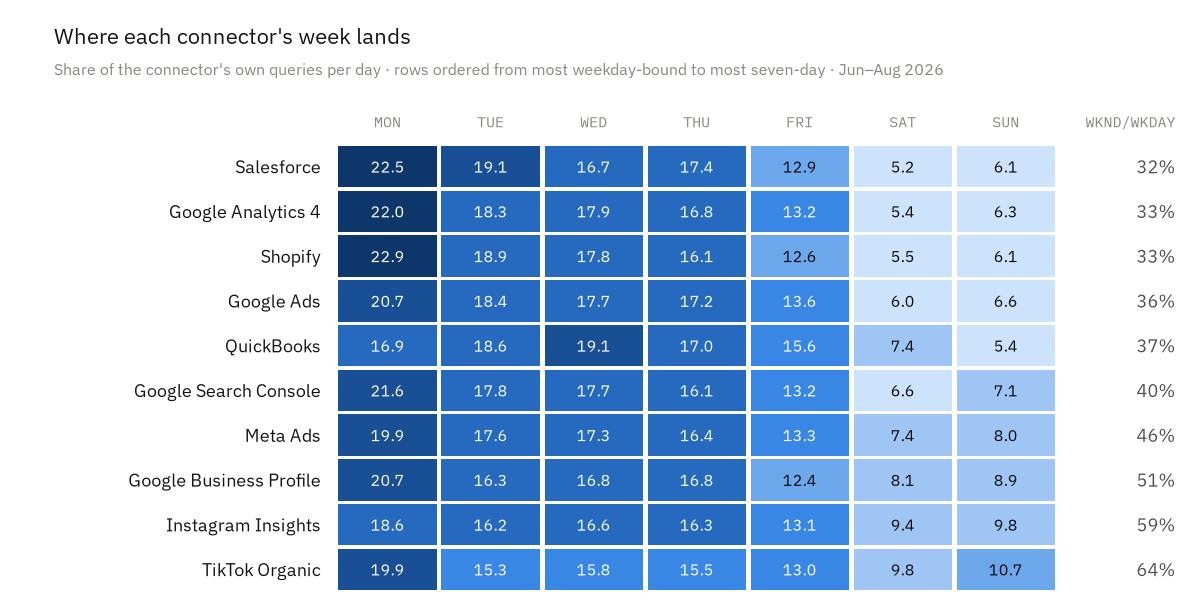
Weekends split the connectors by audience. Business tools go nearly silent: Salesforce, GA4, and Shopify each run weekend days at about a third of their weekday volume. Social and local connectors keep working through the weekend: TikTok Organic holds about two thirds of its weekday pace, Instagram Insights 59 percent, and Google Business Profile roughly half. The two connector families serve different jobs, and the calendar shows it.
QuickBooks is the one connector that peaks midweek instead of Monday, which fits bookkeeping work that follows invoice and reconciliation cycles instead of the Monday reporting meeting. The only burst days anywhere belong to the low-volume CRM and finance connectors, where a single team’s heavy session can double a day; the high-volume connectors never deviate from the weekly pattern.
| Connector | Mon | Tue | Wed | Thu | Fri | Sat | Sun | Weekend vs weekday |
|---|---|---|---|---|---|---|---|---|
| Salesforce | 22.5% | 19.1% | 16.7% | 17.4% | 12.9% | 5.2% | 6.1% | 32% |
| Google Analytics 4 | 22.0% | 18.3% | 17.9% | 16.8% | 13.2% | 5.4% | 6.3% | 33% |
| Shopify | 22.9% | 18.9% | 17.8% | 16.1% | 12.6% | 5.5% | 6.1% | 33% |
| Google Ads | 20.7% | 18.4% | 17.7% | 17.2% | 13.6% | 6.0% | 6.6% | 36% |
| QuickBooks | 16.9% | 18.6% | 19.1% | 17.0% | 15.6% | 7.4% | 5.4% | 37% |
| Google Search Console | 21.6% | 17.8% | 17.7% | 16.1% | 13.2% | 6.6% | 7.1% | 40% |
| Meta Ads | 19.9% | 17.6% | 17.3% | 16.4% | 13.3% | 7.4% | 8.0% | 46% |
| Google Business Profile | 20.7% | 16.3% | 16.8% | 16.8% | 12.4% | 8.1% | 8.9% | 51% |
| Instagram Insights | 18.6% | 16.2% | 16.6% | 16.3% | 13.1% | 9.4% | 9.8% | 59% |
| TikTok Organic | 19.9% | 15.3% | 15.8% | 15.5% | 13.0% | 9.8% | 10.7% | 64% |
Each row shows the share of that connector’s own queries landing on each day, so the rows compare rhythm, not size. “Weekend vs weekday” is the average weekend day as a share of the average weekday.
GA4 and Search Console: the measurement pair
Google Analytics 4 has the middle of the table to itself at 19.4% of teams, with Search Console at 10.5%. These two behave differently from the ad connectors. Ad questions tend to be about spend and results (“what did we spend on Meta last week and what did it return”). GA4 and Search Console questions are about diagnosis: which pages dropped, which queries gained impressions, where the traffic went. GA4 teams averaged about 15 queries each per week, close to Meta Ads intensity, which suggests the teams that connect analytics data have made Claude part of their regular reporting routine. Both connectors also nearly doubled their weekly team counts over the quarter.
We have written separately about which user metrics AI assistants request from GA4, based on the same logs.
The organic and local block
Positions six through eleven are all organic and social surfaces: TikTok Organic, Instagram Public Data, Facebook Page Insights, YouTube, Google Business Profile, and TikTok Ads. Individually each reaches only 3 to 5 percent of teams, but as a group they show a clear pattern: teams ask Claude about owned and organic presence, on top of paid performance.
One detail from the success-rate column: Instagram Public Data (79.2%) has the lowest success rate in the top fifteen. Public social data endpoints are less stable than authenticated APIs, and thirteen weeks of logs show it consistently.
The long tail runs 212 connectors deep
Teams queried 212 different connectors through Claude over the quarter, from PostgreSQL to CallRail to Apple Search Ads. Two long-tail patterns stood out.
Few teams query bookkeeping connectors, but the ones that do get the best results on the platform. QuickBooks (96.8%) and Xero (96.9%) posted the highest success rates among commonly used connectors, and their users are committed: QuickBooks teams averaged about 31 queries per week. Bookkeeping data has clean schemas and precise questions, and that combination suits an AI assistant.
CRM teams are the heaviest per-team users of all. Teams querying Salesforce through Claude averaged about 45 queries each per week, more than double the Google Ads average. A CRM invites follow-up questions: filter the pipeline, break it down by stage, compare against last quarter. On the write side, HubSpot analysis stays read-only, while the Salesforce connector can also update fields on existing records and GoHighLevel supports contact and invoice actions, each run only when you ask.
What teams let Claude change
Windsor’s connector also supports write actions on the major ad platforms, so the same quarter of logs shows where teams trust Claude to make changes. Google Ads leads by a wide margin: it had the most teams running write actions (budget changes, keyword additions, campaign edits) and those actions succeeded 96.6% of the time. Meta Ads came second in acting teams with an 81.2% action success rate, and Google Business Profile writes (posts and review replies) succeeded 97.7% of the time. The pattern matches the trust ladder we described in our Claude vs ChatGPT study: teams start with read-only questions and graduate to letting the assistant make changes, on the platforms where structured actions are hardest to get wrong.
How to connect your own data
Windsor.ai is listed in Claude’s connector directory, so setup is a one-click Add: install the connector, sign in, and pick your data source from the 350+ available. No URL pasting, no configuration files. It works on a free forever plan with no credit card, and the pricing page lists the paid plans. The step-by-step guide covers the details, and each connector in the table above links to its own setup page.
If your stack runs on the same platforms as the top of this list, the data points to a simple order: connect your ad accounts first, then add GA4 and Search Console once you want Claude diagnosing performance and answering the follow-up questions.
Frequently asked questions about Claude connectors
What are the best connectors for Claude?
Measured by how many teams use them each week, the top Claude connectors for business data are Instagram Insights, Meta Ads, and Google Ads, each reaching roughly a third of active teams, followed by Google Analytics 4 and Google Search Console. The best set for you depends on your stack: the common pattern is ad platforms first, then analytics for diagnosis.
What apps can Claude connect to?
Claude’s own directory covers productivity apps such as Gmail, Google Drive, and calendar tools. For business data, the Windsor.ai connector adds 350+ sources: ad platforms, analytics, CRMs, e-commerce platforms, and databases. Teams queried 212 different business data sources through Claude in the quarter this article measures.
What do connectors do in Claude?
They let Claude pull live data from a connected tool and answer questions about it in plain language, with no exports or copy-pasting. On the major ad platforms, Windsor’s connector also supports write actions (budget changes, pausing campaigns, keyword additions), each confirmed by you before it runs.
Can Claude use connectors on the free plan?
The Windsor.ai connector works on every Claude plan, and Windsor itself has a free forever plan with no credit card. Paid plans are listed on the pricing page.
Methodology
Source. Windsor.ai production logs. Every data query made through the Windsor connector records the connector, the team, a timestamp, and whether it returned data or an error. Write actions are logged the same way.
Window. Thirteen full weeks, June 1 to August 28, 2026.
Client filter. Every request identifies the AI client that made it. This article counts only queries from the Claude client; ChatGPT and other clients, and traffic that reaches the API directly without an AI assistant, are excluded.
Ranking metric. For each of the thirteen weeks, we counted the distinct teams that queried each connector at least once and divided by the distinct teams active on Claude that week. A connector’s score is the average of its thirteen weekly shares. Counting teams instead of queries keeps one team’s scheduled automation from inflating a connector, and averaging across weeks keeps a single unusual week from deciding the order.
Query shares and intensity. Query shares are each connector’s portion of all Claude data queries in the window. Per-team intensity is the connector’s queries divided by its team-weeks, read as queries per active team per week.
Success rate. The share of queries that returned data instead of an error. Errors include everything the team saw fail, including upstream platform API errors and expired logins, so this measures the experience end to end, not only Windsor’s side.
Growth. Weekly series indexed to the week of June 1 = 100, which is also the earliest week in the logs used.
Weekday profile. Daily query counts per connector, with each day expressed as a share of that connector’s own total, so rows compare rhythm, not size. The weekend ratio is the average weekend day divided by the average weekday. A burst day is a day above 2.2 times the connector’s trailing seven-day median.
What we publish. Shares, ratios, and averages. No team-level or customer-identifiable data appears in this article, and burst dates are withheld because a dated spike on a low-volume connector could point to a single customer’s activity.
Limitations. This measures Windsor.ai’s user base, which skews toward marketing and e-commerce teams, and only business data sources connected through Windsor. Teams using Anthropic’s productivity connectors (Gmail, Google Drive, Asana) or other MCP servers are not visible in these logs, so the ranking describes business data usage, not the whole Claude connector directory.


