 AI insights
 About us
 Careers
 Security
 Customer reviews
 Contact us
 Affiliate program
 Solution partners
 Looker Studio templates
 Tableau templates
 Facebook Ads templates
 Google Ads templates
 Data fields & Metrics
 AI prompt library & Guides
 Product documentation
 API documentation
 Case studies
 Blog
Blog Data models
 Windsor vs Supermetrics
 Windsor vs Fivetran
 Windsor vs Portermetrics
 Last updated: 21 May 2025

Time series forecasting is one of the pillars of machine learning as it allows you to plan ahead and adjust your marketing efforts to fit your goals.
In this blog post, we will learn how to get the forecasting results in Power BI using two methods: Times series forecasting graphs and What if Parameters.
What is time series forecasting in Power BI?
Times series forecasting is a term that occurs when you create an AI Prediction using Scientific methods based on Historical data.
It includes the construction of Data models through Historical analysis and leveraging them to highlight insights and improve your future decisions.
It is a process of analyzing Data over time using statistics to forecast results.
But accuracy is not always guaranteed when facing fluctuating variables.
Continue reading to get a deeper understanding of how Times Series forecasting can improve your Decision making.
For this article, we will be using Meta “Facebook” ads to see thspendingact of spend on Clicks and CTR ( Click-through-rate).
Getting your Data into Power BI
Since BI, has deprecated their Facebook ads connector, we will be using Windsor.ai’s connector to connect Meta Ads to Power BI.
Method 1: Times Series forecasting Using the Analysis Pane in Microsoft Power BI
First you need to load your Data to Power BI, Make sure that your data contains dates, and for the time series analysis to work properly you would need a minimum of 90 days data.
1. Select the Line chart Visual as show in the image below.
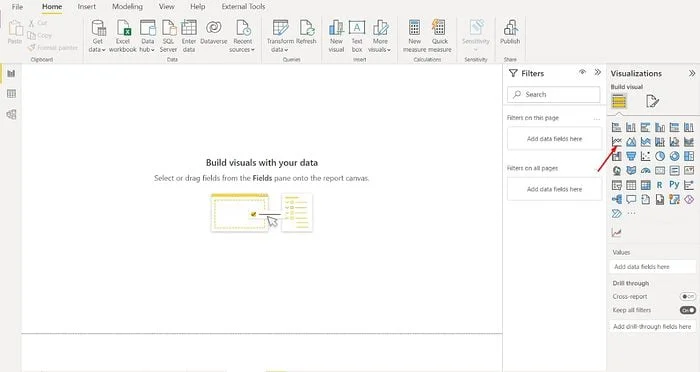
2. Add the Date field to the X axis and the clicks field to the Y axis.
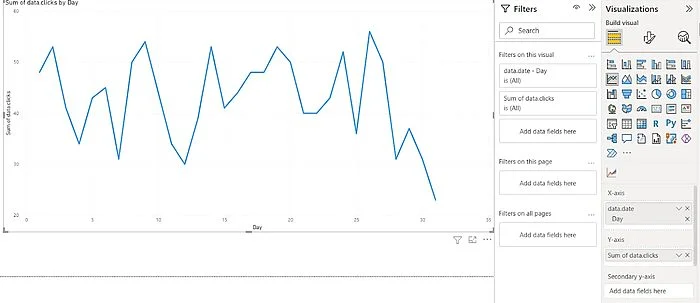
3. Go to the analytics Pane and turn the forecast option on.
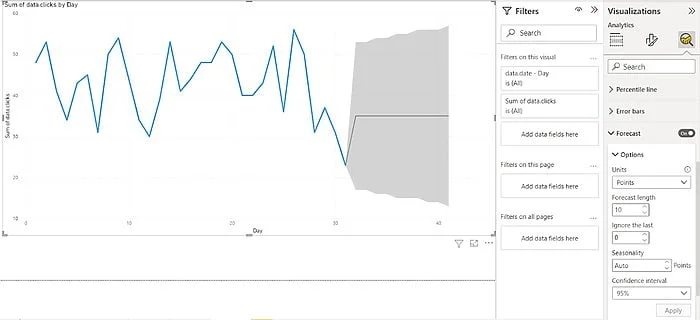
With the option in the image above you can adjust the confidence interval and the forecast length depending on your analysis requirements.
Method 2: Using What if Parameters to visualize variables
Power BI’s What if parameters are used as a way to predict values with specified conditions, which can vary from cost, impressions, clicks, conversions and many more.
For example, what would the conversion rate be if you would increase Ad spend for campaigns, another one would be to create a marketing mix to emphasize how the profit would be affected due to the investments in different channels.
How to use What IF parameters in Power BI
- Click the Modeling tab in the top ribbon.
- Click the What IF parameter from the top ribbon.
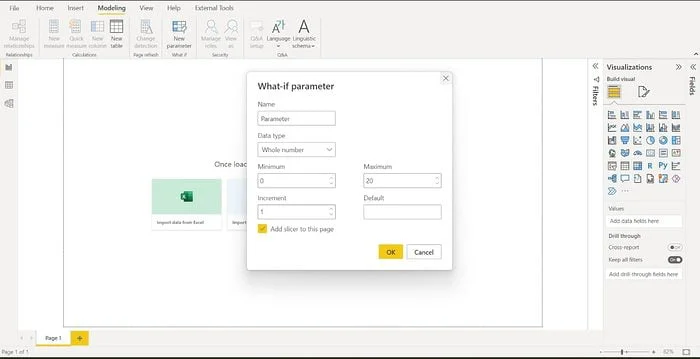
- The What If parameter window will open
- Provide details such as Name, Data Type, Minimum, Maximum and Default number.
- Lastly, you can add an optional slicer.
- A table with a calculated measure will be created
- A generated series that spans the specifications of your parameter
- A selected value function that changes as the parameter changes.
Using the what if parameters there are many scenarios that you can create to get the results you need, based on multiple conditions.
Scenario test
You have a list of products with Product_name, price, and cost. we will create a parameter that will let us apply discounts to calculate the revenue on each item when a discount is applied. we will generate a series of discounts that ranges from 0% to 100% with a 5% increment.
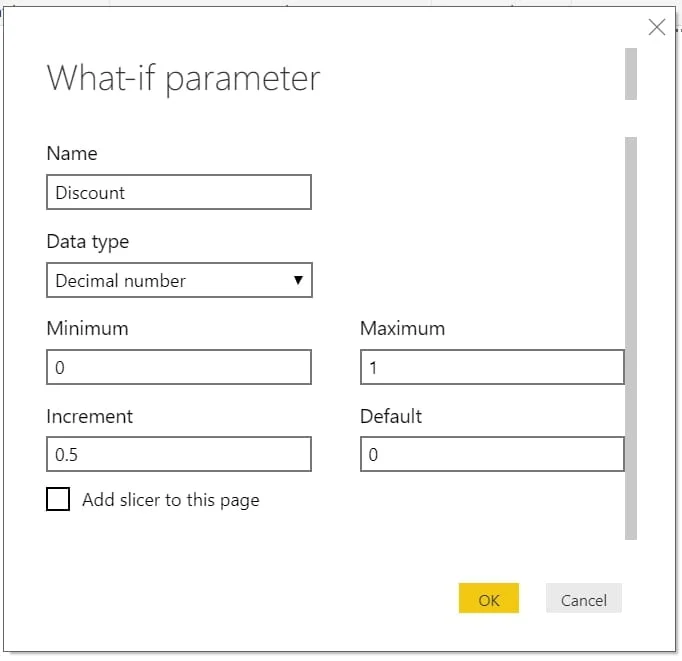
Once the What If parameter is created you have your generated series that looks like:
Discount = GENERATESERIES(0, 1, 0.5)
And you will have a selected value functions that looks like this:
Discount Value = SELECTEDVALUE(‘Discount'[Discount], 0)
Both of these are automatically created for you.
Apply the parameter to your data
In this case, I want to apply the discount to my price. This can be easily done with a calculated measure. As below you see below, I simply multiply the price by my discount value.
Discounted Price = Discount[Discount Value]* SUM(Items[Price])
The final result you can pull into a table so that you see how the price is affected by the discount parameter as you slide it to different discount values.
Conclusion about time series analysis and forecasting using Power BI
In this article, we went through different methods, to predict certain values based on specific conditions.
Keep in mind that there are many more, and complicated solutions and techniques to do this, but we tried to keep it simple.
If you want to start seeing real time insights from your Marketing data, and use the techniques we just learned, then Start your 30 days free trial today.
You May Be Also Interested in:
Popular Power BI Templates in 2024
What Data Sources can Microsoft Power BI Desktop connect to?
Use Cases for Power BI in Marketing Analytics
Connect Google Ads to Power BI
Connect Facebook Ads to Power BI
Connect Salesforce to Power BI
Connect Twitter Ads to Power BI
Connect Snapchat Ads to Power BI
Connect Linkedin Ads to Power BI

