 AI insights
 About us
 Careers
 Security
 Customer reviews
 Contact us
 Affiliate program
 Solution partners
 Looker Studio templates
 Tableau templates
 Facebook Ads templates
 Google Ads templates
 Data fields & Metrics
 AI prompt library & Guides
 Product documentation
 API documentation
 Case studies
 Blog
Blog Data models
 Windsor vs Supermetrics
 Windsor vs Fivetran
 Windsor vs Portermetrics
 Last updated: 18 April 2026
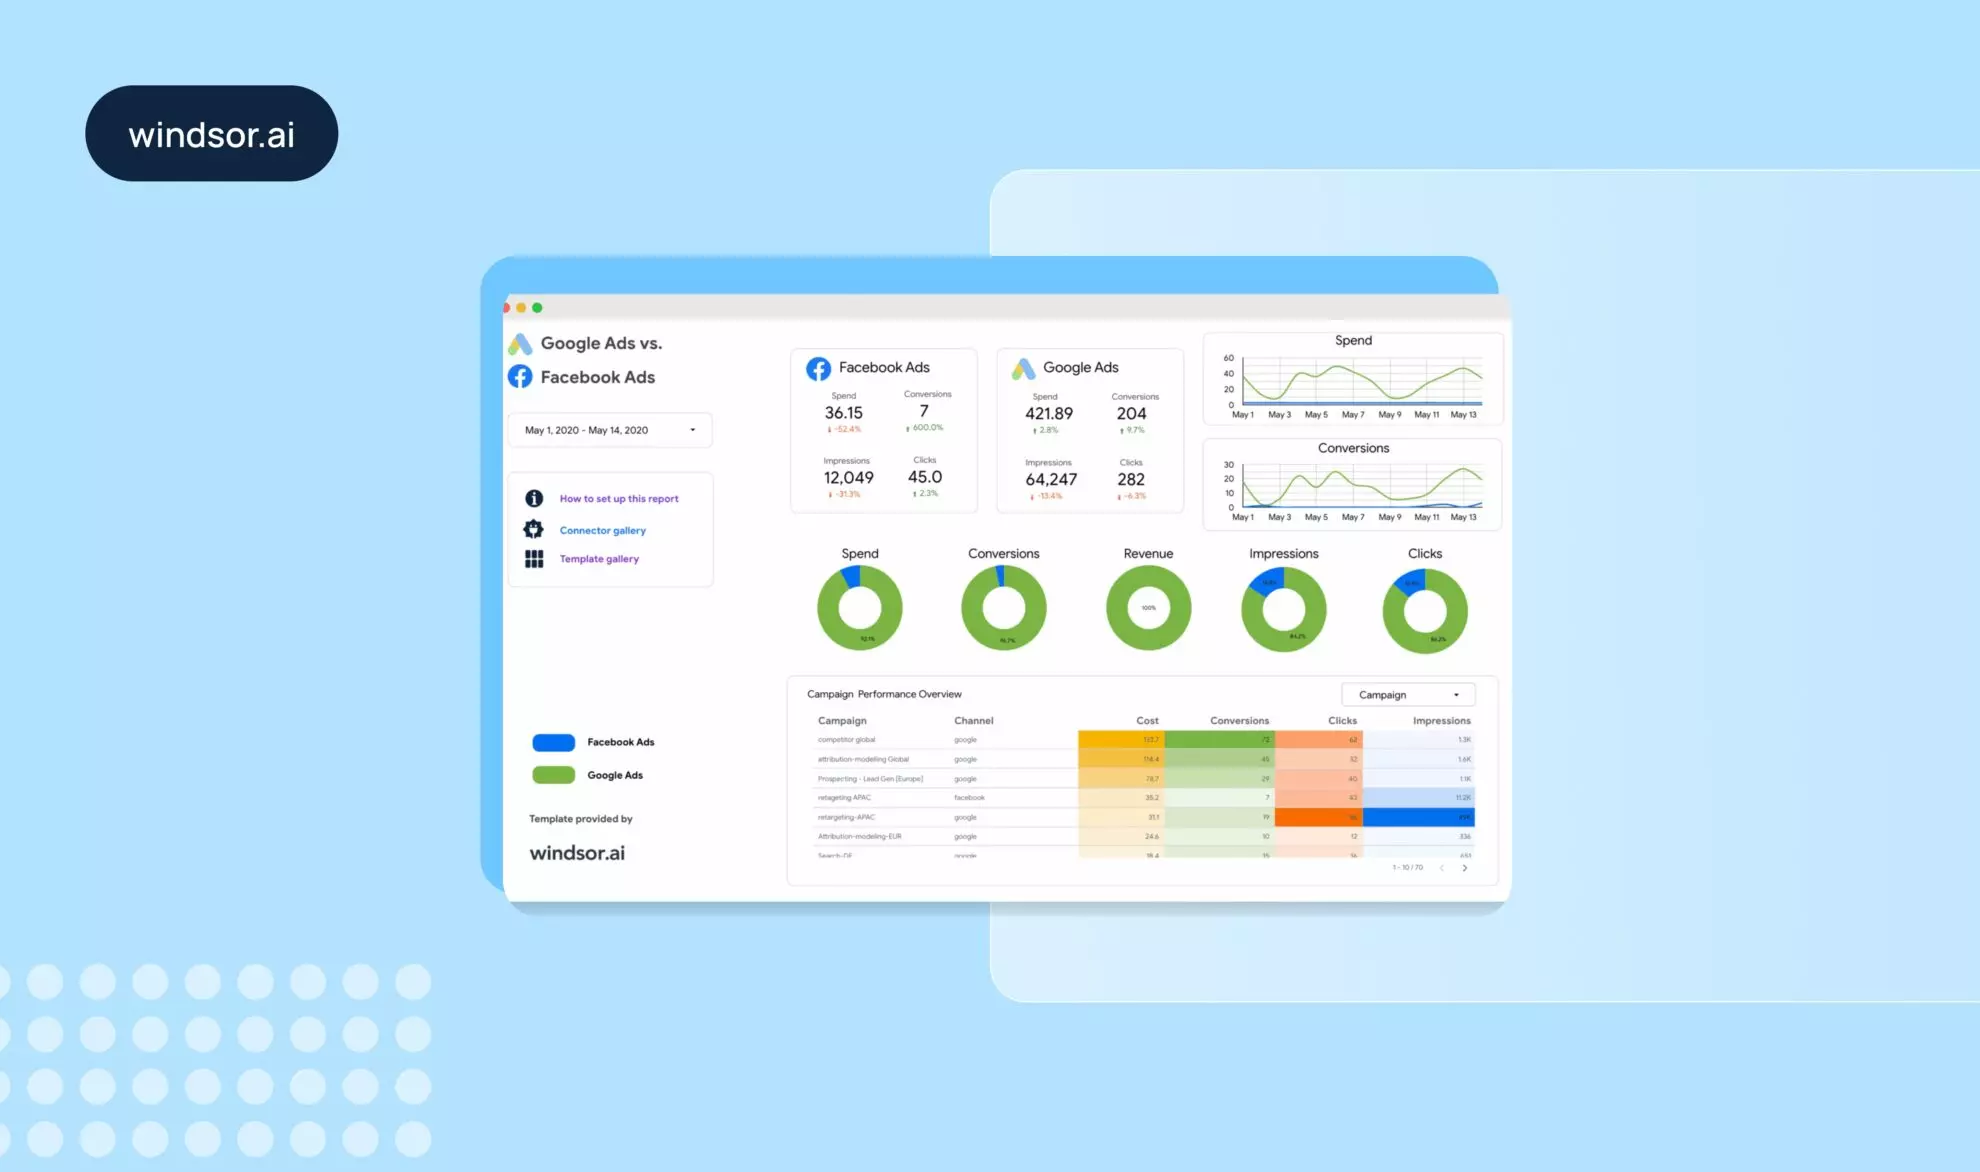

Do you spend more time building reports than analyzing insights? Many marketers waste hours collecting and formatting data, uploading sheets, and building Looker Studio dashboards from scratch, leaving less time for real analysis.. As a team of data analysts, we know this firsthand.
Now, imagine the opposite: sync data from multiple sources into pre-built Looker Studio dashboards in a fully automated way, and share live numbers with your team and stakeholders in minutes. No manual reporting hassle.
All this becomes possible when you use Windsor.ai’s ready-to-use marketing templates for Looker Studio. Designed for 325+ marketing, sales, and business apps, including Google Ads, GA4, Facebook Ads, and other popular platforms, you skip complex technical configurations and dive straight into decisions, with no code and data wrangling.
To simplify your search, we’ve compiled a list of 20+ plug-and-play Looker Studio dashboard report examples for social media, SEO, e-commerce, ads, CRM, and other reporting cases. Select the relevant template for your data source and follow the simple setup instructions. All templates are absolutely free to use.
You have data and the analytical talent. We provide you with all the necessary tools to automate time-consuming integration processes.
Best Looker Studio dashboard examples for paid social media analytics
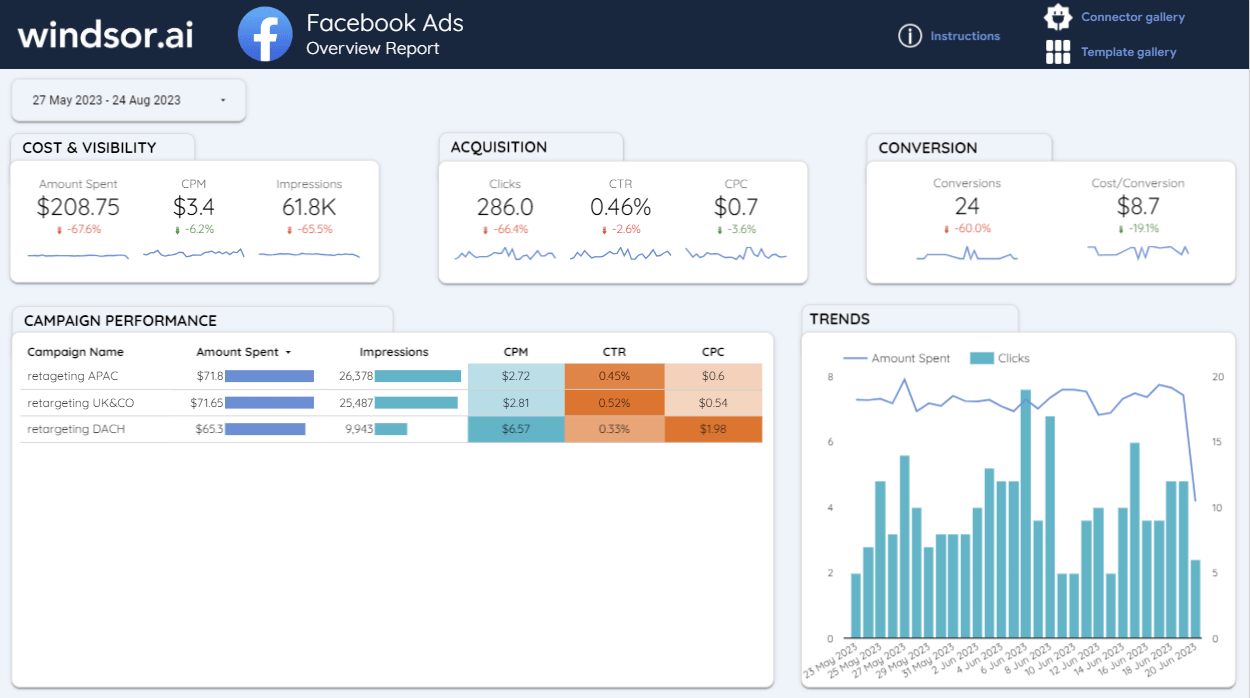
1. Facebook Ads Dashboard Template
- Try it now: Template link
- Connect your Facebook Ads data to Looker Studio
- Learn more about this template: Setup instructions
One of our most popular templates, this Facebook Ads Dashboard for Looker Studio provides a clear view of your ad spend, reach, clicks, and conversions. It highlights cost efficiency (CPM, CPC, cost per conversion) and reveals campaign-level performance to help optimize your targeting and budgets.
Best for:
Freelance marketers, digital agencies, and business owners tracking ad ROI in Looker Studio. Suitable for both internal and client reporting.
Template components:
- Awareness & reach: Impressions, reach, CPM, and spend trends
- Engagement & acquisition: Clicks, CTR, CPC
- Conversions & ROI: Conversions, cost per conversion
- Performance insights: Campaign performance breakdown over the selected period
- Daily spend vs. clicks trend analysis
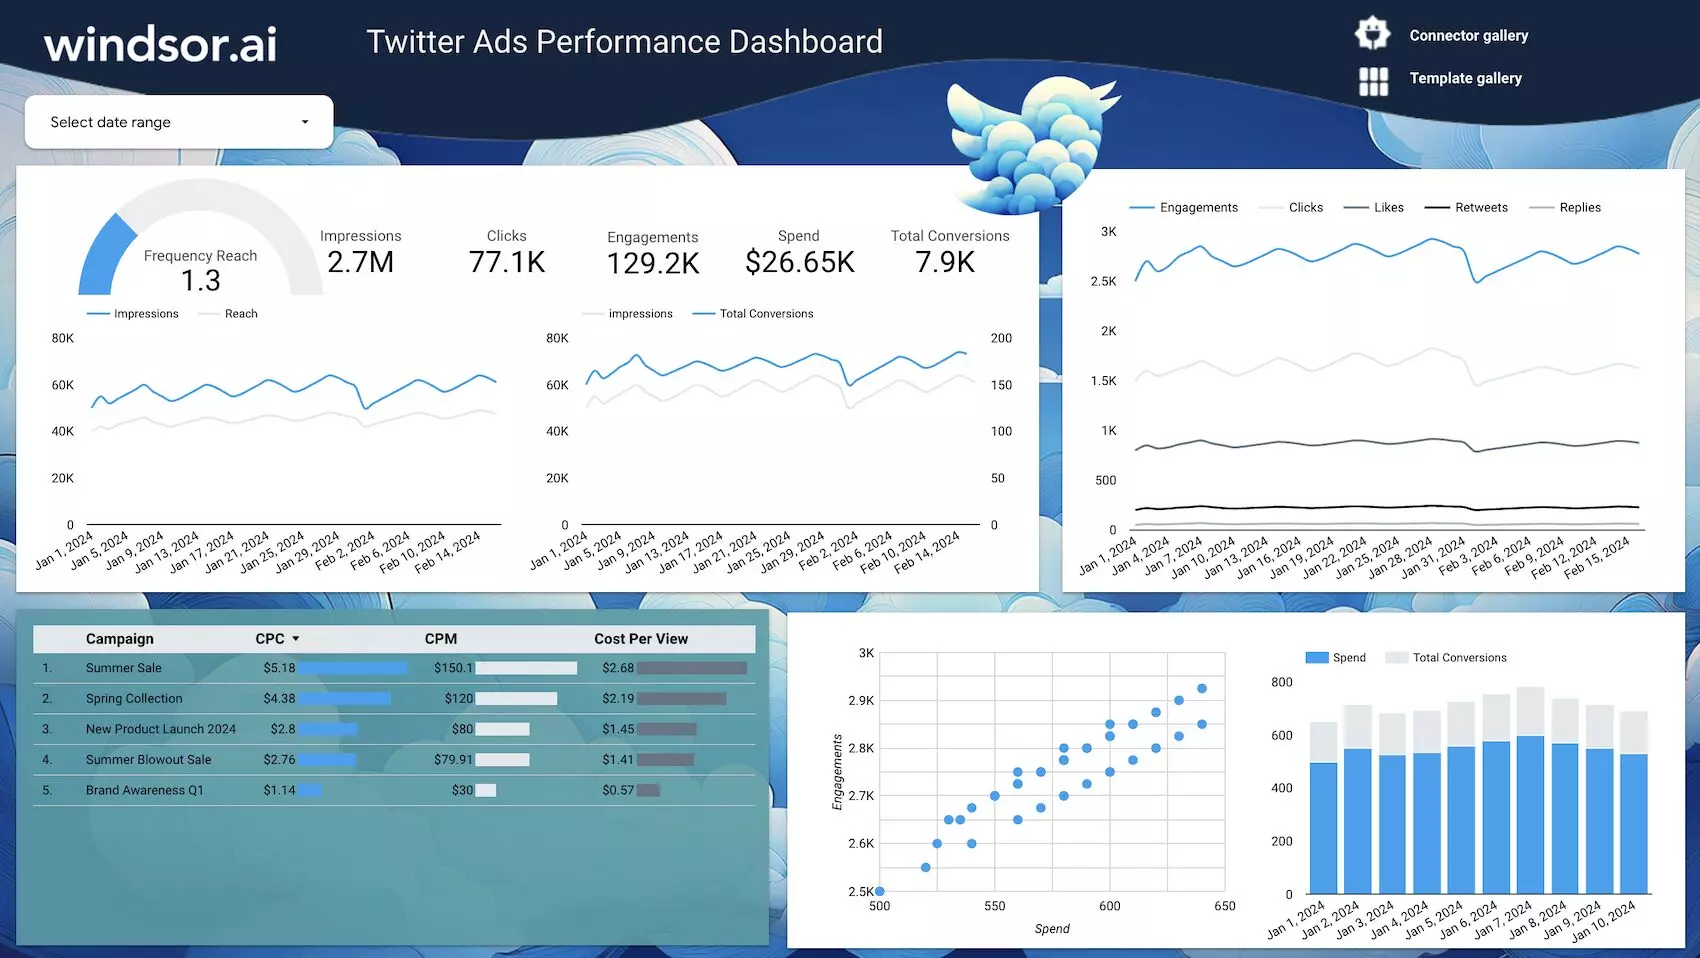
2. Twitter (X) Ads Performance Dashboard Template
- Try it now: Template link
- Connect your Twitter Ads data to Looker Studio
- Learn more about this template: Setup instructions
This Twitter Ads overview dashboard example by Windsor.ai lets you get a full picture of your paid campaign reach, engagement, and conversions. It visualizes ad spend against conversions, helping you spot which campaigns are worth scaling.
Best for:
- Social media managers optimizing Twitter campaigns
- Agencies running multi-channel ad reports
- Marketers aligning company spend with conversions
Template components:
- Impressions, clicks, and engagement rates
- Cost metrics like CPC, CPM, and cost per view
- Campaign-level breakdowns
- Conversion funnel visualizations and spend trends
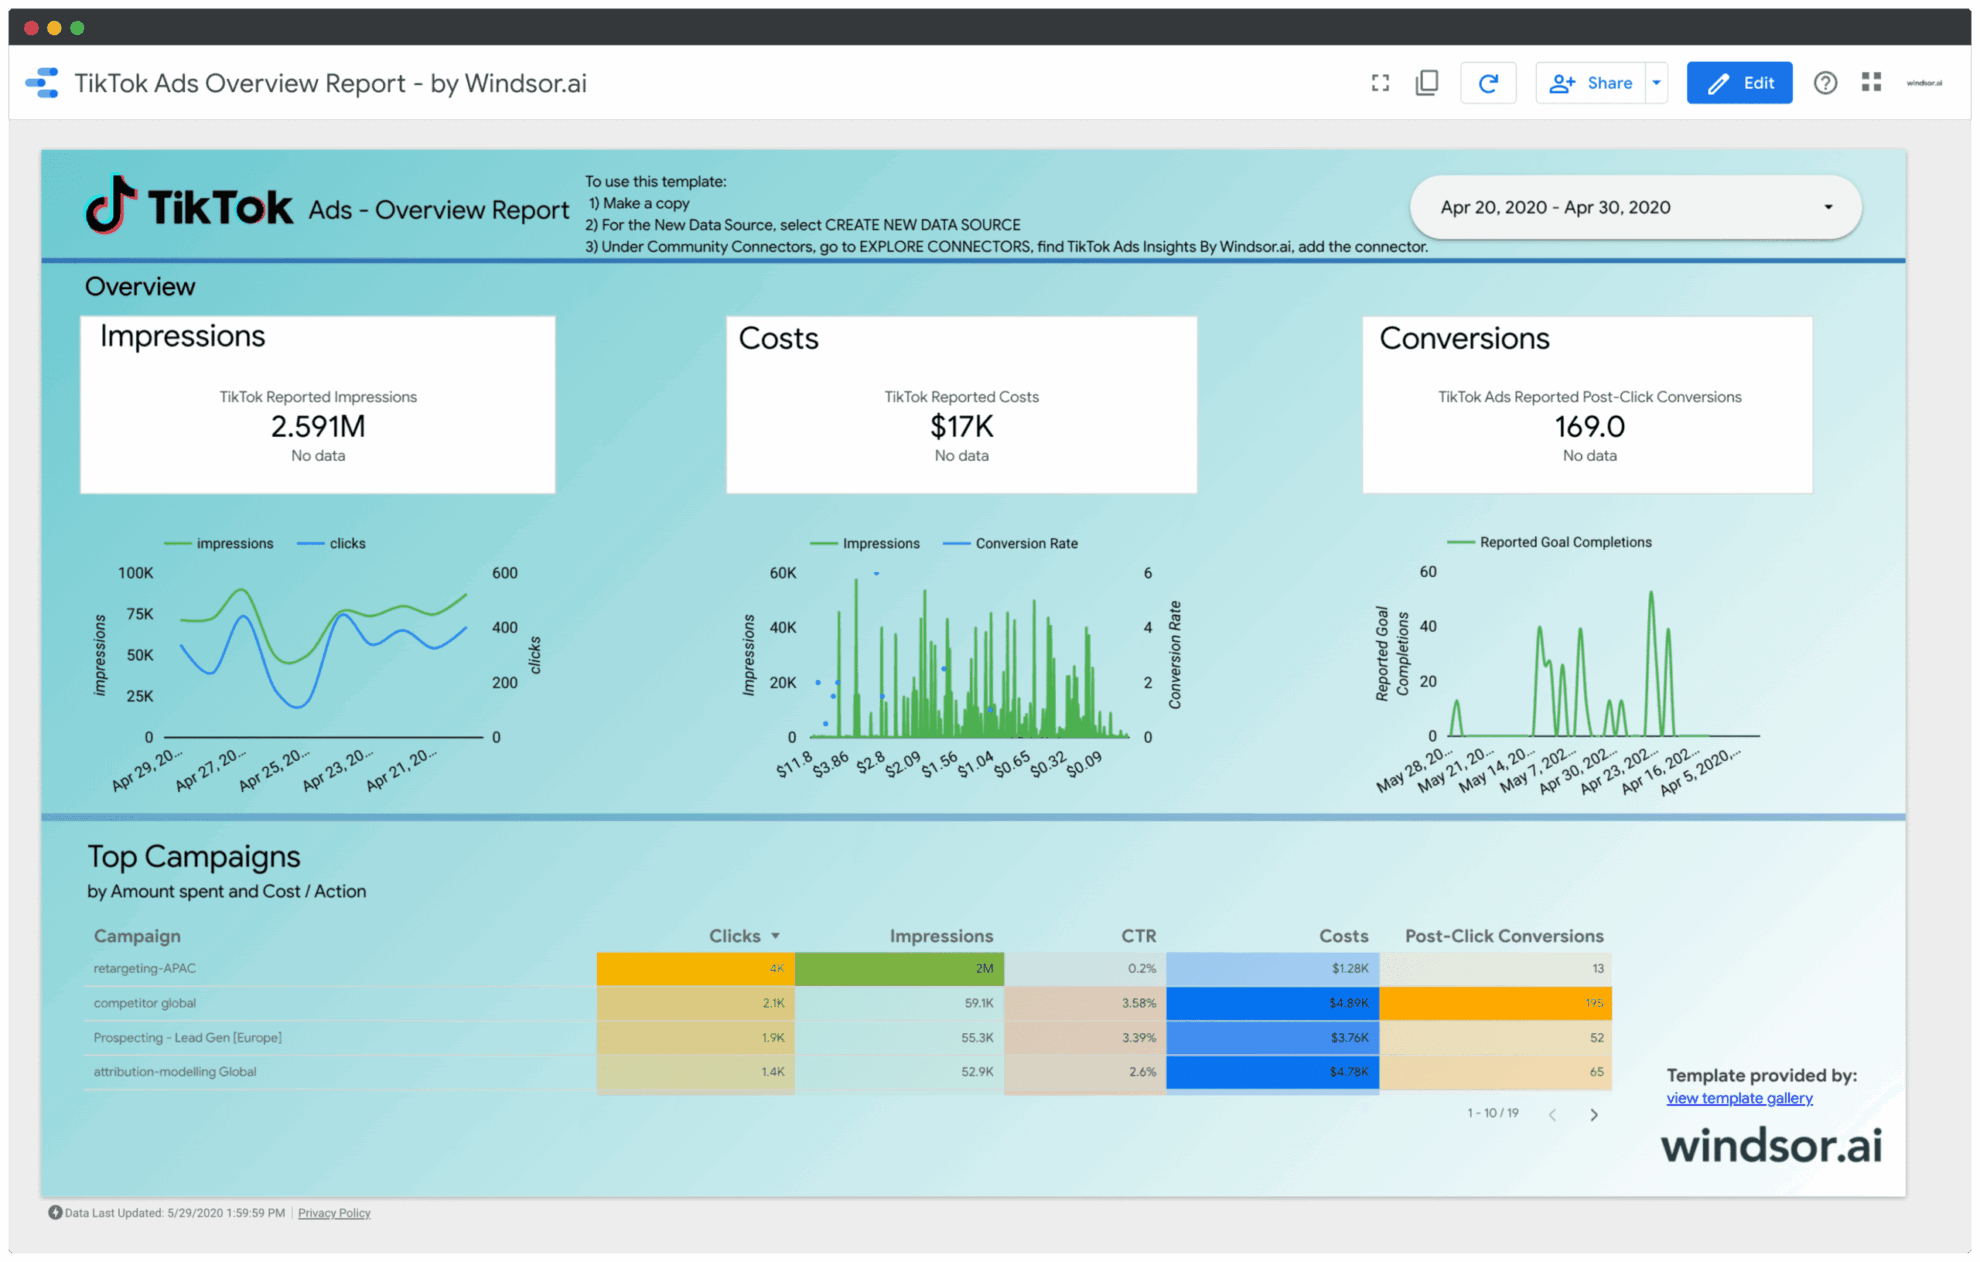
3. TikTok Ads Overview Report Template
- Try it now: Template link
- Connect your TikTok Ads data to Looker Studio
- Learn more about this template: Setup instructions
This TikTok Ads overview dashboard turns your campaign data into clear, actionable insights in Looker Studio by making charts that visualize reach, engagement, ad spend, and conversions, helping you quickly identify and scale high-performing TikTok campaigns.
Best for:
- Advertisers running TikTok performance campaigns
- Agencies delivering client-ready dashboards
- E-commerce teams running brand ads on TikTok
- Analysts testing creatives and audiences
Template components:
- Visibility: Reach, frequency, impressions
- Engagement: Clicks, likes, shares, comments, video views/VCR
- Efficiency: Spend, CPC, CPM, CPA, ROAS
- Conversions: add-to-cart, checkout, purchases (where configured)
- Breakdown by campaign, ad group, ad, audience, and placement
- Trend charts to spot daily/weekly shifts and seasonality
4. Google Ads Dashboard Template
- Try it now: Template link
- Connect your Google Ads data to Looker Studio
- Learn more about this template: Setup instructions
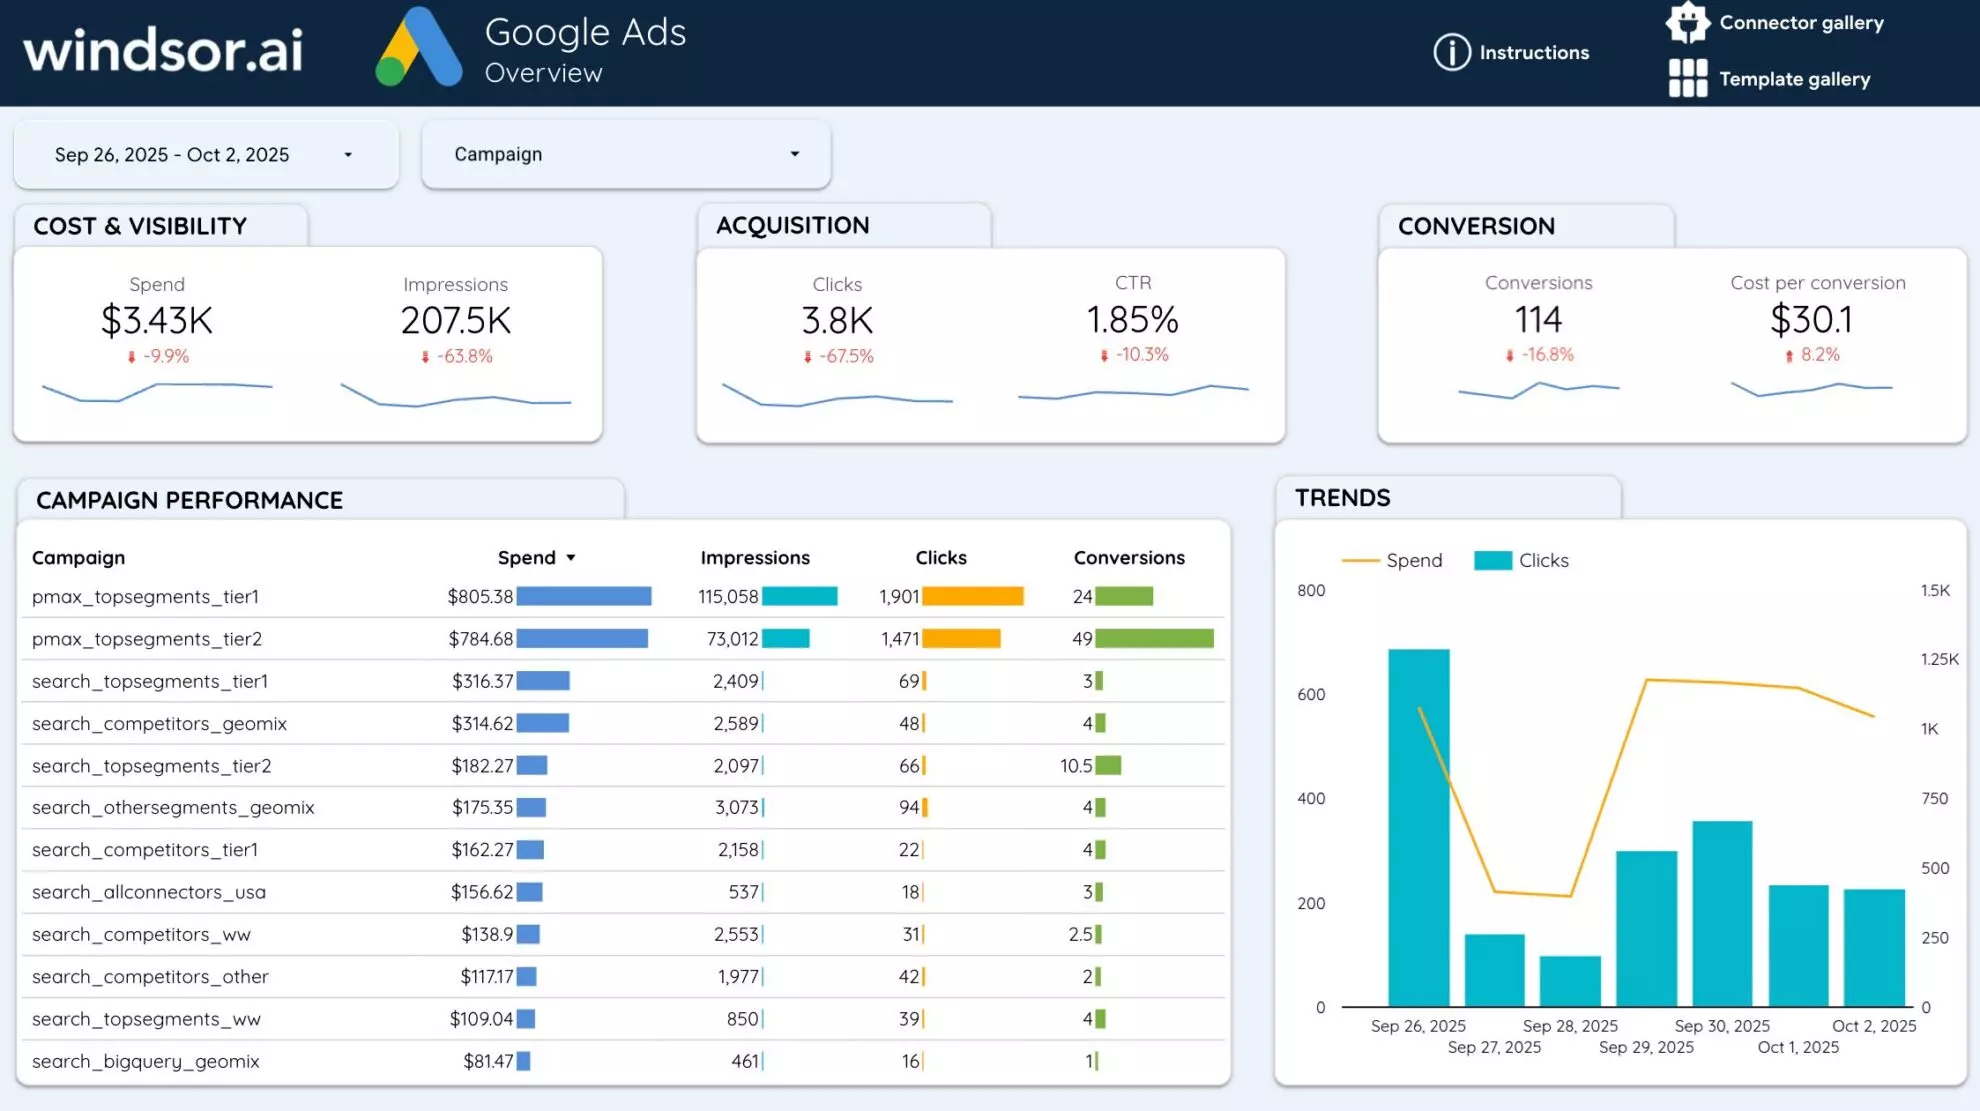
This Google Ads dashboard template example for Looker Studio by Windsor.ai centralizes your advertising performance into a clear, actionable view. It highlights cost, visibility, acquisition, and conversion metrics so you can evaluate campaign effectiveness. With visual trends and comprehensive campaign-level data, you can quickly spot high-performing ads, adjust bids, and optimize budgets for maximum ROI.
Best for:
- PPC managers tracking daily ad performance
- Marketing teams running multiple ad campaigns
- Agencies delivering client-ready Google Ads reporting in Looker Studio
- Business owners seeking clarity on ad spend and returns
Template components:
- Spend, CPM, impressions, CTR, CPC, and cost per conversion
- Campaign performance breakdown (spend, clicks, conversions)
- Trends in spend and clicks over time
- Conversion and other ad efficiency metrics
- Insights into underperforming campaigns
5. Google Ads vs Facebook Ads Comparison Dashboard Template
- Try it now: Template link
- Connect your Facebook Ads and Google Ads data to Looker Studio
- Learn more about this template: Setup instructions
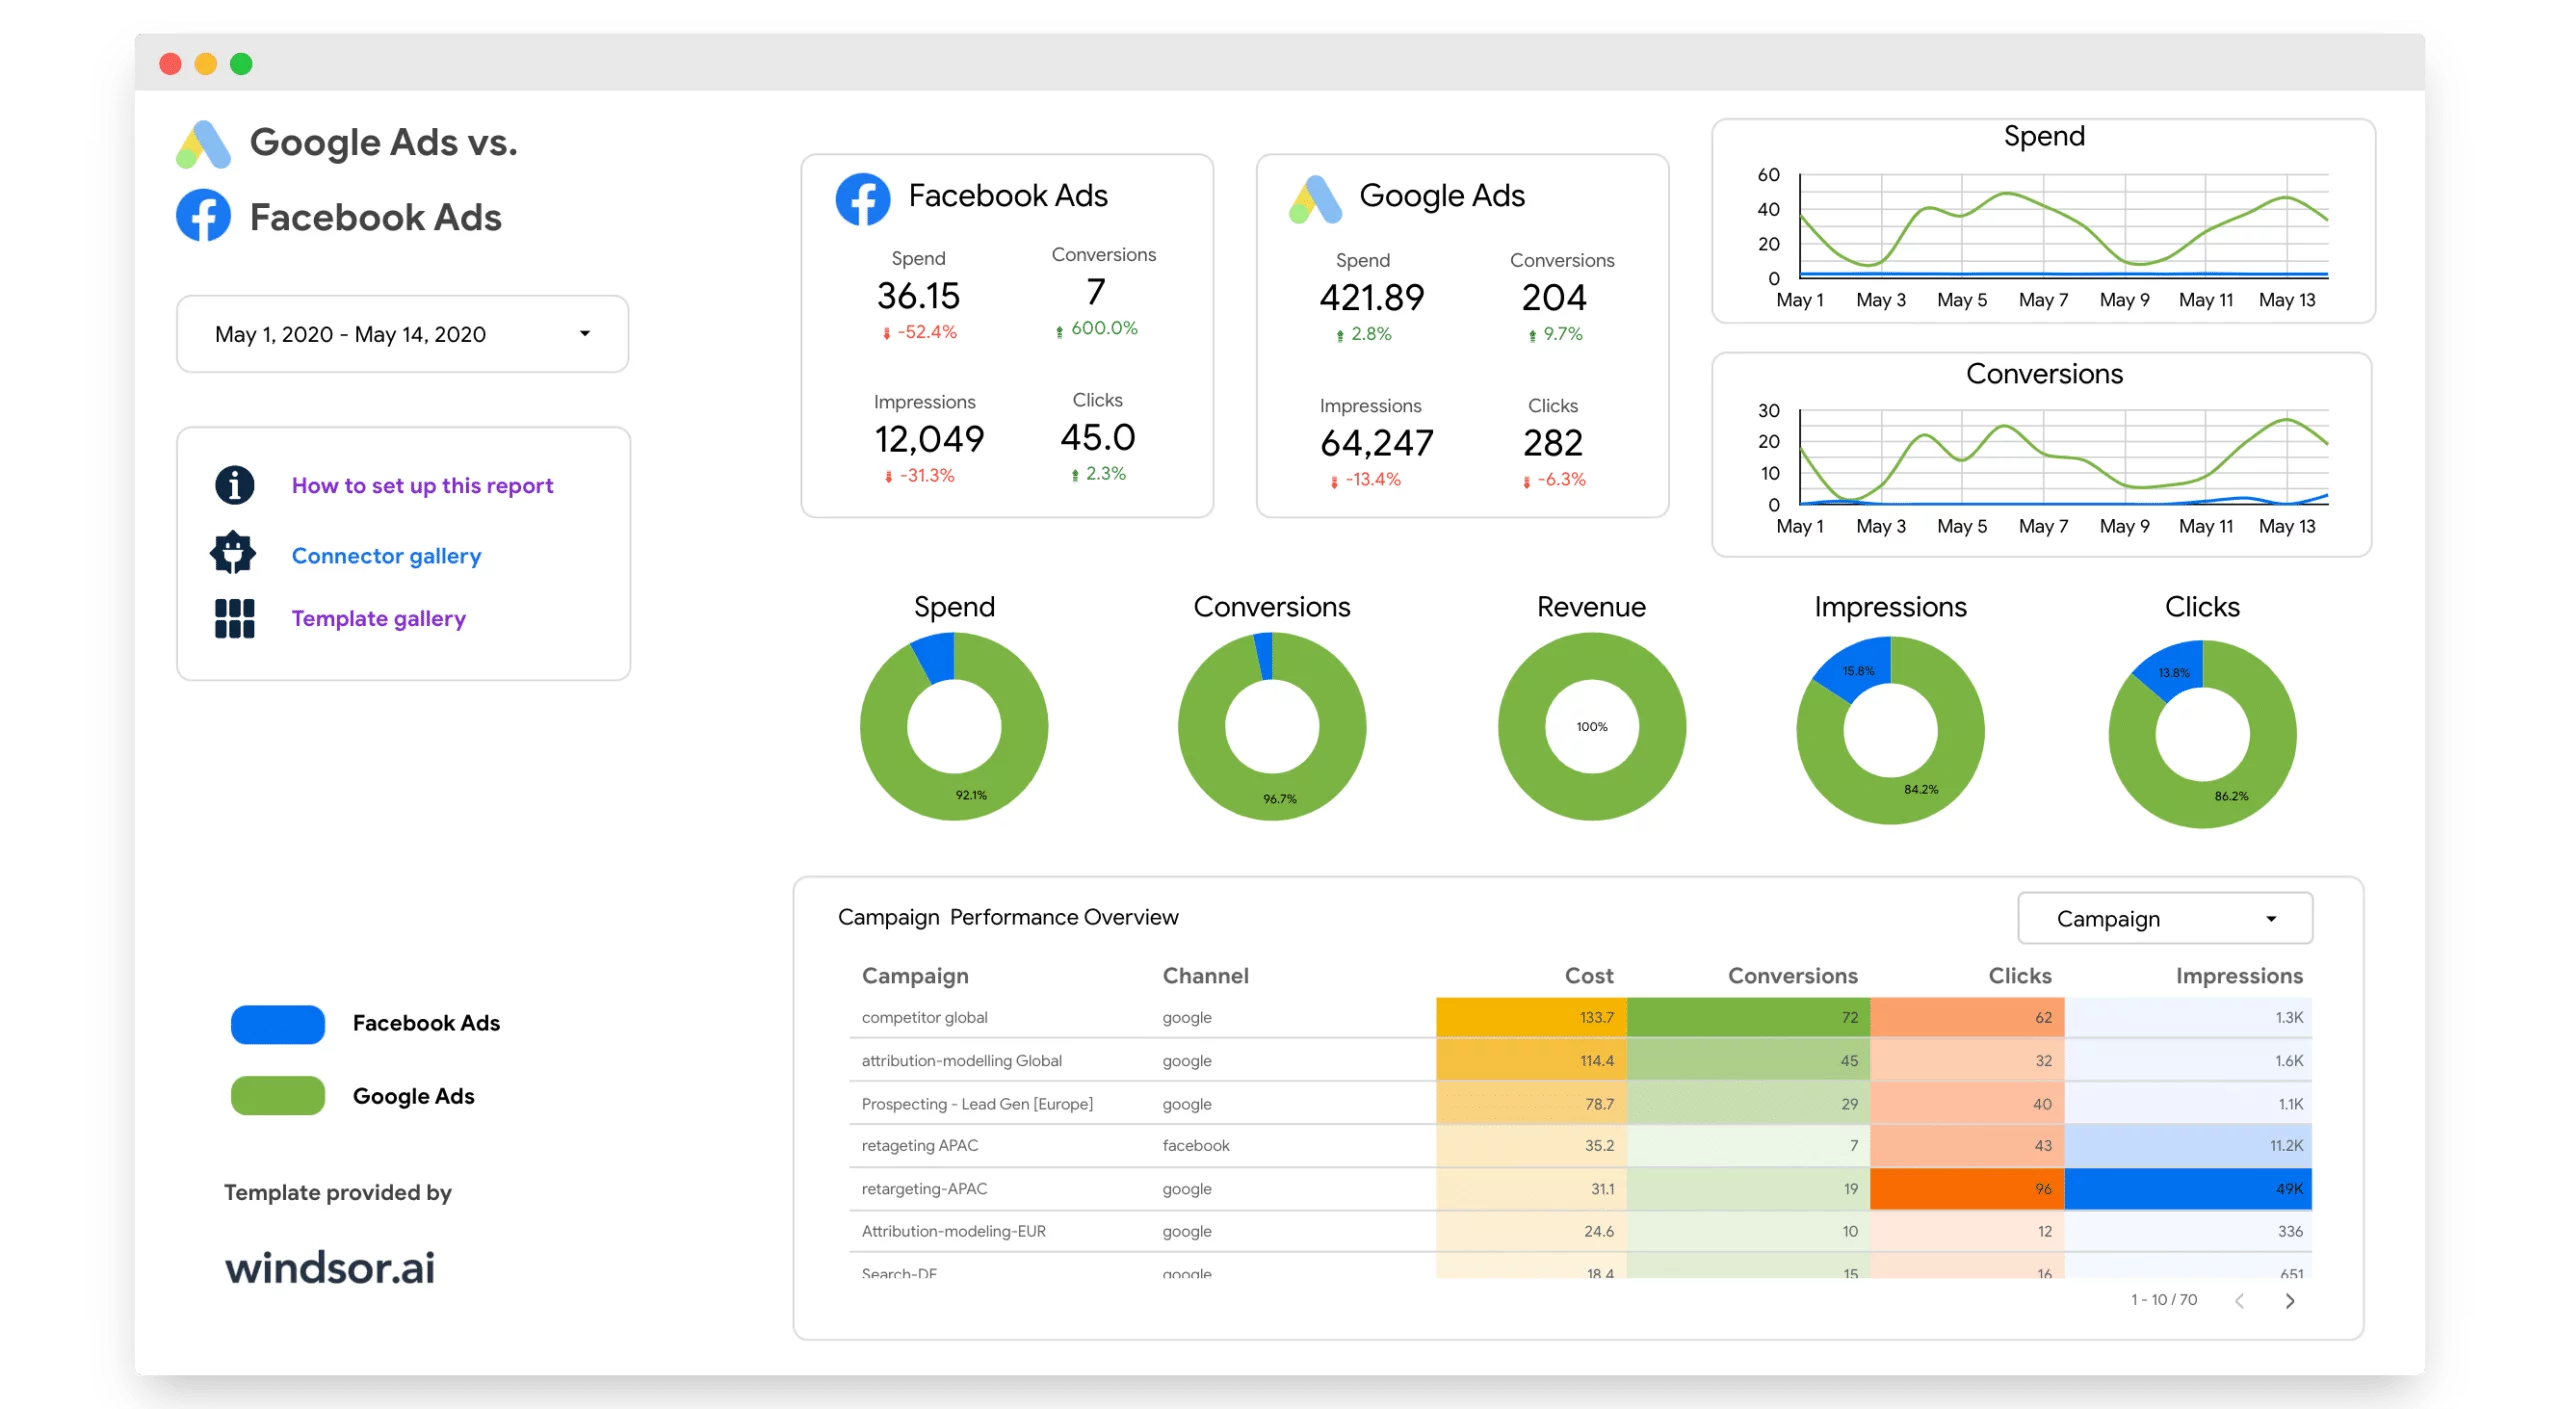
The Google Ads vs Facebook Ads Comparison Dashboard provides a clear side-by-side view of how your campaigns perform across both platforms. By consolidating spend, impressions, clicks, and conversions, it highlights which channel drives better ROI. This comparison allows you to quickly reallocate budgets, optimize bids, and refine targeting strategies for greater efficiency.
Best for:
- Digital marketers managing cross-channel campaigns
- Agencies reporting on paid media performance to clients
- Businesses deciding where to scale ad spend
- Teams seeking a unified ad performance view
Template components:
- Side-by-side KPIs: spend, conversions, clicks, impressions
- Trend charts for spend and conversions over time
- Revenue and conversion share by channel
- Campaign-level breakdown of cost, clicks, and results
6. Pinterest Ads Dashboard Template
- Try it now: Template link
- Connect your Pinterest Ads data to Looker Studio
- Learn more about this template: Setup instructions
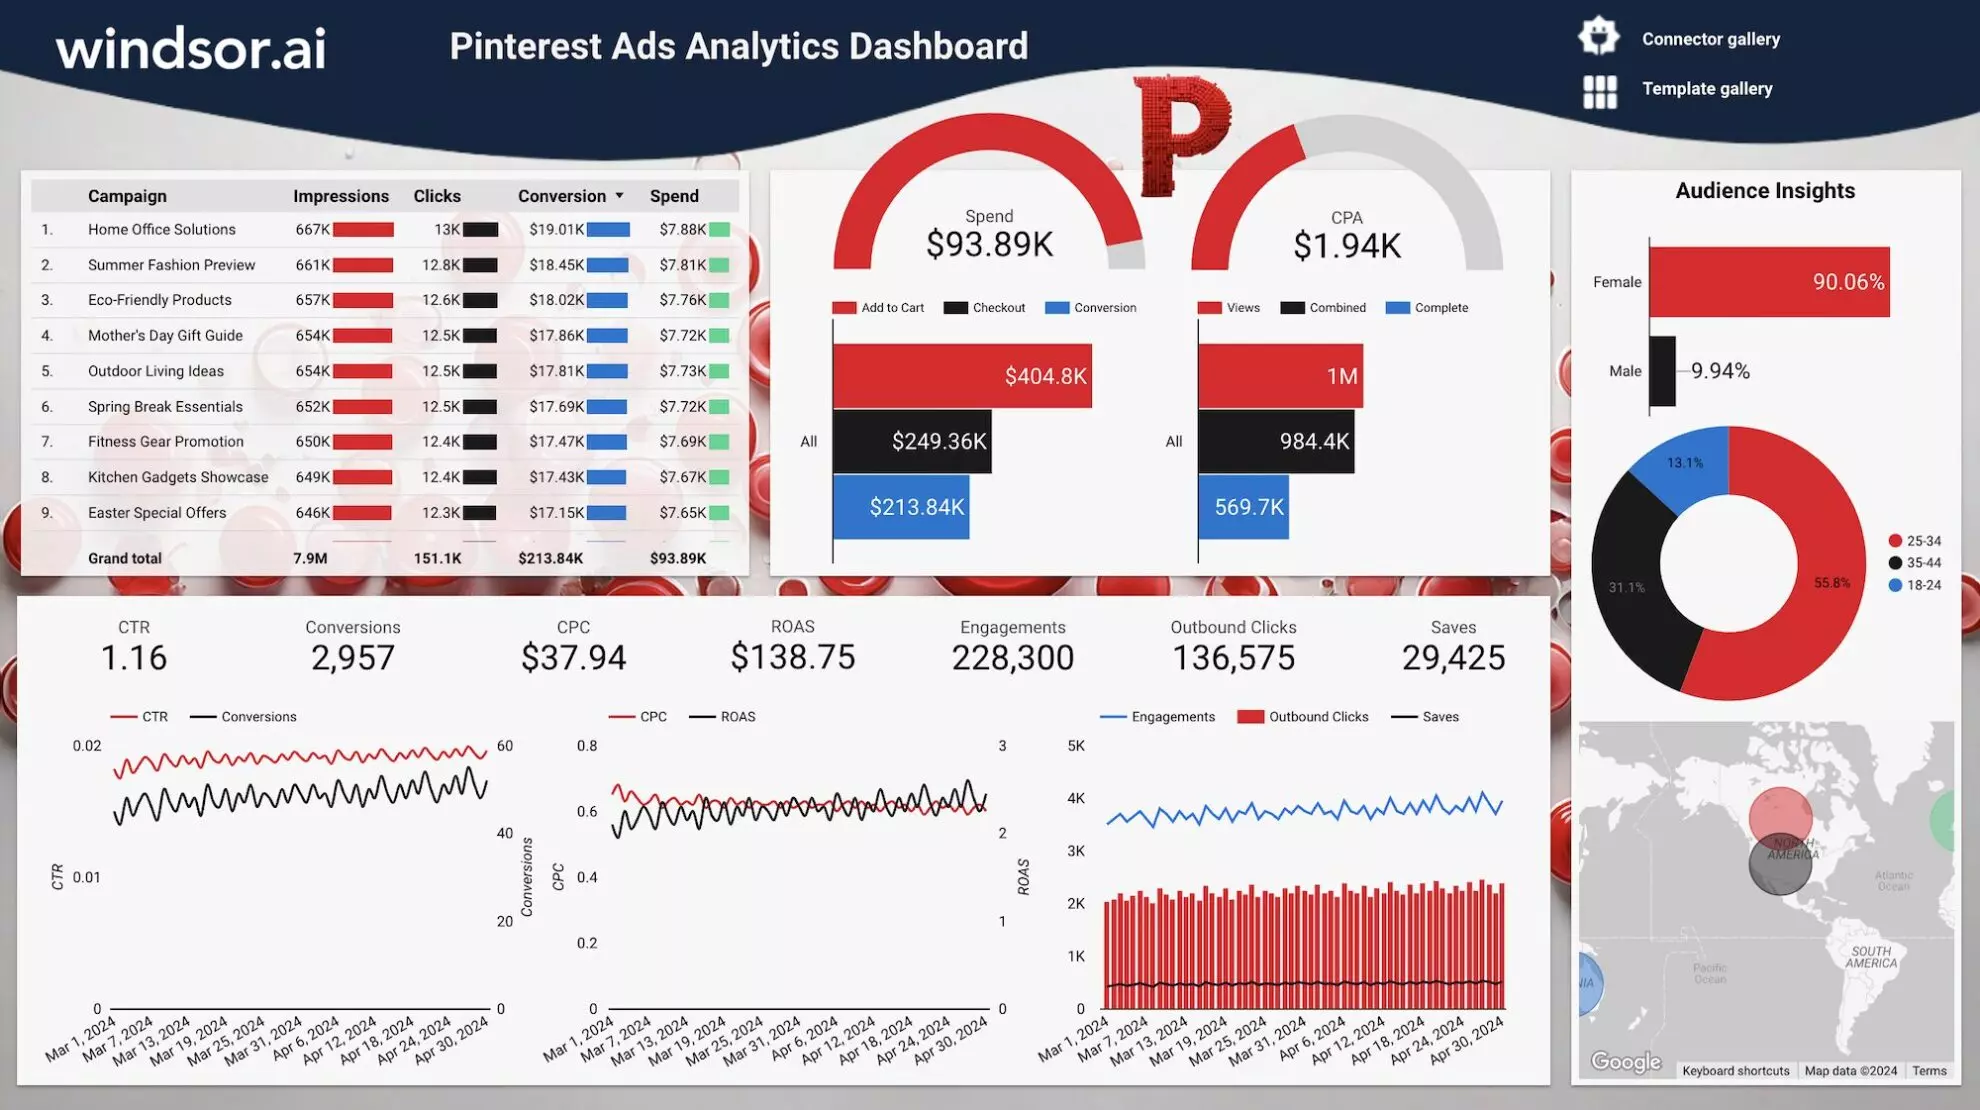
The Pinterest Ads Dashboard by Windsor.ai helps you track ad performance with clear, visual insights. It consolidates key metrics like impressions, clicks, conversions, cost per action (CPA), and return on ad spend (ROAS) into a single dashboard so you can easily evaluate campaign effectiveness, audience engagement, and spending efficiency. Use it to get actionable data to optimize Pinterest Ads targeting, reduce costs, and increase ROI.
Best for:
- E-commerce brands running visual ad campaigns
- Marketing teams tracking Pinterest campaign effectiveness
- Digital agencies managing multiple Pinterest Ads accounts
- Businesses aiming to maximize ad engagement and sales
Template components:
- Campaign-level metrics such as spend, clicks, conversions, CPA
- Audience insights by gender and age group
- Engagement breakdown, including saves, outbound clicks, and impressions
- Trend charts for CTR, CPC, and ROAS
- Geographic performance visualization
7. Snapchat Ads Dashboard Template
- Try it now: Template link
- Connect your Snapchat Ads data to Looker Studio
- Learn more about this template: Setup instructions
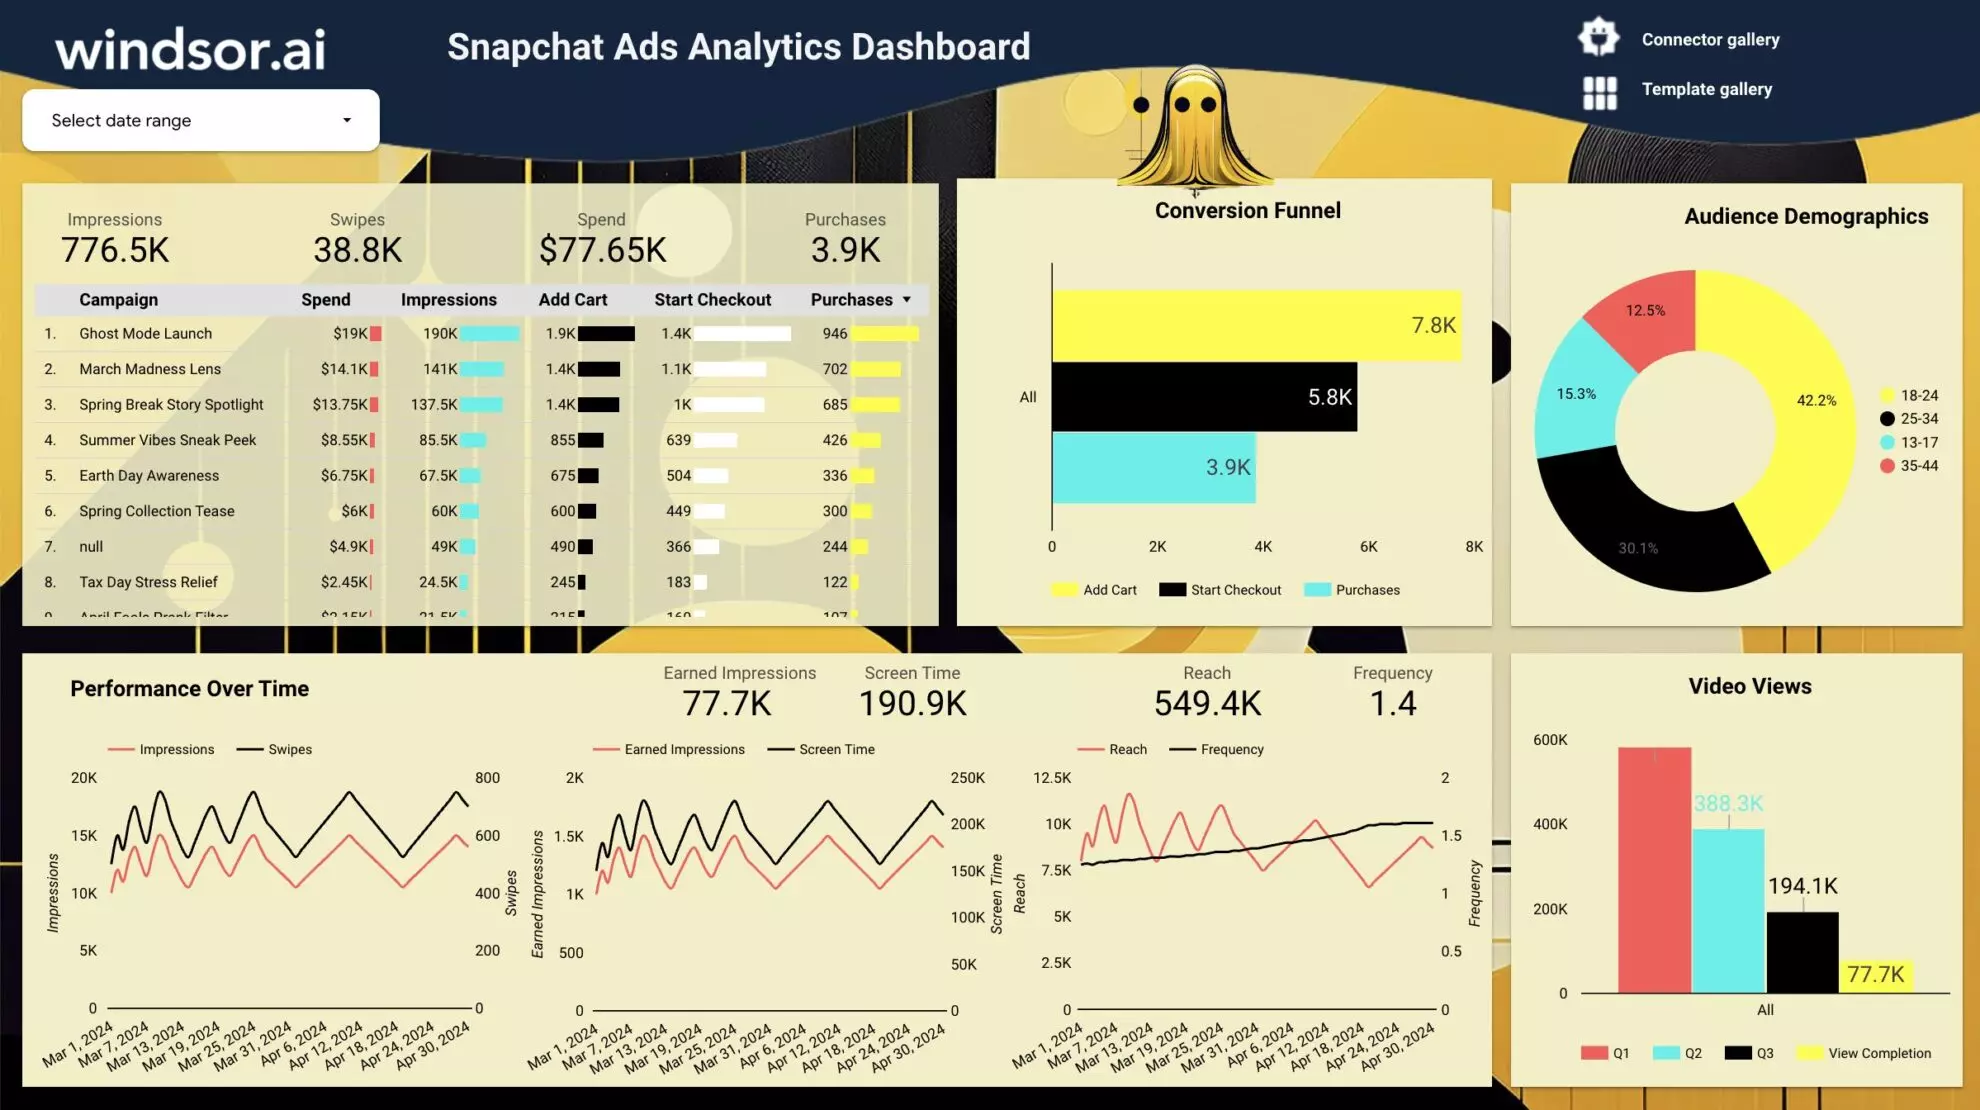
The Snapchat Ads Dashboard by Windsor.ai streamlines campaign tracking by consolidating key performance metrics into one view. It highlights impressions, swipes, ad spend, purchases, and funnel activity, allowing you to monitor ad effectiveness at every stage. With clear visuals and automated updates, the dashboard helps you cut reporting time and focus on optimizing ads for better reach, engagement, and conversions.
Best for:
- Brands running Snapchat campaigns
- Marketing teams optimizing ad spend
- Agencies managing multiple client accounts
- Businesses targeting younger demographics
Template components:
- Impressions, swipes, spend, and purchases by campaign
- Conversion funnel (add to cart, start checkout, purchases)
- Audience demographics by age and gender
- Performance trends over time
- Video views, earned impressions, screen time, and reach
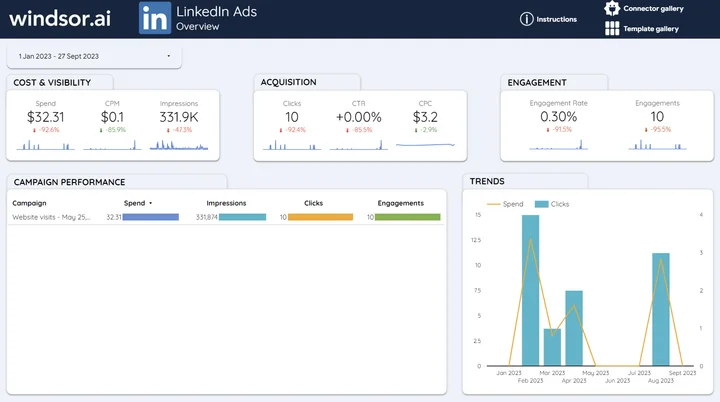
8. LinkedIn Ads Dashboard Template
- Try it now: Template link
- Connect your LinkedIn Ads data to Looker Studio
- Learn more about this template: Setup instructions
This LinkedIn Ads dashboard example by Windsor.ai centralizes LinkedIn paid media data into a single view to help marketers understand spend efficiency, ad visibility, and engagement across all their campaigns.
Best for:
- B2B marketers running LinkedIn ad campaigns
- Agencies reporting ad performance to clients
- Teams monitoring paid media spend and ROI on LinkedIn
Template components:
- Reach & spend: Spend, CPM, impressions, clicks
- Engagement & efficiency: CTR, CPC, reactions
- Performance breakdown: Campaign-level analytics
-
Trends & outcomes: Spend and conversions over time
- Audience insights: impressions by country, industry, job title, and company size
Best Looker Studio dashboard examples for organic social media analytics
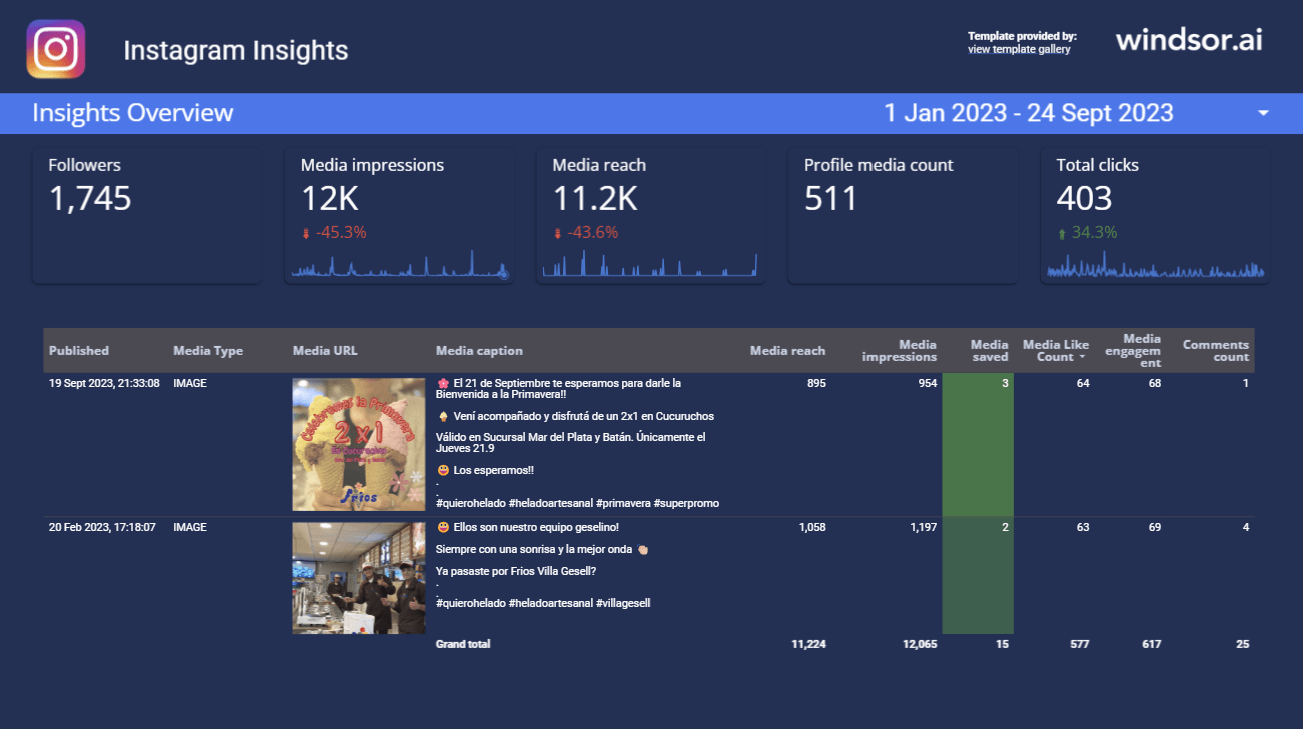
1. Instagram Insights Overview Report Template
- Try it now: Template link
- Connect your Instagram Organic data to Looker Studio
- Learn more about this template: Setup instructions
This Instagram Insights Overview Report offers a concise snapshot of organic account performance, enabling brands to monitor profile growth and activity. It consolidates follower count, impressions, reach, profile visits, and engagement metrics into a centralized view. Analyze post performance and understand what content resonates with your target audience to optimize your social media content plan.
Best for:
- Small businesses looking to track their organic performance on Instagram
- Marketers optimizing Instagram content and campaigns
- Individual creators and bloggers analyzing engagement trends
- Agencies reporting performance to clients
Template components:
- Follower growth and profile visits
- Media reach and impressions
- Post reactions (likes, saves, comments)
- Content performance by type (photos, videos, stories)
- Insights to improve posting times and formats
2. Facebook Page Insights Overview Report Template

- Try it now: Template link
- Connect your Facebook Page data to Looker Studio
- Learn more about this template: Setup instructions
This Facebook Page Insights dashboard example for Looker Studio transforms raw engagement data into actionable insights. It tracks how users interact with your Facebook page and content, helping you refine posts and campaigns for better reach, engagement, and conversions.
Best for:
- Social media teams managing brand pages
- Businesses analyzing their audience engagement
- Agencies reporting organic Facebook performance to clients
- Bloggers measuring the organic performance of their Facebook profiles
Template components:
- Engagement & reach: Page-level metrics like profile reach, likes, reactions
- Campaign effectiveness: CTR, ROAS
- Audience & revenue insights: Behavior trends, revenue trends
- Channel comparison: Organic vs. paid results
Best Looker Studio dashboard examples for website and SEO tracking
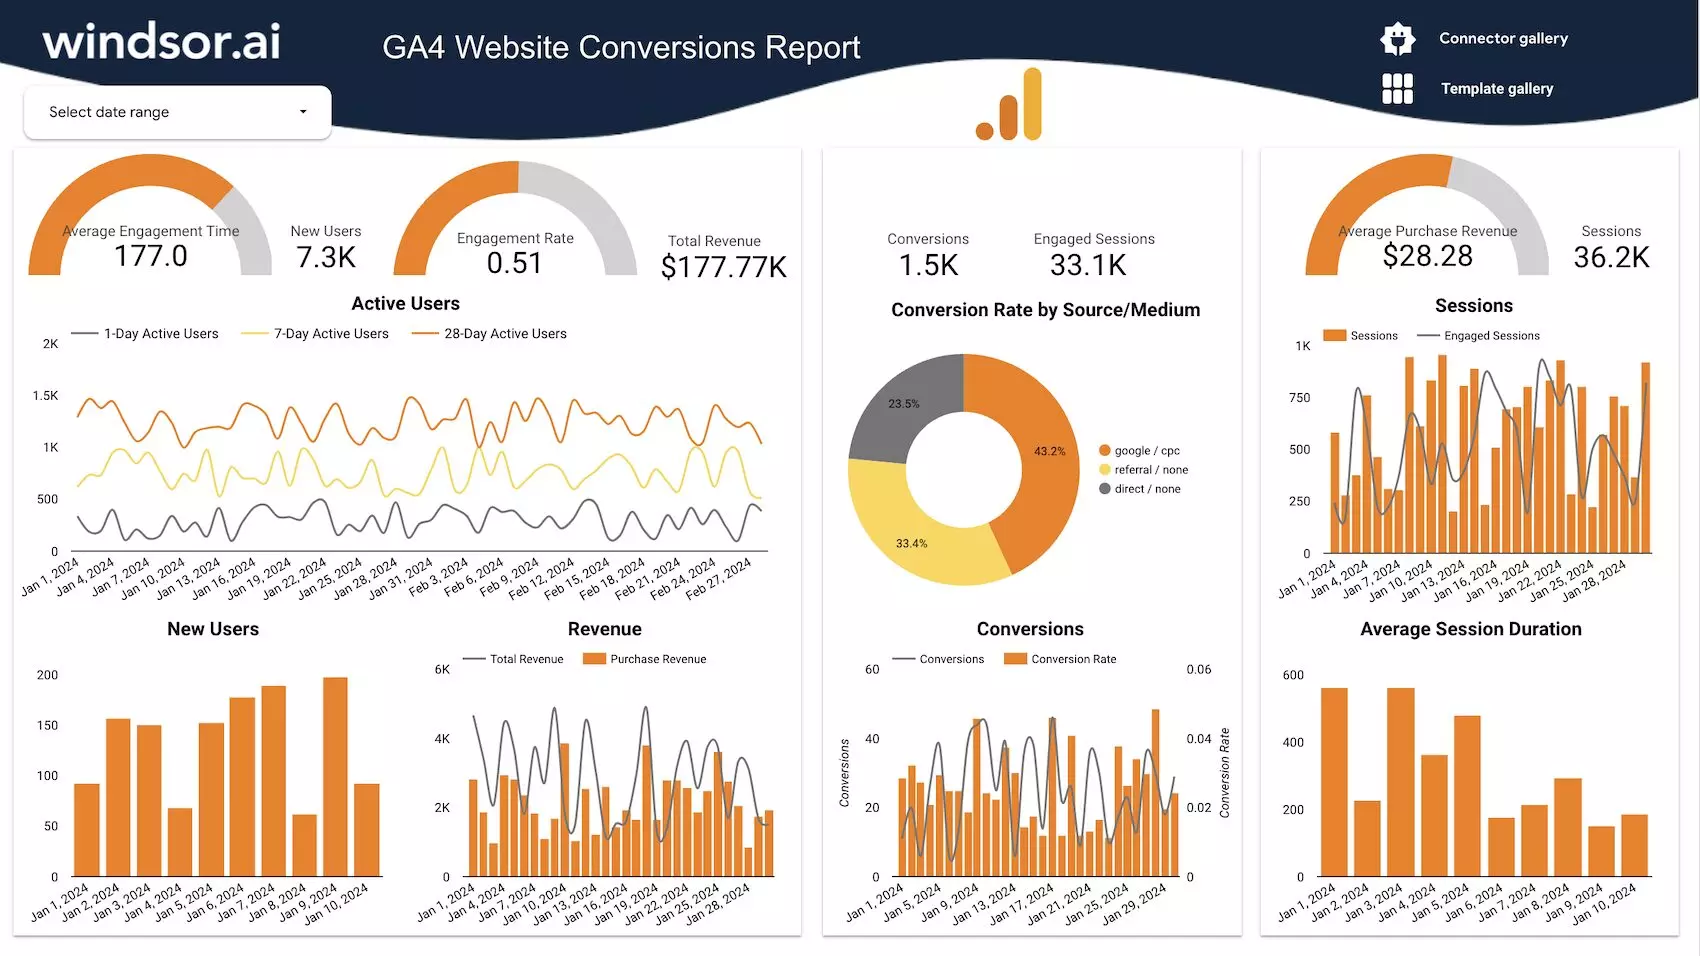
1. Google Analytics 4 (GA4) Website Conversions Report
- Try it now: Template link
- Connect your Facebook Page data to Looker Studio
- Learn more about this template: Setup instructions
This GA4 Conversions Dashboard by Windsor.ai turns complex website data into clear performance metrics. It highlights user engagement, conversion rates, and revenue, helping teams understand how their marketing efforts drive sales outcomes through the website.
Best for:
- Marketing teams tracking web conversions
- E-commerce managers optimizing marketing campaigns
- Agencies generating client-ready web analytics reports at scale
Template components:
- Number of active users and their engagement time on site
- Conversion rates by source/medium
- Revenue, purchase value, and session data
- Sales funnel with real-time tracking
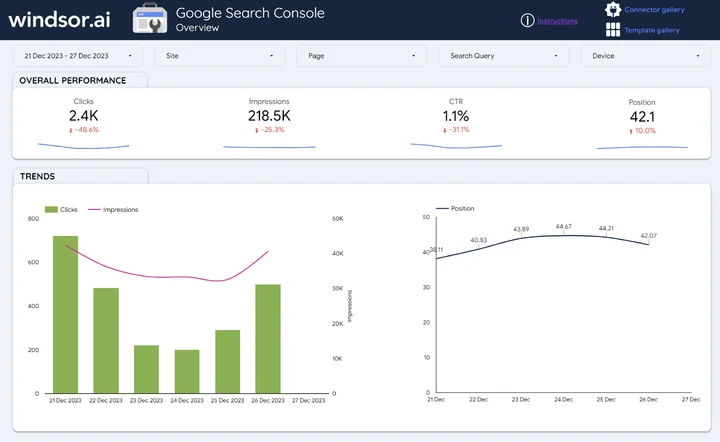
2. SEO Report Dashboard Template
- Try it now: Template link
- Connect your Google Search Console data to Looker Studio
- Learn more about this template: Setup instructions
The SEO Report Dashboard by Windsor.ai uses Google Search Console data to show how your site performs in search. It reveals trends in website clicks, impressions, CTR, and rankings, helping SEO teams act quickly on visibility gaps.
Best for:
- SEO specialists tracking organic growth
- Marketing and link building agencies reporting to clients
- Businesses wanting to understand keyword performance
Template components:
- Keyword rankings and CTR trends
- Clicks and impressions by page/query
- Device and geo-based performance
- Average website position over time
3. Google Business Profile (Google My Business) Dashboard Template

- Try it now: Template link
- Connect your Google My Business data to Looker Studio
- Learn more about this template: Setup instructions
The Google My Business Dashboard by Windsor.ai is designed to show how customers engage with your business listings on the web. It tracks visibility, reviews, direction requests, and clicks, enabling local businesses to optimize their presence on Google.
Best for:
- Local businesses and franchises
- Agencies managing multiple business listings
- Marketers improving local SEO visibility
Template components:
- Listing impressions split by desktop and mobile
- Clicks, calls, and direction requests
- Reviews and engagement rates
- Local search visibility trends
4. Google Keyword Rank Tracking Dashboard Template
![]()
- Try it now: Template link
- Connect your keyword data to Looker Studio
- Learn more about this template: Setup instructions
The Keyword Rank Tracking Dashboard by Windsor.ai helps monitor your website keyword positions, clicks, and impressions. It uses Google Search Console data and turns it into easy-to-interpret reports that guide SEO strategies and content planning.
Best for:
- SEO professionals tracking keyword rankings
- Marketing agencies delivering keyword reports
- Businesses optimizing website marketing strategies
Template components:
- Keyword positions with clicks and CTR
- Impressions, clicks, and click-through trends
- Keyword performance by country and device
- Competitor insights
Best Looker Studio dashboard examples for e-commerce and sales analytics
1. Shopify Sales Funnel Dashboard Template
- Try it now: Template link
- Connect your Shopify data to Looker Studio
- Learn more about this template: Setup instructions
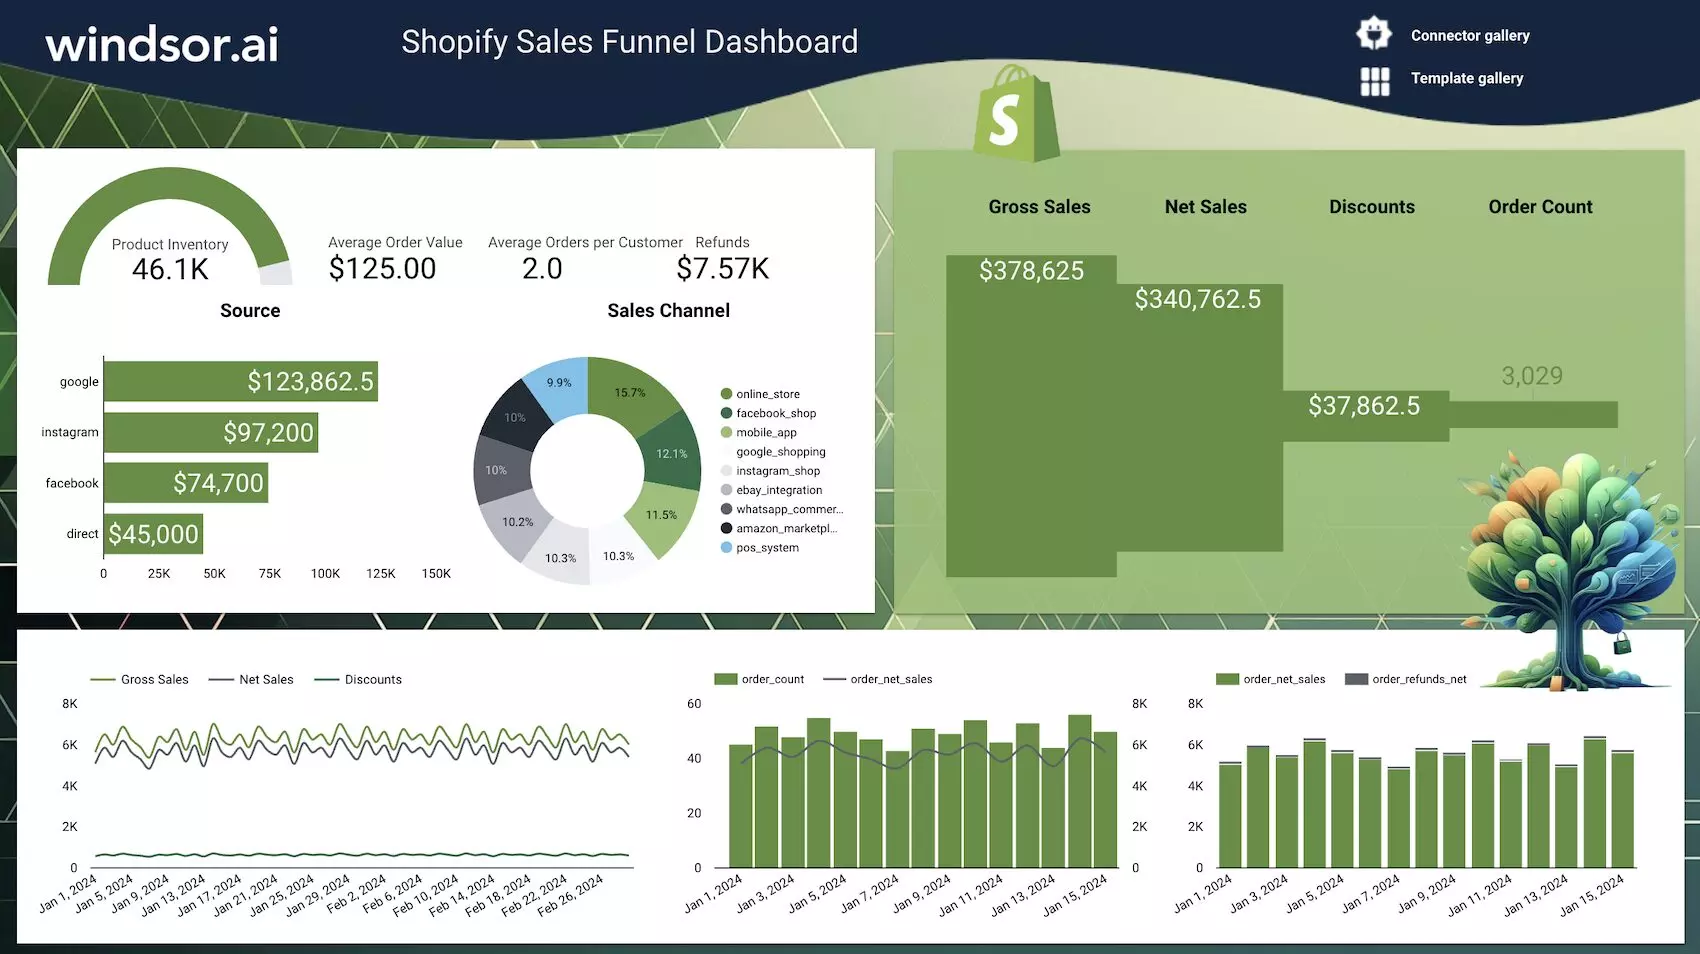
The Shopify sales funnel dashboard example by Windsor.ai tracks your Shopify store’s revenue, orders, and customer behavior across different channels. It visualizes your sales funnel to help identify the most profitable sources and bottlenecks.
Best for:
- E-commerce managers and business owners tracking store performance
- Marketing teams optimizing ROI
- Agencies delivering client reporting
Template components:
- Gross and net sales with discounts/refunds
- Sales by channel (Google, Instagram, Facebook, etc.)
- Order count, AOV, and product inventory
- Funnel performance and revenue trends
2. Stripe Analytics Dashboard Template
- Try it now: Template link
- Connect your Stripe data to Looker Studio
- Learn more about this template: Setup instructions
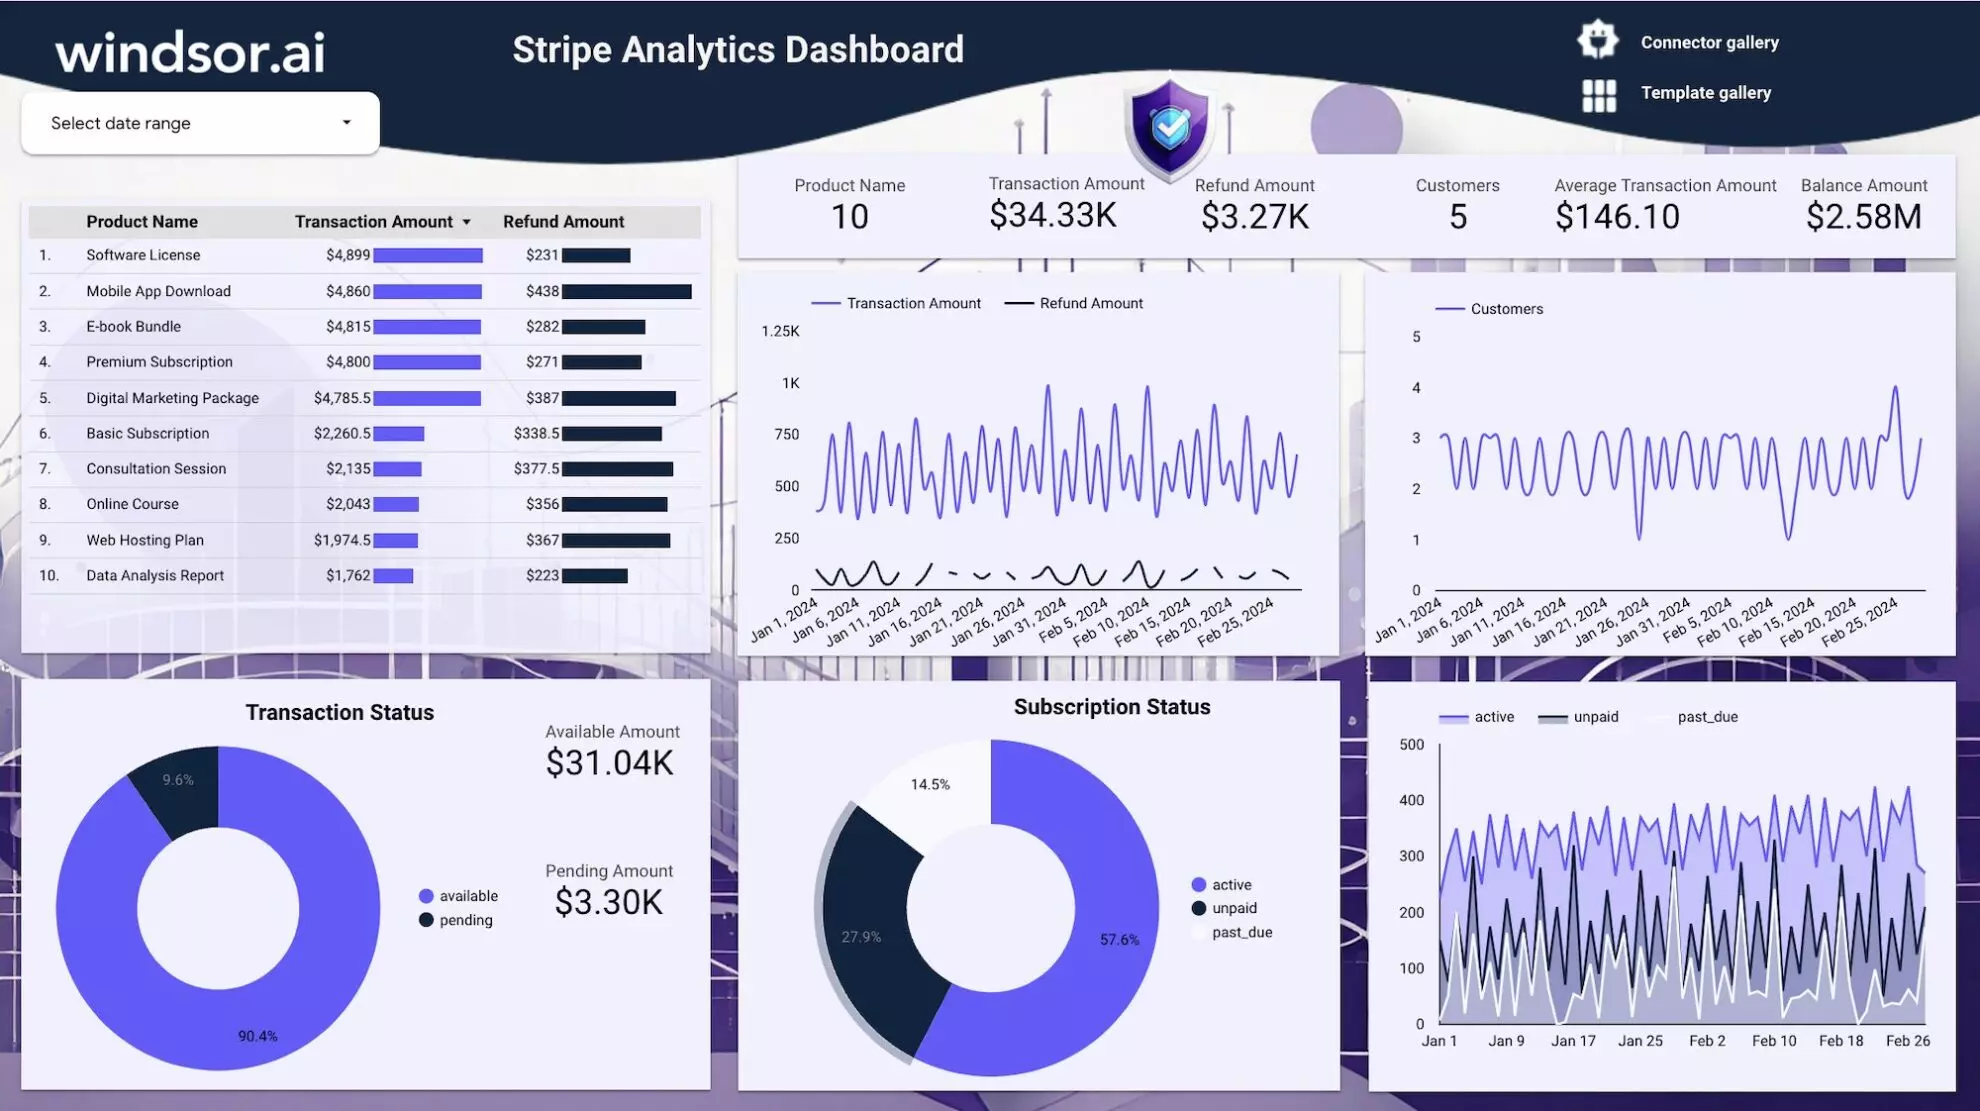
The Stripe Analytics Dashboard by Windsor.ai provides real-time visibility into revenue, refunds, subscription activity, and customer behavior. With interactive charts and metrics, you can easily spot trends in payments, identify refund issues, and monitor cash flow. By automating reporting in Looker Studio, Windsor.ai saves time and helps finance and business teams make faster, data-driven decisions.
Best for:
- Finance teams monitoring payment health
- SaaS businesses tracking subscription trends
- E-commerce owners managing online transactions
- Agencies providing client payment reporting
Template components:
- Transaction and refund amounts by product
- Gross revenue, available vs. pending balances
- Customer activity and subscription status (active, unpaid, past due)
- Trends in transactions, payouts, and refunds
- Insights into cash flow and retention
3. Amazon Seller Central Overview Report Template
- Try it now: Template link
- Connect your Amazon Seller Central data to Looker Studio
- Learn more about this template: Setup instructions
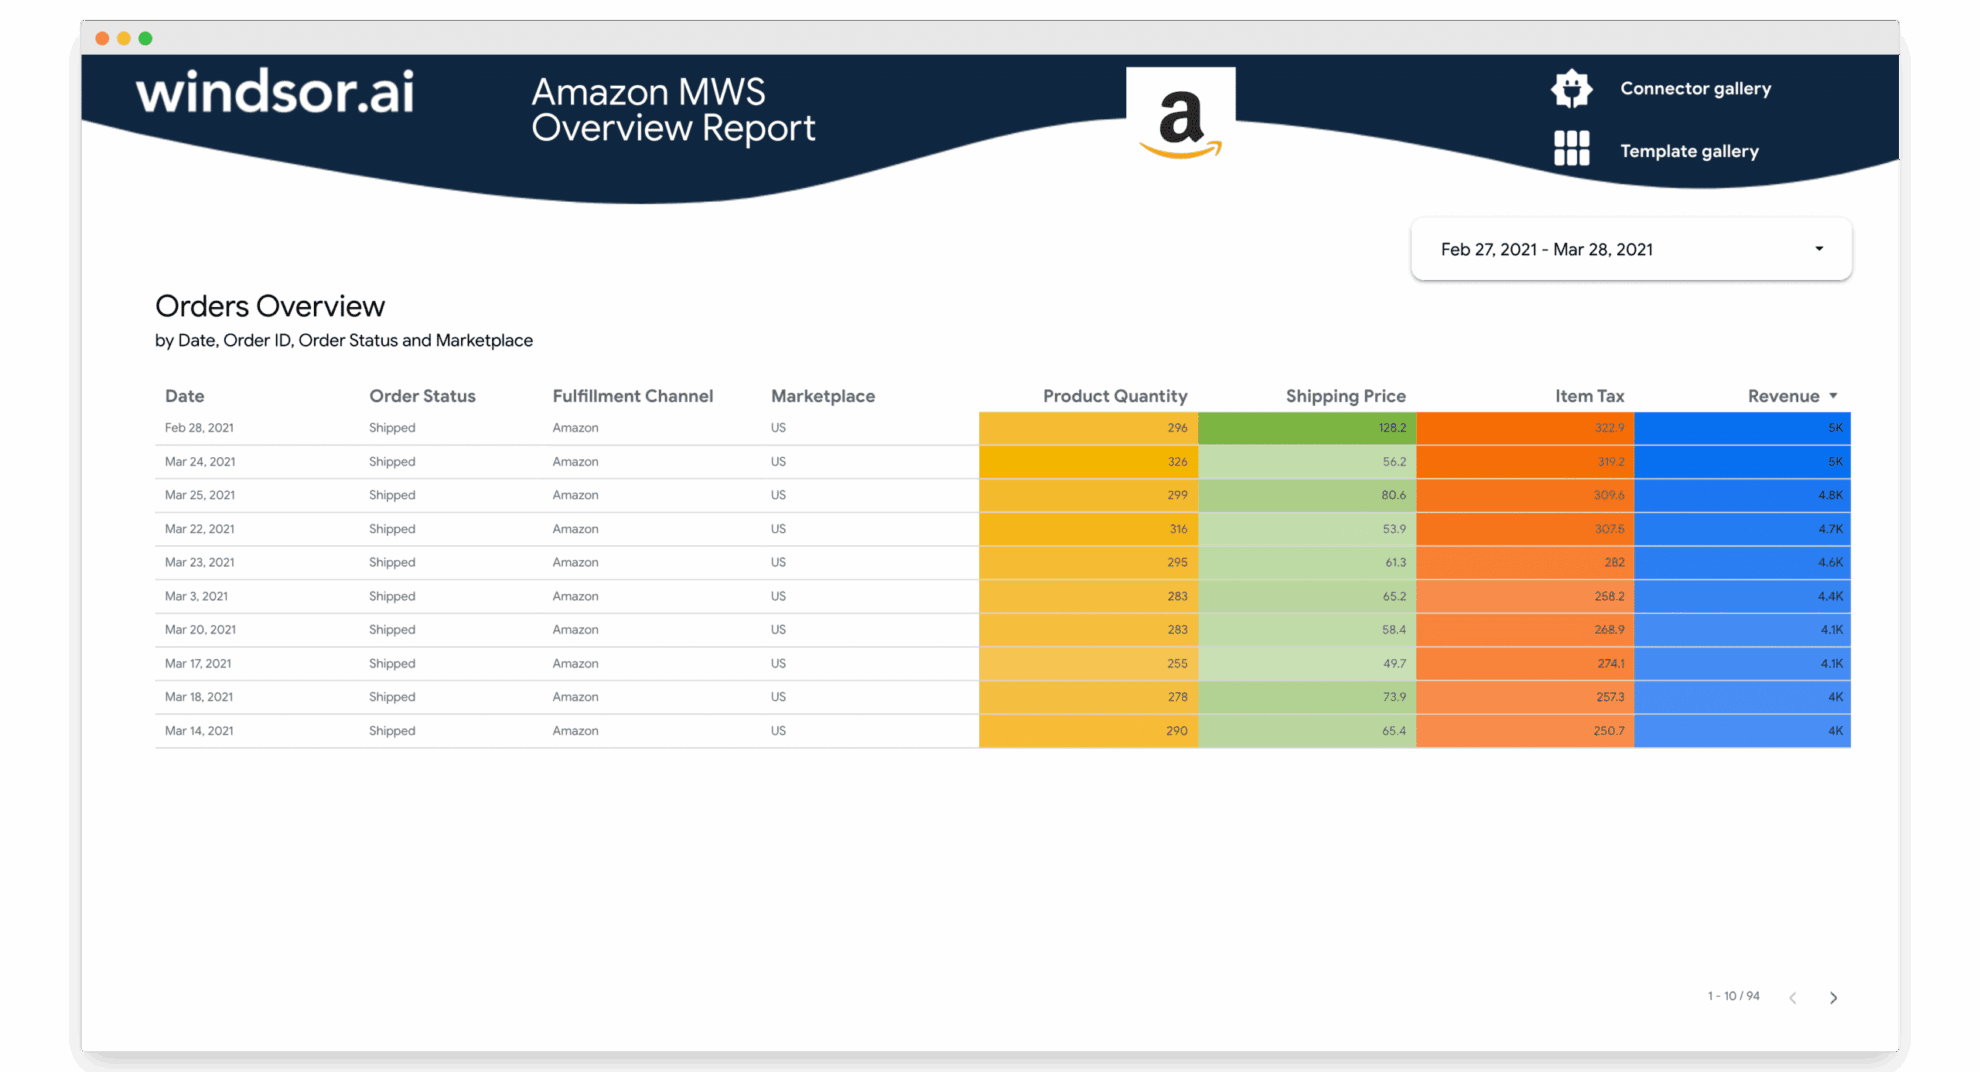
This Windsor’s Looker Studio dashboard example for Amazon Seller Central streamlines order-level reporting by giving sellers full visibility into product quantities, shipping costs, item taxes, and total revenue. Instead of manually pulling data from your Amazon store, this dashboard automates reporting based on the most essential metrics, making it easier to track performance trends and optimize operations.
Best for:
- Amazon FBA and FBM sellers monitoring sales performance
- E-commerce teams managing multiple SKUs and marketplaces
- Agencies reporting on Amazon store performance for clients
- Finance teams analyzing revenue, costs, and fulfillment data
Template components:
- Order status and fulfillment channel details
- Product quantity, shipping price, item tax, and revenue
- Marketplace-level sales trends
- Granular order insights for better forecasting and cost control
4. Cross-Channel E-Commerce Overview Report Template (GA4, Google Ads, Bing Ads, Pinterest Ads, Meta Ads)
- Try it now: Template link
- Connect your GA4, Google Ads, Bing Ads, Pinterest Ads, Facebook Ads data to Looker Studio
- Learn more about this template: Setup instructions
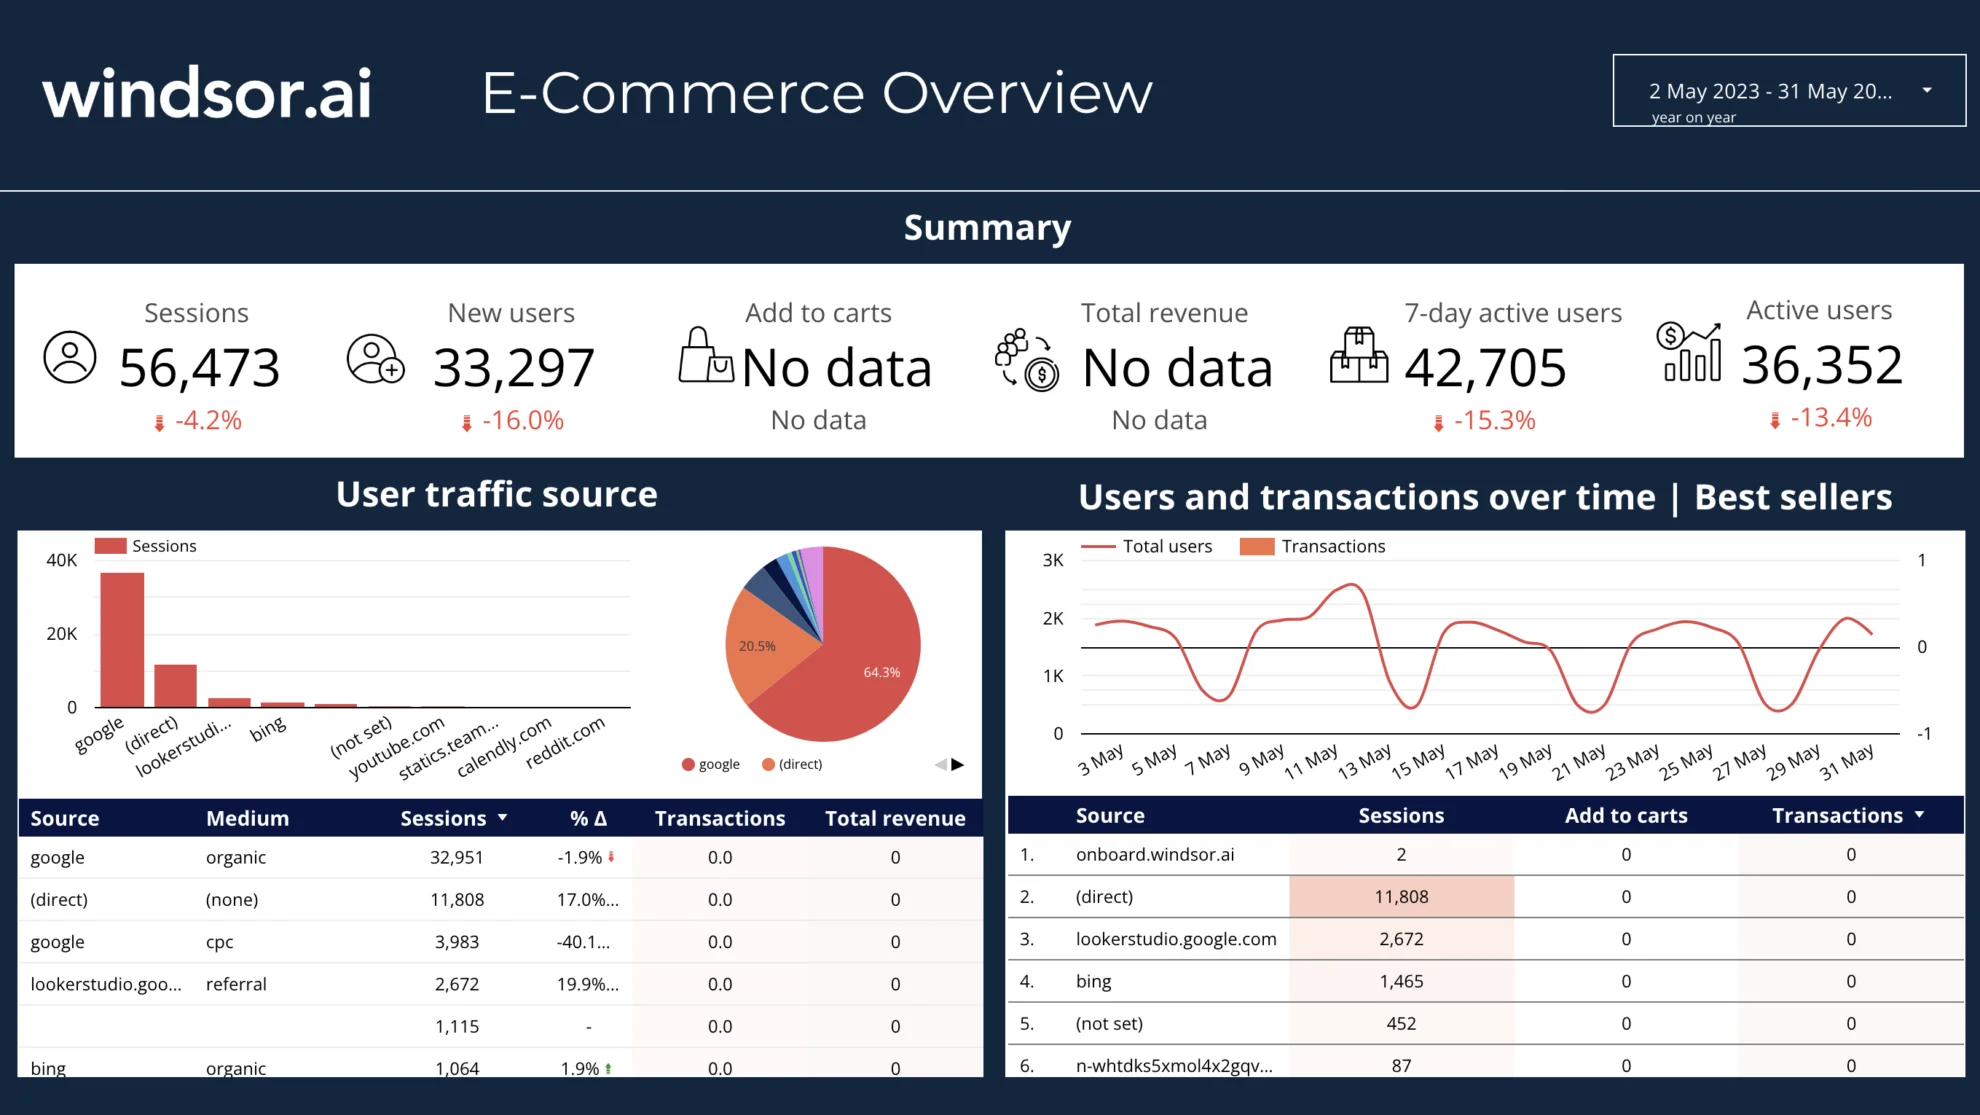
The E-Commerce Overview Report by Windsor.ai brings GA4 and paid media data into one Looker Studio dashboard for a comprehensive cross-channel analysis. It provides a complete view of traffic, user behavior, and ad performance, allowing you to quickly identify which channels drive the most sales. Instead of switching between multiple dashboards, you get a unified snapshot of cross-platform performance to refine both organic and paid campaigns and maximize ROI.
Best for:
- E-commerce brands running multi-channel marketing campaigns
- Marketing managers tracking organic vs paid performance results
- Agencies delivering cross-channel client reporting
- Business owners monitoring store revenue and traffic sources
Template components:
- Sessions, active users, and new users
- User traffic source breakdown (organic, paid, referral, direct)
- Transactions, add-to-cart, and revenue metrics
- Cross-channel ad performance
- Trend lines for users, conversions, and sales by channel over time
Best Looker Studio dashboard examples for CRM tracking and analytics
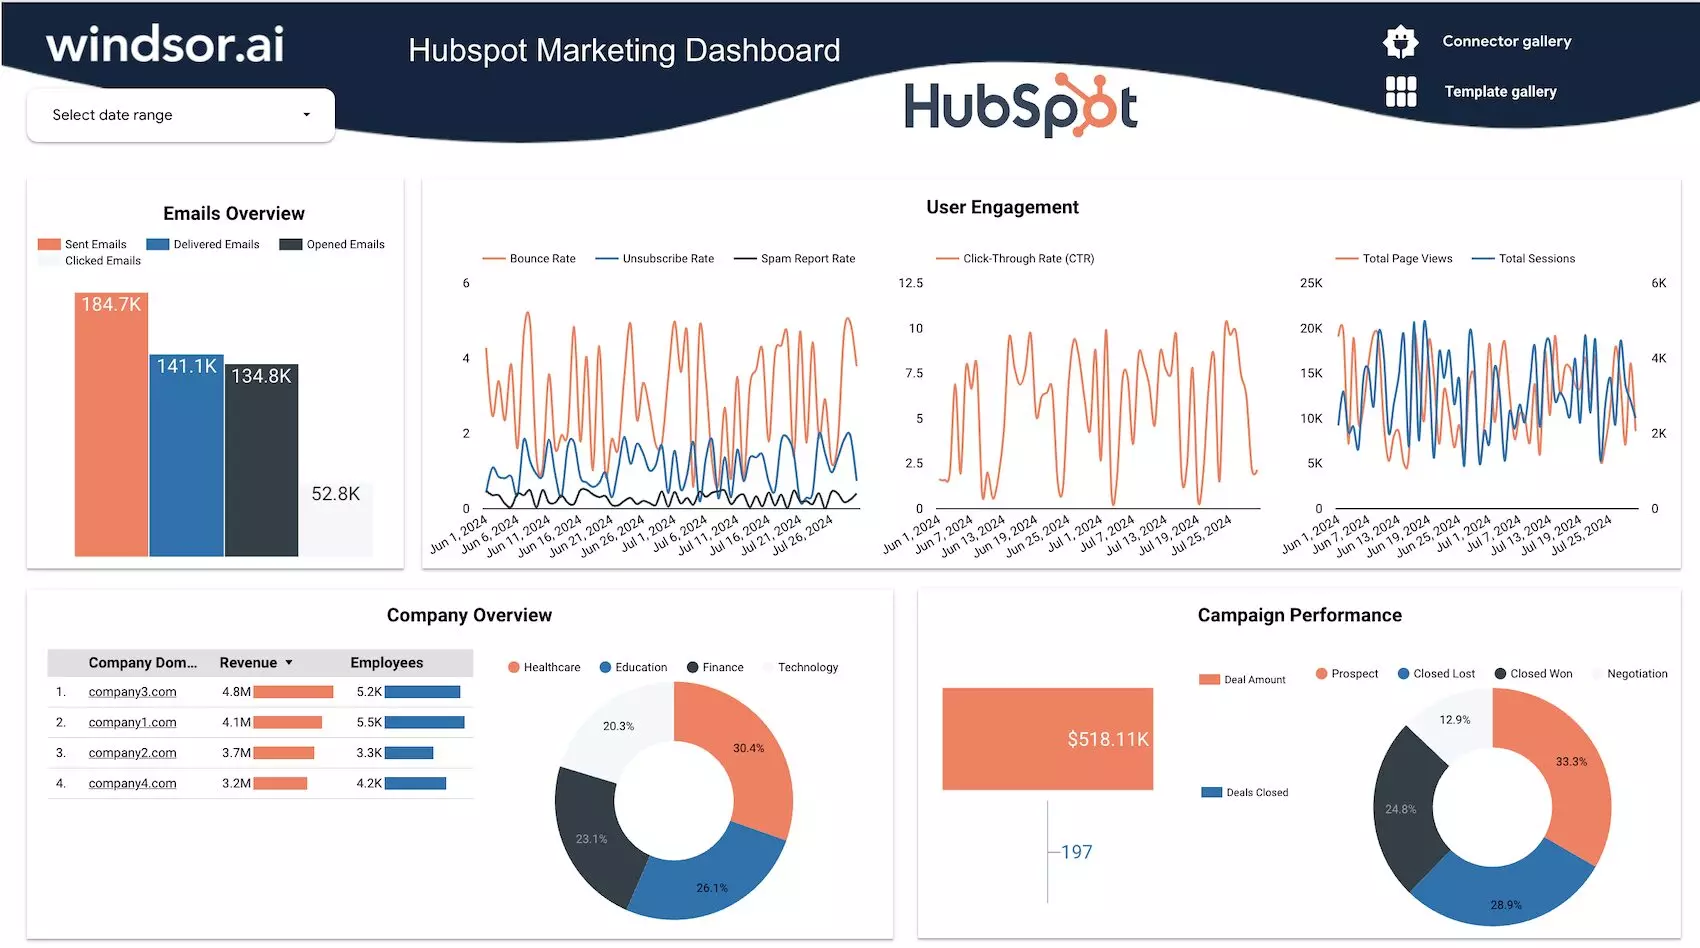
1. HubSpot Marketing Dashboard Template
- Try it now: Template link
- Connect your HubSpot data to Looker Studio
- Learn more about this template: Setup instructions
This Windsor’s HubSpot marketing dashboard example for Looker Studio automates campaign tracking based on reports from your HubSpot Marketing Hub. It visualizes key marketing stats, such as email performance, user engagement, and campaign outcomes in an auto-refreshing dashboard. Use it to reduce manual reporting effort and unlock actionable insights to optimize marketing strategies, improve targeting, and drive higher ROI.
Best for:
- Marketing teams seeking data-driven insights
- Agencies managing multiple client campaigns
- Businesses optimizing lead generation and nurturing
- Decision-makers aligning campaigns with sales growth
Template components:
- Email metrics: sent, delivered, opened, clicked
- Engagement KPIs: bounce, unsubscribe, spam, CTR, sessions, page views
- Campaign performance: deal amounts, won vs. lost deals, negotiation status
- Company-level insights by domain, revenue, and employees
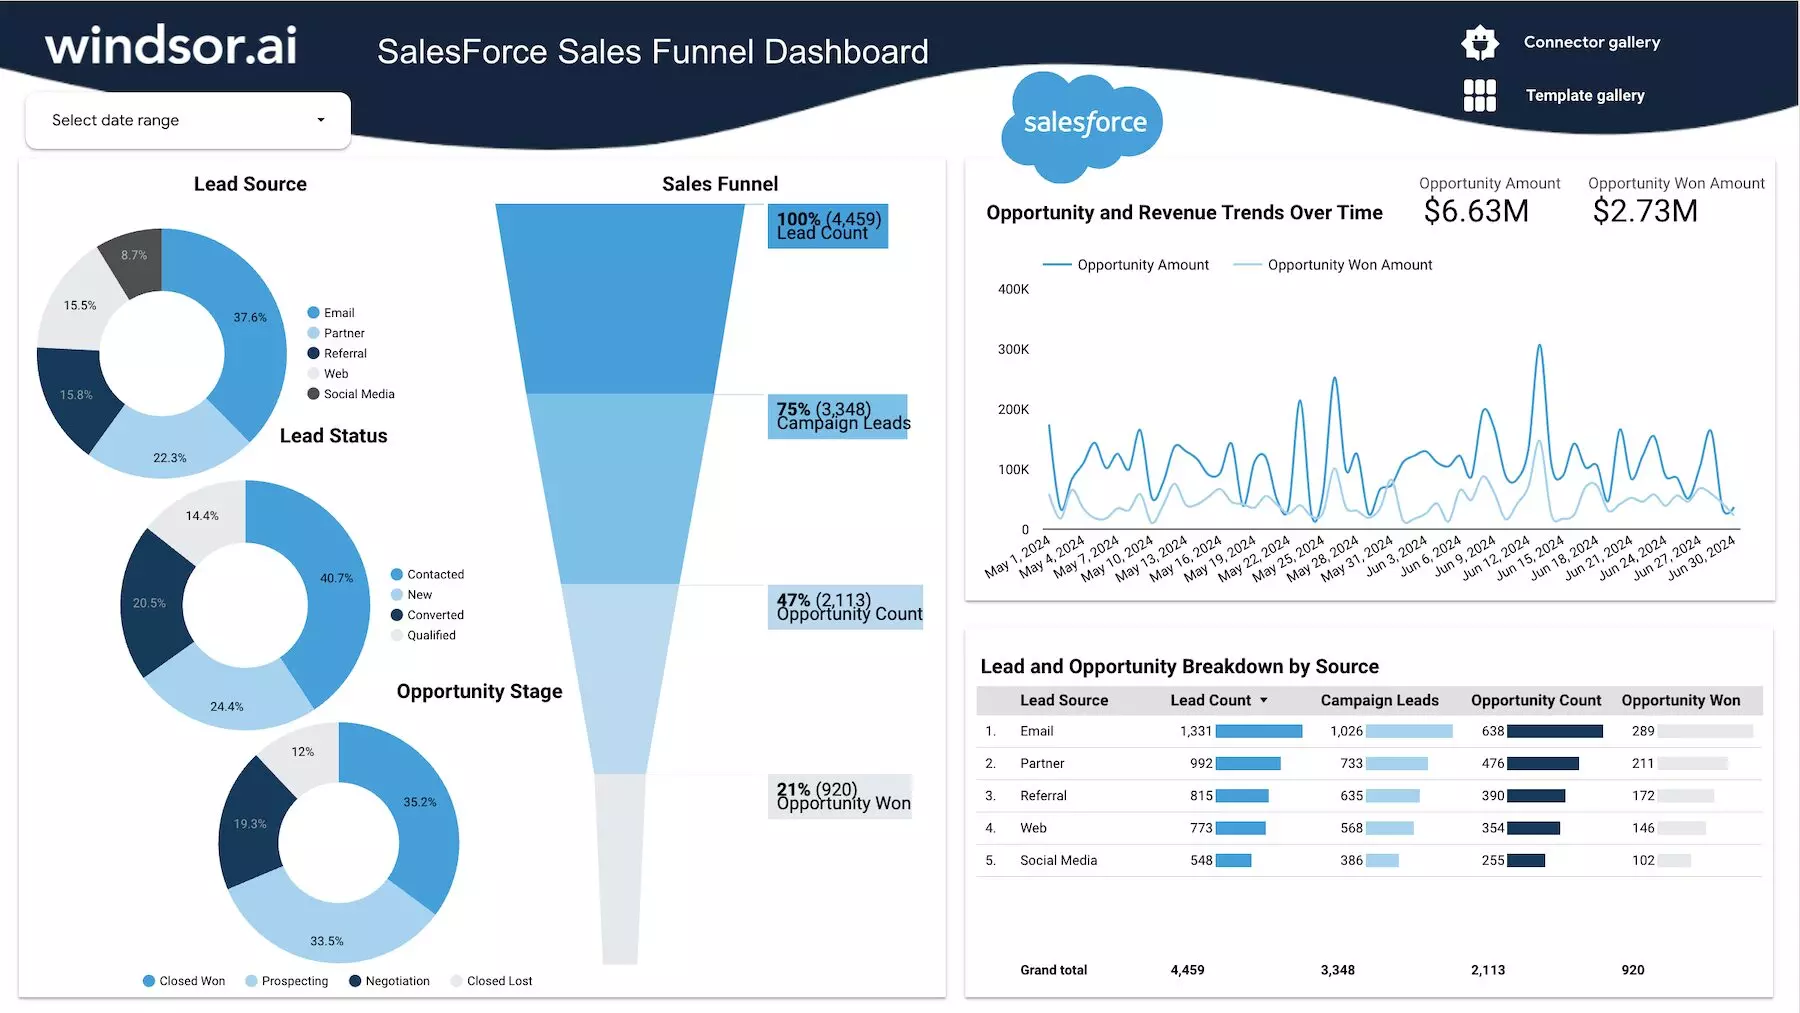
2. Salesforce Sales Funnel Dashboard Template
- Try it now: Template link
- Connect your Salesforce data to Looker Studio
- Learn more about this template: Setup instructions
The Salesforce Sales Funnel Dashboard by Windsor.ai provides a complete view of your sales pipeline in Looker Studio. It tracks lead sources, funnel stages, and revenue trends, helping you identify bottlenecks and opportunities. By visualizing prospects at every stage, this Looker Studio dashboard example empowers sales teams to focus efforts where they matter most and improve conversion rates.
Best for:
- Sales managers monitoring pipeline health
- Marketing teams aligning campaigns with lead generation results
- Executives tracking revenue trends
- Agencies managing Salesforce data for clients
Template components:
- Lead source distribution: email, partner, referral, web, social
- Sales funnel visualization: from lead count to opportunity won
- Lead status breakdown: contacted, new, converted, qualified
- Opportunity stages: prospecting, negotiation, closed
- Revenue trends and opportunity amounts over time
- Lead performance by source
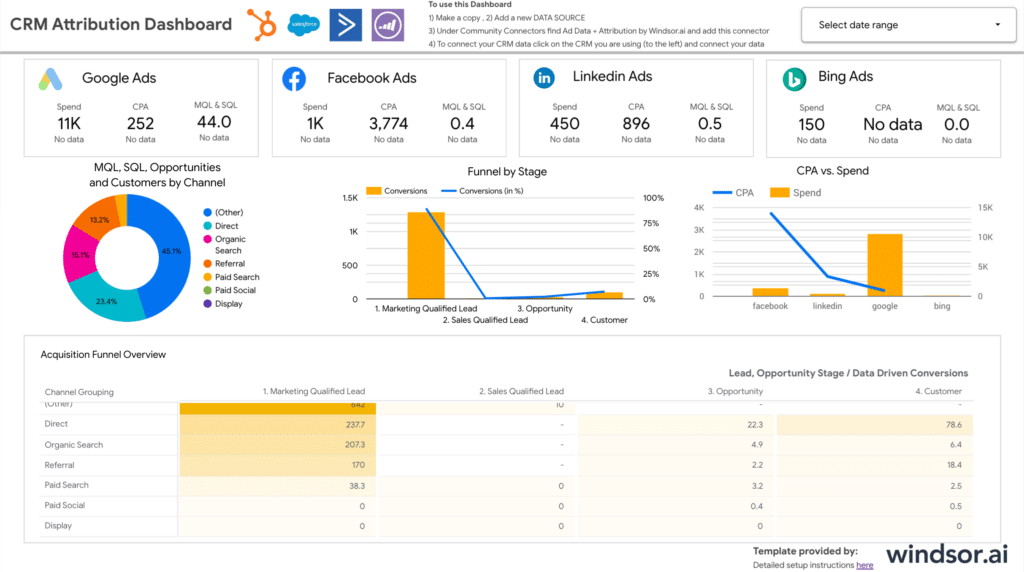
3. Multi-Channel CRM Attribution Dashboard Template
- Try it now: Template link
- Connect your CRM Attribution data (Google Ads, Facebook Ads, LinkedIn Ads, Bing Ads) to Looker Studio
- Learn more about this template: Setup instructions
The CRM Attribution Dashboard brings together advertising and CRM data in Looker Studio to reveal the full customer journey. It highlights how leads interact with your brand across multiple channels before becoming customers. By linking spend, conversions, and cost per acquisition (CPA) across various channels based on the CRM data, this dashboard example for Looker Studio helps you identify which campaigns and platforms drive the most revenue.
Best for:
- B2B marketers analyzing multi-touch attribution
- Sales teams aligning CRM insights with marketing performance
- Executives tracking ROI across paid media investments
- Agencies providing unified reporting to clients
Template components:
- Spend, CPA, and conversions across ad channels
- MQL, SQL, opportunities, customers
- CPA vs spend analysis
- Customer acquisition by channel grouping
How to use Windsor.ai Looker Studio dashboard templates
No coding or programming skills are required to configure our Looker Studio dashboard examples.
1) Go to the Windsor.ai template gallery.
2) Pick a dashboard to fit your reporting needs.
3) Find the detailed setup instructions on the template page. You have to connect your data to this dashboard via the Windsor.ai data integration platform.
4) When ready, you can adjust visuals, filters, and KPIs to your business goals.
Conclusion
Stop wasting hours building marketing reports from scratch with Windsor.ai’s Looker Studio dashboard examples. Create auto-updated dashboards for 325+ data sources in a matter of minutes. Get started with the 30-day free trial: Try It Now.
FAQs
What is Looker Studio?
Looker Studio (previously known as Google Data Studio) is a free data visualization and report-making tool provided by Google. With its ability to blend data from various data sources, pinpoint trends, and generate compelling reports, Looker Studio serves to level up your reporting and analytics workflows.
By using Windsor.ai’s ready-made dashboards for Looker and automated data integration services, you can make smart, data-driven decisions with ease and impress the leadership or stakeholders.
Are Windsor.ai’s Looker Studio templates free?
Yes, all our Looker Studio templates are free to use, with optional paid connectors to automate data syncing from your sources into the dashboards.
How many data sources can I connect via Windsor.ai?
Windsor.ai allows you to connect data from more than 325 marketing, sales, and business platforms.
Is it possible to customize these Looker Studio dashboard examples?
Yes, you can easily edit charts, filters, and styles to align with your brand and key performance indicators.
Do I need coding skills to use these Looker templates?
You don’t need any coding or programming experience to use these templates. Setup is done with just a few clicks.
Is it possible to share these dashboards with my team?
Yes, as allowed by Looker Studio, you can easily share a dashboard with other team members or stakeholders with different permissions.
What is the frequency of data refresh in these Looker dashboards?
You can set your own refresh schedule. Just follow these simple steps to automate your reports:
- Open your Looker Studio report.
- Click on “Manage added data sources” under the “Resource” menu.
- Select the “Windsor.ai” data source.
- Click “Edit Connection” and ensure that Auto-refresh is enabled.
- Under “Scheduled Refresh,” set the desired refresh frequency (e.g., hourly, daily).
- Click “Save” to confirm your settings.

