 AI insights
 About us
 Careers
 Security
 Customer reviews
 Contact us
 Affiliate program
 Solution partners
 Looker Studio templates
 Tableau templates
 Facebook Ads templates
 Google Ads templates
 Data fields & Metrics
 AI prompt library & Guides
 Product documentation
 API documentation
 Case studies
 Blog
Blog Data models
 Windsor vs Supermetrics
 Windsor vs Fivetran
 Windsor vs Portermetrics
 Last updated: 25 February 2026

Porter Metrics is a suitable data integration platform for beginners, especially marketers and digital agencies looking for a simple, user-friendly ELT solution with basic analytics and reporting features.
However, as your data needs grow and become more complex, you may find that Porter Metrics no longer provides the flexibility, scalability, or advanced capabilities your team requires. At that stage, it makes sense to explore top Porter Metrics alternatives that offer a wider range of connectors and destinations or support for a warehouse-first data infrastructure.
In this article, we overview the best Porter Metrics alternatives that deliver more sophisticated functionality, greater scalability, and in some cases, even better pricing.
What is Porter Metrics?
Porter Metrics is a no-code data integration and business intelligence platform designed specifically for small and medium-sized businesses (SMBs). It focuses on automating marketing reporting and simplifying data workflows for non-technical users.

One of its core features is no-code data connectors for popular marketing platforms. These connectors allow users to send multi-channel data to reporting tools such as Looker Studio, Power BI, Google Sheets, or BigQuery, enabling streamlined data visualization and analytics.
Porter Metrics emphasizes ease of use, making data integration and reporting accessible to teams without advanced technical skills. It also positions itself as a more affordable alternative to larger competitors like Supermetrics or Funnel.
Porter Metrics key features
As a traditional ELT platform, Porter Metrics offers the following features and benefits:
- No-code data movement: Simplifies data extraction and loading from multiple sources without requiring technical or coding skills.
- Pre-built marketing templates: Provides a variety of ready-made reporting templates for various data sources with diverse visualization options, including charts, tables, maps, and funnel views.
- Custom dashboards and reports: Allows users to create tailored reports and dashboards in Looker Studio, Power BI, or Google Sheets based on their specific data needs. Reports are interactive and easy to share with stakeholders.
- Automated reporting: Supports scheduled data refreshes and automated report delivery (daily, weekly, or monthly).
- Data blending: Enables users to combine data from multiple sources into a unified dataset before exporting it to a reporting tool, allowing for comprehensive cross-channel analysis.
- Third-party integrations: Connects with tools like Slack and Zapier to trigger automated notifications and workflows.
- Live customer support: Offers live chat assistance, including direct support from the founders.
Porter Metrics data sources (connectors)
Compared to leading ELT platforms designed for marketers and data teams, Porter Metrics offers a relatively limited library of supported data sources. However, Porter positions this as a strategic advantage, focusing on 20+ marketing-specific integrations rather than providing 100+ broader, general-purpose connectors.
The available connectors in Porter Metrics are grouped into the following categories:
Paid media
- Meta Ads
- Google Ads
- LinkedIn Ads
- TikTok Ads
- Microsoft Ads
- Pinterest Ads
- X (Twitter) Ads
- Display & Video 360
Analytics
- Google Analytics 4
- Google Search Console
- Google Business Profile
Social media (organic)
- Facebook Pages
- Instagram Insights
- LinkedIn Pages
- TikTok Organic
E-commerce
- Shopify
- WooCommerce
CRM & email marketing
- HubSpot
- Mailchimp
- Klaviyo
- ActiveCampaign
Other sources
- Google Sheets
✅ Windsor.ai supports all these data sources, plus 300+ additional connectors, compared to ≈20 with Portermetrics. Discover why marketing teams are switching from Porter Metrics to Windsor: https://windsor.ai/windsor-vs-portermetrics/.
Porter Metrics rating & user feedback
Porter Metrics maintains strong ratings across major review platforms:
- G2: 4.6/5 (based on 189+ reviews)
- Capterra: 4.5/5 (based on 6 reviews)
As we can see, Porter Metrics is widely appreciated for its ease of use, intuitive interface, and affordable pricing, making it a popular choice for marketers seeking a simple data integration and reporting solution. Users frequently highlight the value of ready-made templates and simple connector setup, which significantly reduces implementation time and simplifies report creation.
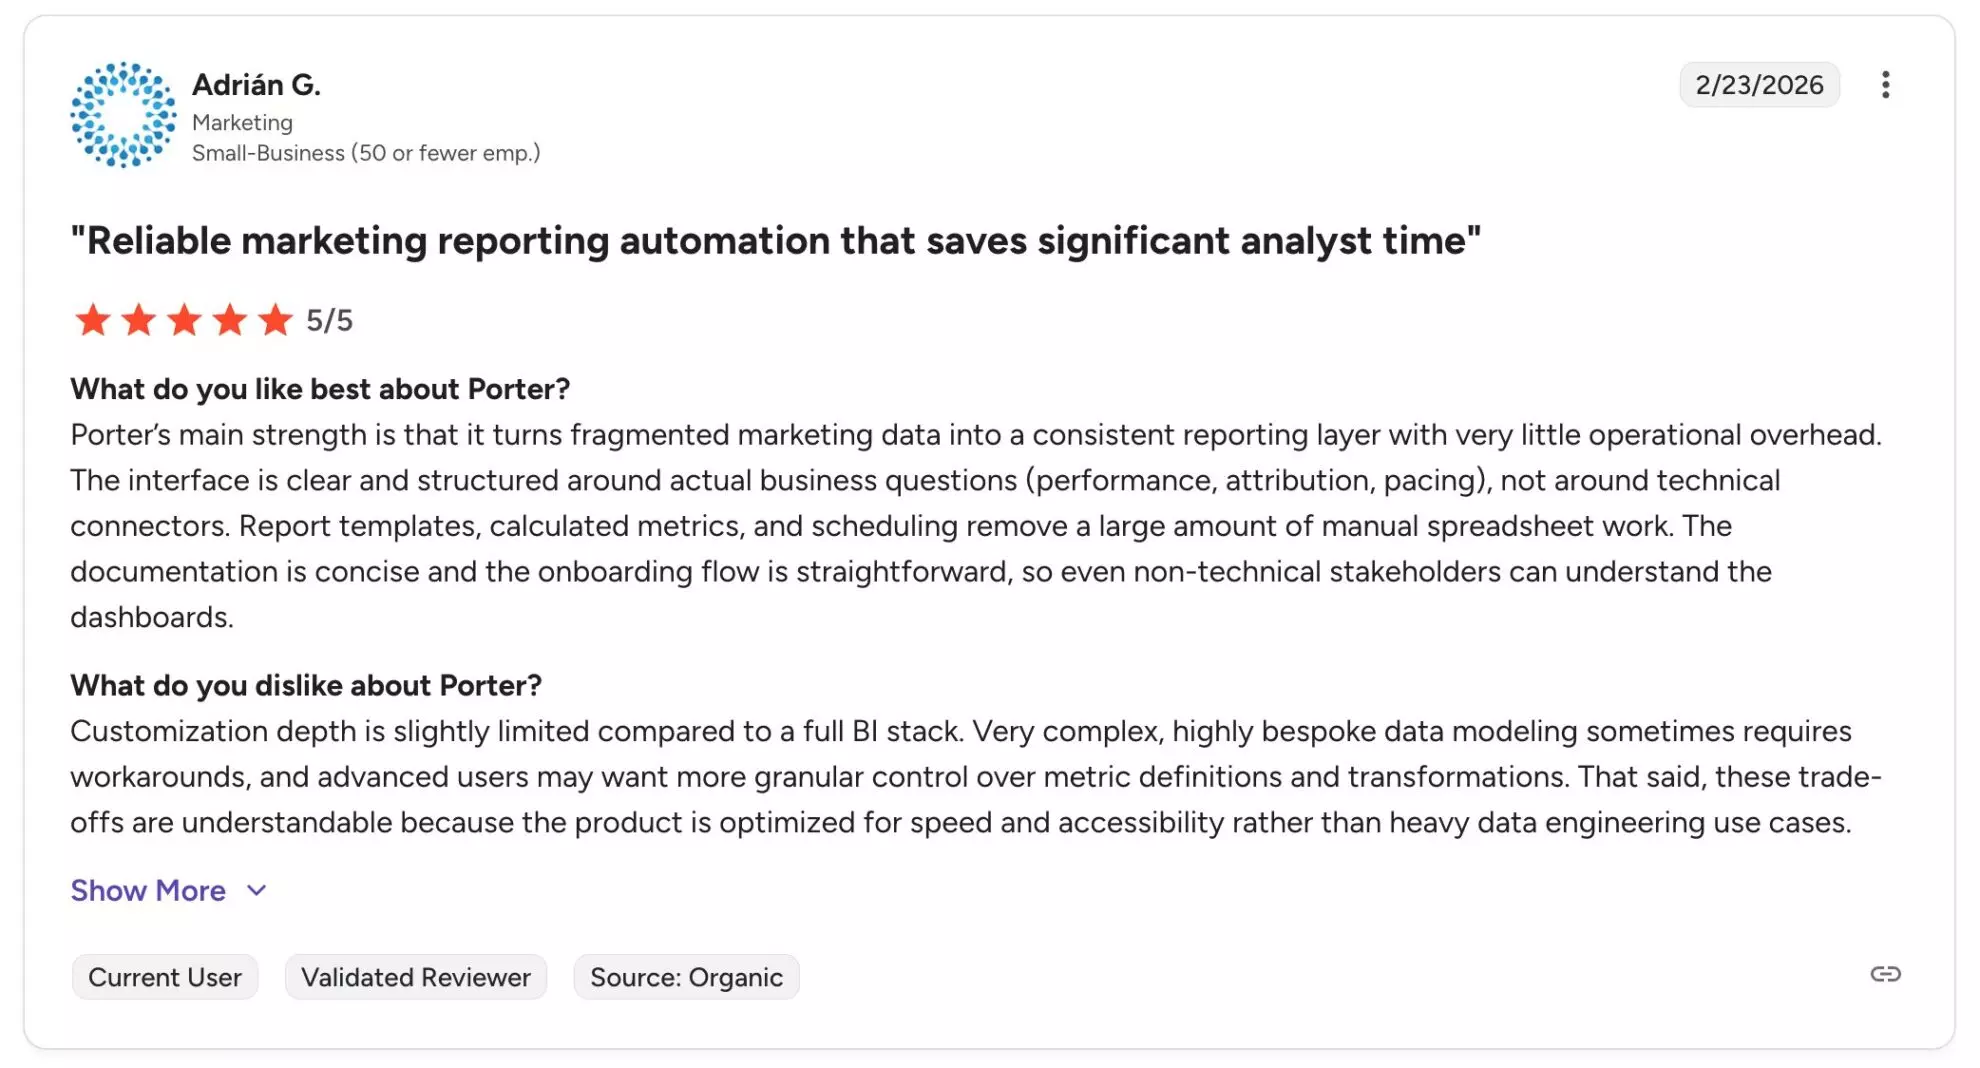
On the downside, users report occasional slow loading times and connection or integration issues. A few reviews also mention that customer support response times could be improved.

Porter Metrics support
Porter Metrics offers several ways to contact its support team, including calls, live chat, and email. The company also provides hands-on assistance with setup, migration, and report replication at no additional cost.
One of its notable commercial differentiators is direct support from the founders.
Porter Metrics pricing (2026)
Porter Metrics charges users for the exact number of accounts they connect and offers advanced options like data blending as a paid add-on (when enabled, those accounts cost 3× the regular price per account/mo.)

Porter Metrics does not provide fixed plans. Instead, its pricing is based on the number of connected accounts, with data blending available as an add-on per data source.
Keep in mind that an account refers to a single ad account or property connected under a data source. For example, if you need to pull data from 5 Meta Ads accounts, this will be counted as 5 separate billable accounts.
Here’s an example of Porter Metrics’ pricing breakdown:
- Free trial: 14-day free trial;
- Forever Free: 3 data sources with a 30-day history limit
Scenario 1:
3 data sources (Meta Ads, Google Ads, Instagram) with 15 connected accounts = $100/month ($6.67/account)
Scenario 2:
7 data sources with 50 connected accounts = $200/month ($4/account)
If data blending is enabled across all 50 accounts: Blended pricing = $12 per account (3× regular price)
50 × $12 = $600/month total
Overall, this pricing model can be beneficial for digital marketing professionals or businesses with specific reporting needs, as it allows for a more customized and flexible setup based on the number of connected accounts.
However, for scalable, multi-account setups that require data blending, Porter Metrics’ costs can increase significantly.
Porter Metrics vs Windsor.ai pricing comparison
In contrast, Windsor.ai’s pricing is based on the number of connected data sources and includes generous account limits.
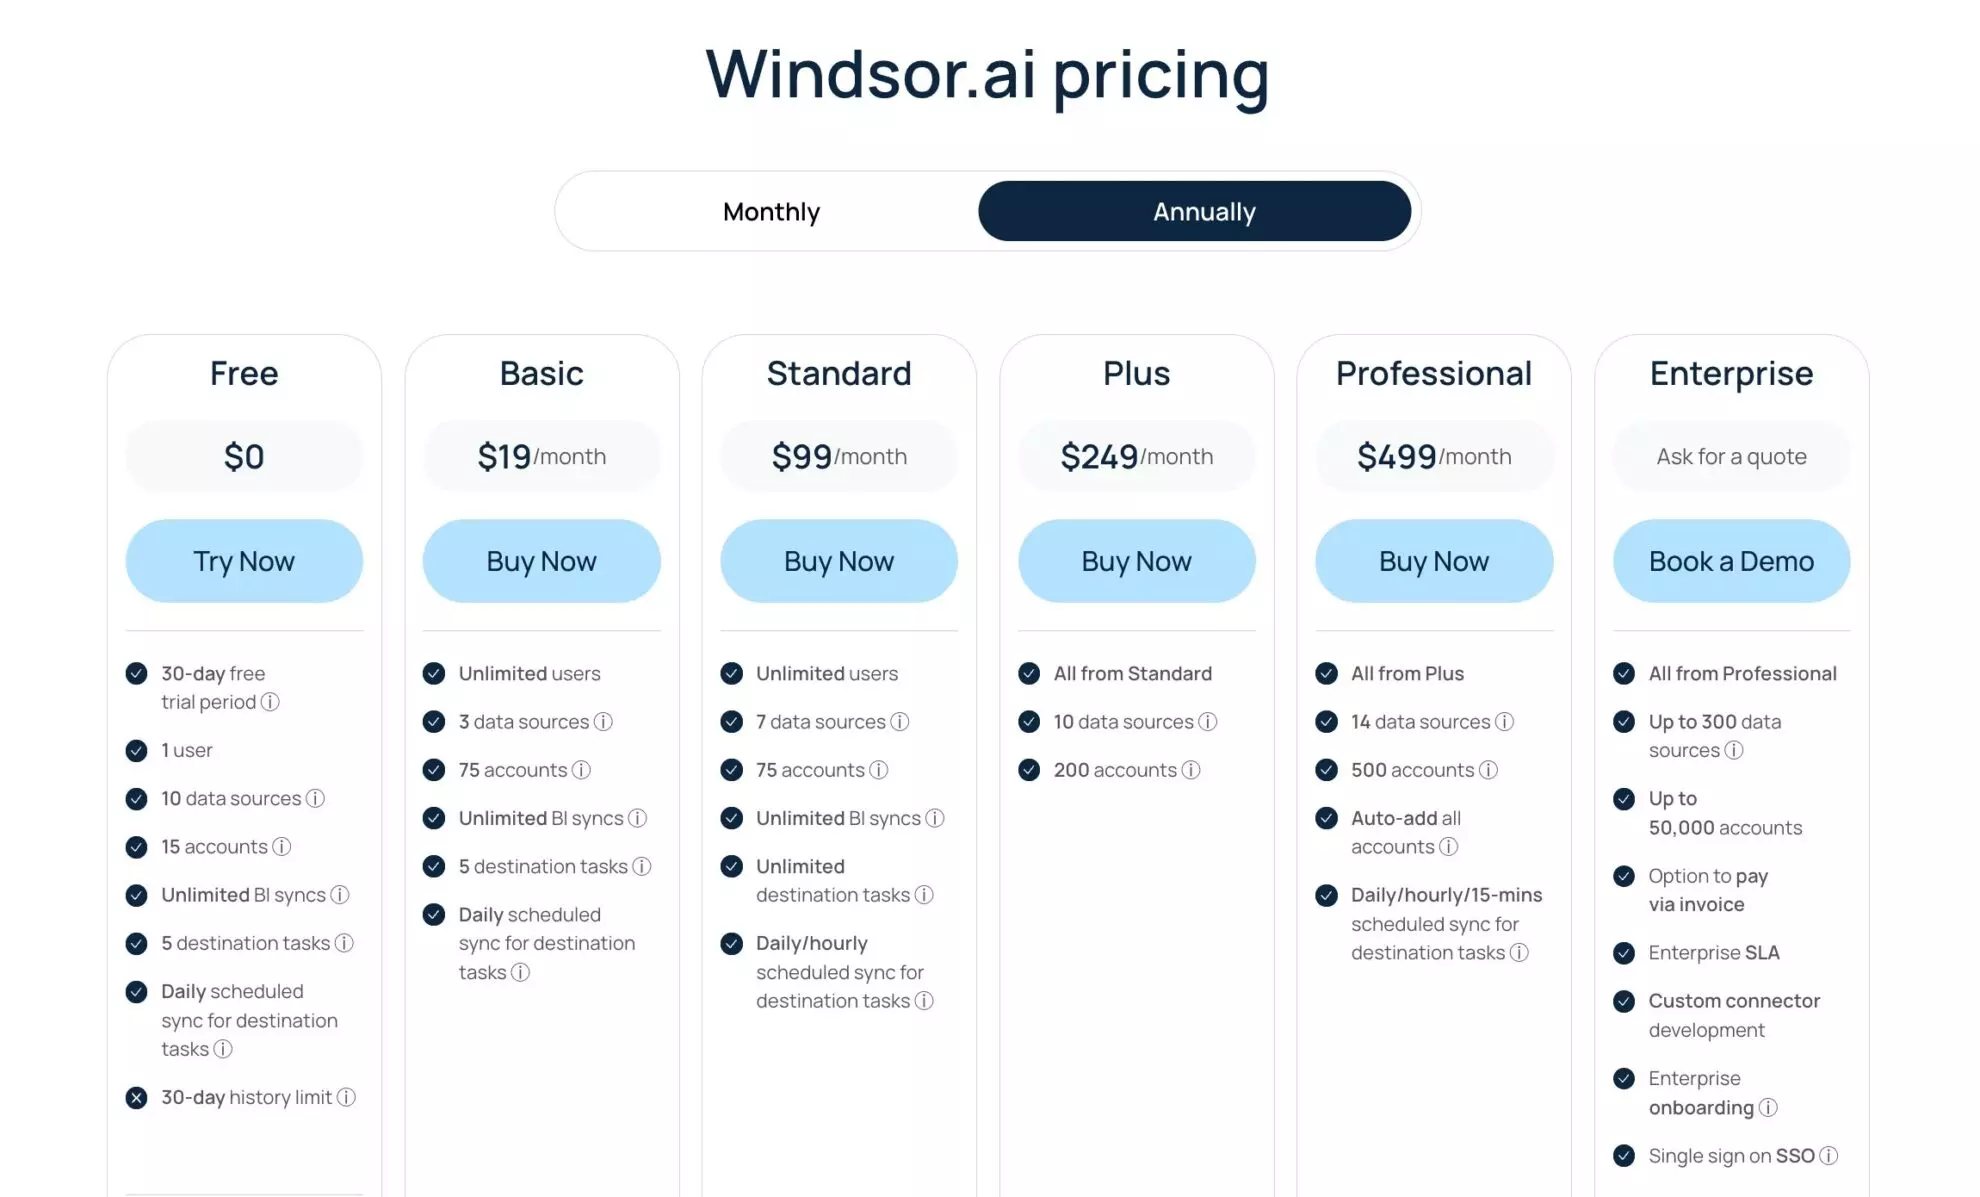
Even on the Basic plan ($19/month), you can connect up to 3 data sources with as many as 75 accounts total, regardless of how many accounts are connected under each source.
For the same number of accounts, Porter Metrics would cost $225/month.

Here’s a more detailed Windsor vs Porter Metrics pricing comparison:
| Scenario | Windsor.ai | Porter Metrics |
|---|---|---|
| Free trial | 30 days; 10 data sources, 15 accounts, 30-day history | 14 days; 3 data sources, 30-day history limit |
| 15 accounts (3 data sources) | $19/month (Basic plan includes up to 75 accounts) | $60/month (15 × $4/account) |
| 50 accounts (7 data sources) | $99/month (Standard plan includes 7 data sources and 75 accounts) | $200/month (50 × $4/account) |
| 50 accounts + Data blending | $19/month (Basic plan includes up to 75 accounts; data blending included by default at no extra cost) | $600/month (50 × $12/account with blending) |
| Pricing model | Flat plan pricing with generous account limits | Charged per account; data blending costs 3× per account |
Pros and cons of Porter Metrics
Now that we’ve reviewed Porter Metrics’ key features, pricing, and user feedback, let’s summarize its main strengths and weaknesses.
Advantages:
- 100+ Looker Studio and Google Sheets templates that can be quickly deployed to streamline reporting setup.
- Very user-friendly interface, making it one of the easiest ELT platforms for non-technical teams.
- Data blending capabilities that allow unified performance analysis.
- Flexible pricing model, where you pay only for the accounts you connect.
- Live support, offering direct assistance and personalized communication.
- Quick setup for small teams, especially those focused mainly on marketing reporting.
Disadvantages:
- Limited number of data connectors compared to other modern ELT platforms.
- A per-account pricing model can quickly become expensive for agencies or businesses managing multiple ad accounts.
- Data blending costs extra, increasing pricing by 3× per blended account.
- Not ideal for warehouse-first or advanced data infrastructure setups, making it unsuitable for data teams.
- Occasional reports of connection or loading issues in user reviews.
Top Porter Metrics alternatives for marketing and data teams
If Porter Metrics no longer meets your reporting needs, several powerful alternatives offer broader connector libraries, warehouse-first architecture, advanced automation, and more flexible pricing models.
Below are some of the leading Porter Metrics competitors for marketing teams, digital agencies, and data-driven organizations:
Each platform differs in terms of solution scalability, pricing structure, connector coverage, data transformation capabilities, and support for BI tools and data warehouses. The right choice depends on whether you prioritize ease of use, enterprise-grade infrastructure, advanced data modeling, or cost efficiency at scale.
Windsor.ai: The best Porter Metrics alternative
🌟 Windsor.ai stands out as a powerful alternative to Porter Metrics, especially for marketers, agencies managing multiple accounts, and data teams handling complex reporting workflows.

With 325+ data connectors, built-in data blending, support for a wide range of BI tools and data warehouse destinations, and flexible flat pricing, Windsor.ai enables scalable data integration without per-account cost escalation.
It integrates seamlessly with leading reporting and analytics platforms, including Looker Studio, Power BI, BigQuery, Snowflake, PostgreSQL, MySQL, Google Sheets, Excel, Azure SQL, Tableau, Python, Amazon S3, Azure Blob Storage, and more.
Beyond traditional reporting, Windsor.ai also enables deeper analytics by automatically connecting your unified business data to leading AI tools. Through the Windsor MCP server, you can analyze your data directly in Claude, ChatGPT, Gemini, Microsoft Copilot, Cursor, and Perplexity, turning raw datasets into AI-driven insights in seconds.
Unlike per-account pricing models, Windsor.ai offers generous account limits within each plan, making it a cost-efficient solution for multi-account setups and cross-channel analytics at scale.
Whether you’re scaling marketing operations, building a warehouse-first data infrastructure, or preparing your stack for AI-powered decision-making, Windsor.ai provides a more flexible and growth-ready alternative to Porter Metrics.
Key features of Windsor.ai:
- 325+ data sources: Connect marketing, CRM, sales, e-commerce, and product data from the most popular business platforms in minutes with no code.
- Advanced data blending & normalization: Automatically unify multi-channel data into structured, analysis-ready datasets with a consistent schema.
- Vast template library: Leverage our free, pre-built marketing templates for the most popular data sources and reporting use cases.
- AI-ready data infrastructure: Connect your integrated data to your favorite AI chat for conversational analysis via Windsor MCP.
- Flat, scalable pricing: No per-account cost multiplication. Benefit from generous account limits per plan.
- Multi-destination support: Export data to Looker Studio, BigQuery, Power BI, Tableau, Snowflake, Google Sheets, Excel, Python, and more, going beyond BI-focused analytics.
- Automated sync & near real-time updates: Keep your dashboards and warehouses refreshed automatically with scheduled syncs (daily, hourly, every 15/30 minutes).
- Enterprise-grade security: Secure data pipelines with controlled access and authentication.
| Feature | Windsor.ai | Porter Metrics |
|---|---|---|
| Free trial | ✅ Yes, 30 days | ✅ Yes, 14 days |
| Data sources | 325+ | 20+ |
| G2 review score | 4.6 | 4.6 |
| All connectors available in all pricing tiers | ✅ | ✅ |
| Paid plans starting from | $19/month | $12.49/month |
| Free forever plan | ✅ | ✅ |
| Unlimited users on all plans | ✅ | ✅ |
| Use of all destinations with all plans | ✅ | ❌ |
| SOC 2 Type II compliant | ✅ | ❌ |
| Single sign-on / MFA | ✅ | ❌ |
| Looker Studio connectors | 171+ | 23+ |
| Power BI & Tableau connectors | ✅ | ❌ (Tableau not supported) |
| Google Sheets plugin | ✅ | ✅ |
| Excel integration | ✅ | ❌ |
| API access | ✅ | ❌ |
| Pricing not based on row counts | ✅ | ❌ |
| BigQuery data transfers | ✅ | ✅ |
| PostgreSQL data transfers | ✅ | ❌ |
| MySQL data transfers | ✅ | ❌ |
| Snowflake data transfers | ✅ | ❌ |
| Amazon S3 data transfers | ✅ | ❌ |
| Azure SQL / Blob Storage transfers | ✅ | ❌ |
| AI integrations (ChatGPT, Claude, Gemini, Copilot, etc.) | ✅ | ❌ |
Conclusion
Porter Metrics is a good option for beginners and small marketing teams looking for a simple, no-code reporting solution. Its user-friendly interface, ready-made templates, and per-account pricing model make it accessible for basic marketing reporting needs.
However, as soon as your requirements grow, whether in terms of connected accounts, cross-channel data blending, warehouse support, or AI-powered analytics, Porter’s limitations become more visible. The per-account pricing model, additional costs for data blending, limited connector and destination library, and the lack of AI integrations can quickly restrict scalability.
For marketing teams, agencies, and data-driven organizations looking for broader connector coverage, flat and predictable pricing, warehouse support, and AI-ready analytics infrastructure, Windsor.ai offers a more suitable and future-proof alternative.
If you’re building for growth, not just basic reporting, choosing a platform that scales and innovates with you is essential.
Ready to upgrade your marketing data infrastructure? Connect 325+ data sources, unify your performance data across channels, and unlock AI-powered insights with Windsor.ai.
🚀 Start your free 30-day Windsor.ai trial today and scale your reporting without connector limits: https://onboard.windsor.ai.
FAQs
Is Porter Metrics suitable for beginners?
Yes. Porter Metrics is designed for marketers and small teams that need a simple, no-code solution for marketing reporting and basic cross-channel analysis.
Is Porter Metrics a free tool?
You can avail a free trial of Porter Metrics for a duration of 14 days. Afterward, you can stay on the Forever Free plan or purchase account connections according to your requirements.
Who is Porter Metrics recommended for?
Porter Metrics is recommended for SMBs, data experts, and marketing agencies. This software seamlessly integrates with your data sources, enabling the collection of consumer data and the generation of insightful reports. These resources empower you to analyze your marketing endeavors and make informed decisions for your business.
How does Porter Metrics pricing work?
Porter Metrics charges users for the exact number of accounts they connect and offers advanced options like data blending as a paid add-on (when enabled, those accounts cost 3× the regular price per account/mo.)
How many data connectors does Porter Metrics offer?
Porter Metrics offers 20+ marketing-focused connectors, primarily covering paid media, analytics, ecommerce, and CRM tools.
Is data blending included in Porter Metrics plans?
No. Data blending is an optional add-on. When enabled, the cost per connected account triples.
Which solution is better for scalable, multi-channel analytics?
Windsor.ai is generally better suited for scalable, multi-account, and warehouse-first setups, while Porter Metrics works best for smaller teams with simpler reporting needs.
What are Windsor.ai’s advantages over Porter Metrics?
Marketing teams switch to Windsor.ai to access 16x more data sources, a broader range of destinations, and more advanced features at the same price. Windsor.ai supports 325+ data sources, 20+ destinations, built-in data blending, and AI integrations, while Porter Metrics is limited to ~20 sources, 4 destinations, and usage-based pricing that scales quickly.
How does Windsor.ai pricing compare to Porter Metrics?
Windsor.ai uses flat, tier-based pricing, so costs stay predictable as your setup grows. Porter Metrics charges per account and per feature, and data blending is an add-on.
For example, 3 data sources cost ~$40/month with Portermetrics vs $19/month with Windsor.ai.
What are the other tools like Porter Metrics?
Some top Porter Metrics competitors include Windsor.ai, Supermetrics, Improvado, Funnel.io, Fivetran, Adverity, Dataslayer.ai, and Coupler.io. Each differs in pricing structure, scalability, connector coverage, and data infrastructure capabilities.
Does Porter Metrics have a referral program?
Yes, you can find information about their referral program here.
Where is Porter Metrics‘s headquarters?
Porter Metrics is based in Manizales, Caldas, Colombia.
Read also:
Funnel.io vs. Supermetrics: A Comprehensive Comparison
Supermetrics vs. Fivetran: Complete Guide
Adverity vs Supermetrics: Which is Right for You in 2024?
Supermetrics vs. Whatagraph Comparison
Power My Analytics vs Supermetrics Comparison
Stitch vs Supermetrics: Ultimate Comparison
Best Stitch Alternatives & Competitors

