 AI insights
 About us
 Careers
 Security
 Customer reviews
 Contact us
 Affiliate program
 Solution partners
 Looker Studio templates
 Tableau templates
 Facebook Ads templates
 Google Ads templates
 Data fields & Metrics
 AI prompt library & Guides
 Product documentation
 API documentation
 Case studies
 Blog
Blog Data models
 Windsor vs Supermetrics
 Windsor vs Fivetran
 Windsor vs Portermetrics
 Last updated: 5 May 2026

Many marketers analyze TikTok Ads data directly within the TikTok Ads Manager. While the built-in charts are useful for quick checks, they provide quite limited insights when your campaigns, budgets, and channels scale.
Then you might turn to deeper analysis in spreadsheets, but still, this manual method can’t reliably support ongoing TikTok Ads reporting, nor does it provide cross-channel visibility.
Ultimately, without automated, unified TikTok Ads performance analytics, it’s difficult to track the full customer journey across awareness, consideration, and conversion stages and keep insights up to date.
This guide walks through different ways to analyze TikTok Ads data, both manually and automatically, and explains which TikTok Ads metrics matter most. Finally, you’ll see how Windsor.ai works as an all-in-one TikTok Ads reporting tool that automates the entire analytics workflow, so your team spends more time optimizing and less time wrangling data.
What is TikTok Ads analytics?
TikTok Ads analytics measures how your TikTok paid campaigns perform in terms of reach, engagement, conversions, and revenue. It helps marketers understand how creatives, audience targeting, and bidding strategies influence outcomes.
When paired with a TikTok Ads reporting tool like Windsor.ai, it becomes easier to track performance consistently and accurately.
Key TikTok Ads metrics you should track
Some of the most important TikTok Ads metrics include:
| Metric | Definition | Why it matters |
| Impressions | Total ad views | Measures reach and visibility |
| Clicks | Total clicks | Indicates initial audience interest |
| CTR | Clicks ÷ Impressions | Gauges creative/audience relevance |
| CPC | Spend ÷ Clicks | Shows ad cost efficiency per interaction |
| CPM | Spend ÷ Impressions × 1,000 | Useful for awareness strategy optimization |
| Conversions | Goal completions | Measures real outcomes |
| ROAS | Revenue ÷ Ad Spend | Confirms profitability |
Windsor.ai lets you retrieve TikTok Ads data across 780+ metrics and 140+ dimensions. Explore all available TikTok Ads data fields.
Common TikTok Ads analytics challenges
Even experienced data analytics teams run into these widespread challenges when trying to scale or optimize TikTok Ads performance measurement:
Siloed data
TikTok data sits separately from Meta Ads, Google Ads, CRM systems, and other commonly used analytics platforms. This makes it hard to estimate TikTok’s role in the entire customer journey and its impact on overall business results.
Time-consuming manual reporting
Teams spend hours exporting CSVs, cleaning data, merging spreadsheets, and updating reports each week (or even daily). This slows down time-to-insight and decision-making, increasing the risk of mistakes.
Limited historical visibility
TikTok only retains performance data for a limited period (up to 365 days). Without external storage, teams lose access to historical data and can’t analyze long-term trends or compare results over time.
Overwhelming volume of metrics
TikTok provides thousands of metrics and breakdowns, which can feel difficult to prioritize. Without clear KPI alignment, reporting based on raw data becomes unfocused and inefficient.
Attribution gaps
TikTok often drives awareness and early-stage engagement, but it rarely converts into leads or customers right away. To get a more accurate picture, you can send TikTok Ads data to BigQuery for in-depth cross-channel and attribution analysis, considering all touchpoints.
Inconsistent metric naming across channels
Metrics and definitions vary from platform to platform. Without normalization, comparing TikTok Ads data to other platforms, e.g., Meta or Google Ads, can be misleading or lead to broken dashboards.
Windsor.ai solves this challenge with built-in automated data mapping, which applies normalization and transformation rules under the hood, standardizing metrics across various channels. As a result, you get consistent, analysis-ready datasets in your BI tools, databases, or data warehouses.
How to analyze TikTok Ads data: 2 methods
Method 1. Manual TikTok Ads analysis (via TikTok Ads Manager)
Basic TikTok Ads analysis through the built-in TikTok Ads Manager works well for:
- Reviewing creatives
- Checking daily performance
- Early campaign learning phases
If your creatives aren’t performing as expected, it’s worth polishing the footage first — a video enhancer can sharpen resolution and improve visual quality before you even start tracking results.
However, this manual method is quite limited:
- Requires ongoing spreadsheet clean-up
- Doesn’t support cross-platform analytics and multi-channel attribution
- Retains data only for 365 days
Why automate TikTok Ads analytics
Automating TikTok Ads analytics and reporting brings the following essential benefits:
- Near real-time TikTok Ads performance tracking
- Data accuracy (prevents copy-paste errors)
- Ability to compare TikTok results vs other channels
- Auto-refreshing TikTok Ads dashboards
- Team efficiency thanks to focusing on insights, not manual data ingestion steps
Method 2. Automated TikTok Ads analytics with Windsor.ai
Windsor.ai is an enterprise-grade TikTok Ads reporting tool that transforms the way you collect, integrate, and visualize marketing data. With over 780 metrics and 140 dimensions available for TikTok, you gain access to rich performance insights down to the campaign, ad group, creative, and placement level.
Once you connect your TikTok Ads account to Windsor.ai, the platform:
- Extracts raw performance data
- Allows you to blend TikTok Ads stats with data from other marketing and business channels
- Normalizes naming conventions so TikTok metrics align with other connected platforms (Google Ads, Meta Ads, and 325+ more)
- Preserves unlimited historical data
- Automates TikTok Ads reporting by delivering clean data to your BI tools, spreadsheets, or data warehouses at your preferred schedule
- Provides pre-built TikTok Ads reporting templates for instant setup
You no longer need to export CSVs or manually stitch together data silos. Windsor.ai handles every aspect of TikTok Ads data integration behind the scenes.
In less than 5 minutes, you can build a unified TikTok Ads dashboard in tools like Looker Studio, Power BI, BigQuery, Snowflake, Google Sheets, or another destination, and proceed with near real-time performance tracking.
Key benefits of using Windsor.ai for TikTok Ads analytics:
- Zero-code setup: Connect your TikTok Ads account(s) with just a few clicks once, and your data pipeline runs continuously.
- Data blending for cross-platform analysis: Merge TikTok with Meta, Google Ads, web analytics, CRM, and other apps for holistic insights into your business performance.
- Scheduled syncs: Your TikTok Ads stats automatically update in the destination system based on your set schedule (hourly, daily, or every 15 minutes).
- AI-powered insights: Send your Windsor-integrated data to your favorite AI chat (ChatGPT, Claude, Gemini, Perplexity, etc.) for deeper analysis through natural language.
- Deep visibility: With hundreds of supported metrics and dimensions, you can track both high-level and micro-level KPIs.
- Consistent schema: Metric names are automatically standardized across all connected channels, so you don’t have “clicks vs taps” confusion.
- Ready-to-use templates: Access pre-built dashboards tailored for TikTok to get started immediately.
✨ Experience the power of fully automated TikTok Ads analytics with Windsor.ai now: Start Your Free 30-Day Trial.
How to automate TikTok Ads reporting with Windsor.ai: setup steps
Moving from manual exports to automated reporting takes just a few steps when you use Windsor.ai. Set it up once, and your TikTok data refreshes automatically with scheduled sync. No spreadsheets, no CSV uploads, and no manual dashboard updates.
Step-by-step instructions:
1. Connect your TikTok Ads account
Start your free 30-day trial at Windsor.ai, select TikTok Ads as a data source, and authenticate your account(s) from which you want to pull data.

For cross-platform analysis, you can connect any other supported channels, such as Meta Ads, Google Ads, GA4, Shopify, HubSpot, and so on.
2. Select your reporting metrics and dimensions
Customize your reporting by choosing from the available data fields, including campaign, ad group, creative, placement, region, device, conversions, cost data, video engagement, etc.

Preview your dataset in the table to ensure everything looks right before loading it into a destination.
3. Choose your destination system
Send your data to the analytical & reporting environment where your team already works:
- Looker Studio
- Power BI
- Tableau
- Google Sheets / Excel
- BigQuery, Snowflake, Redshift, Databricks, etc.
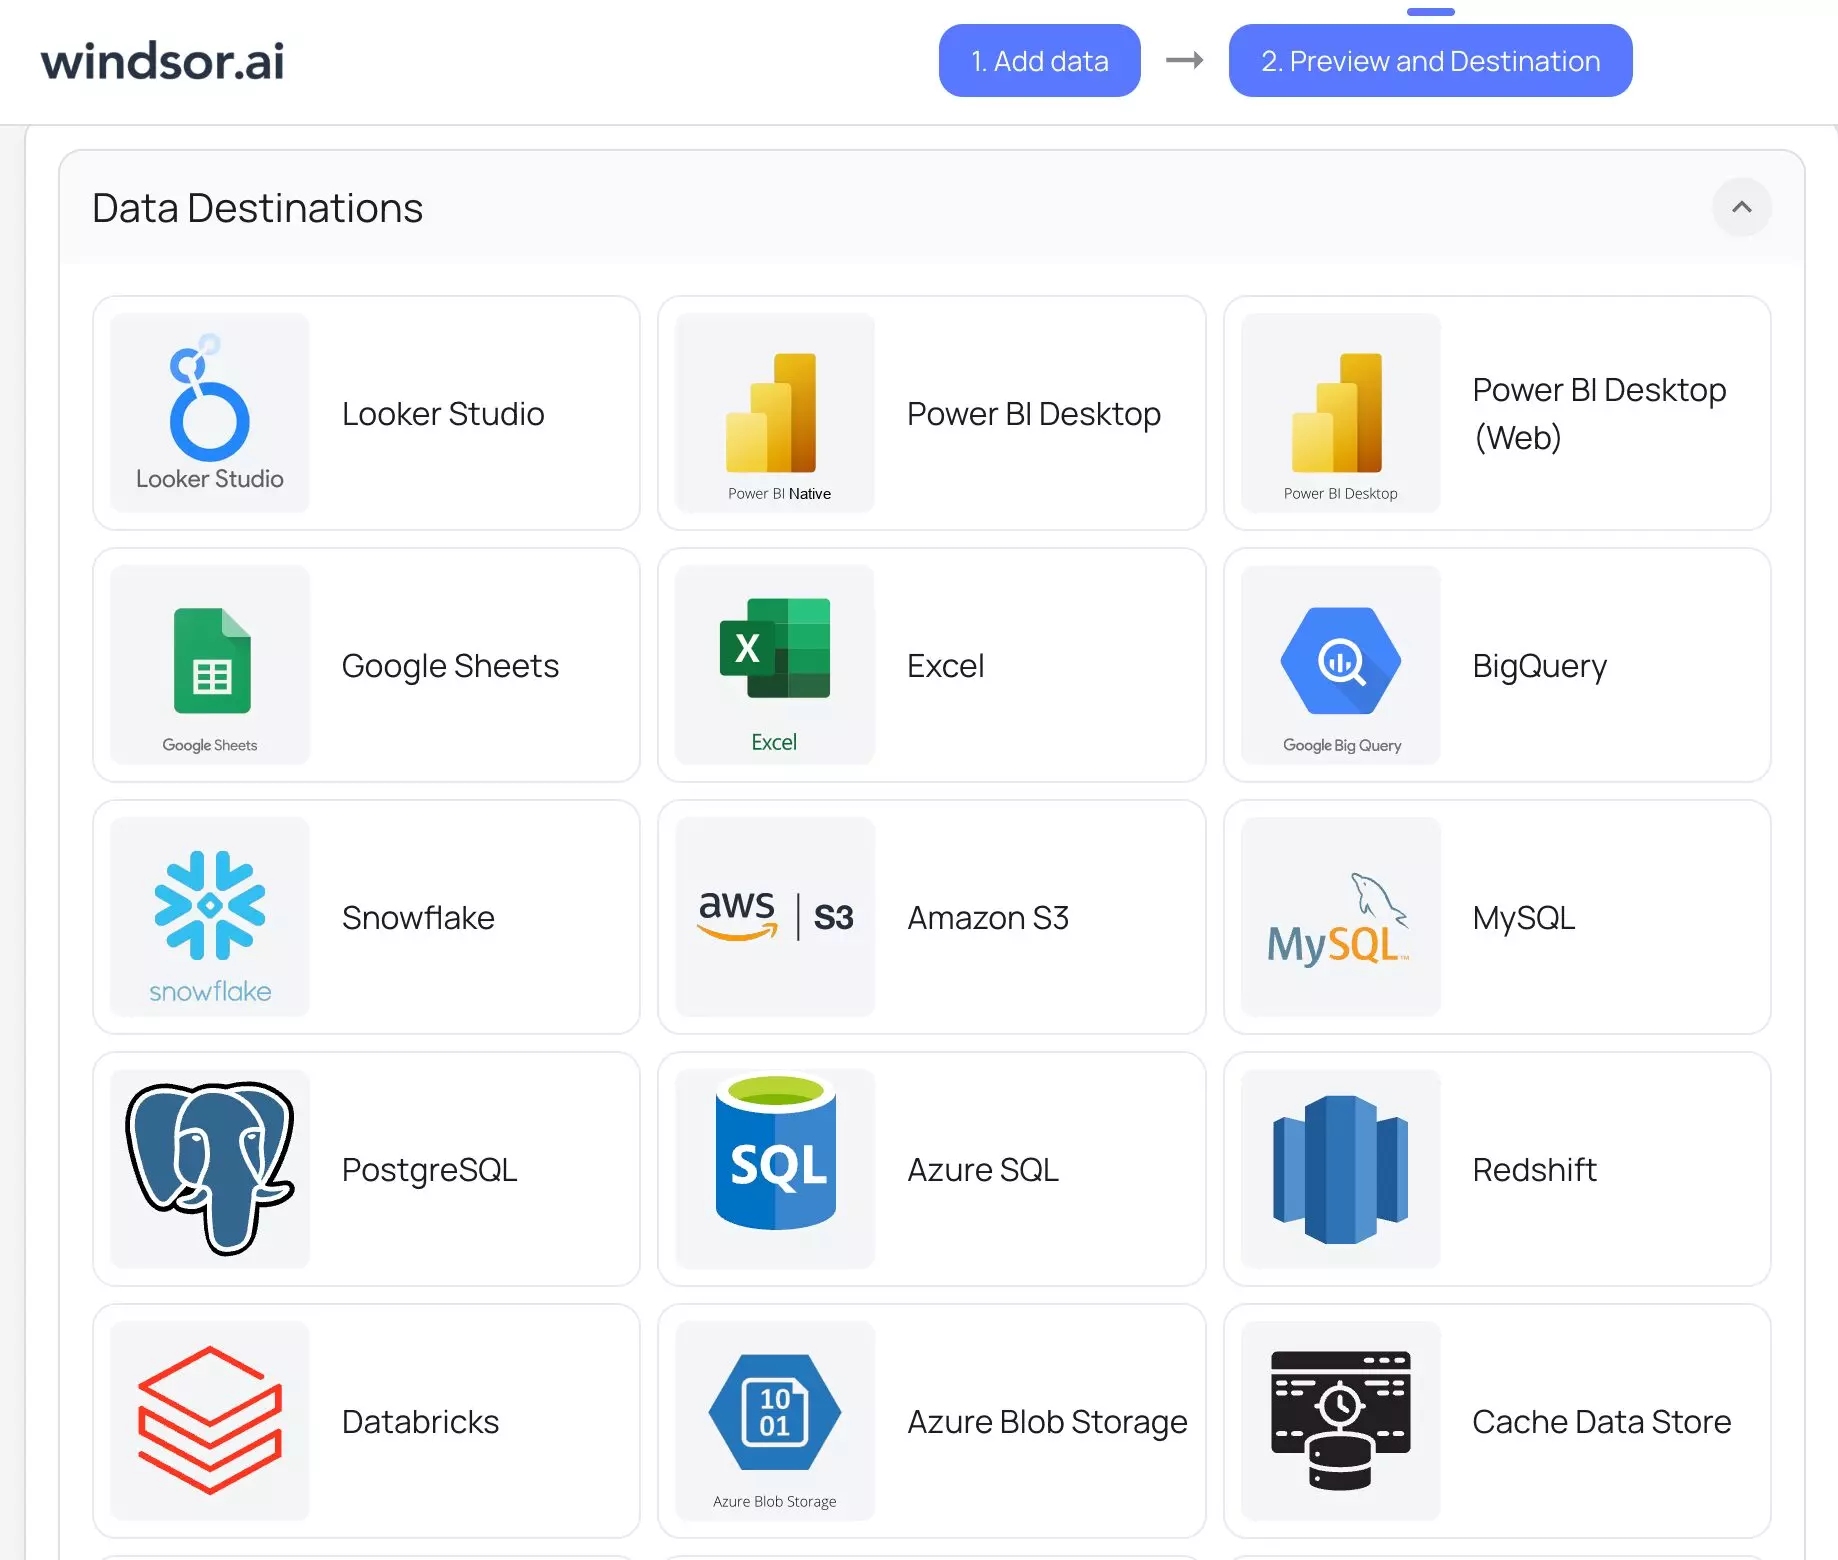
Select the preferred tool and follow the provided setup instructions. View all destination setup guides in our documentation.
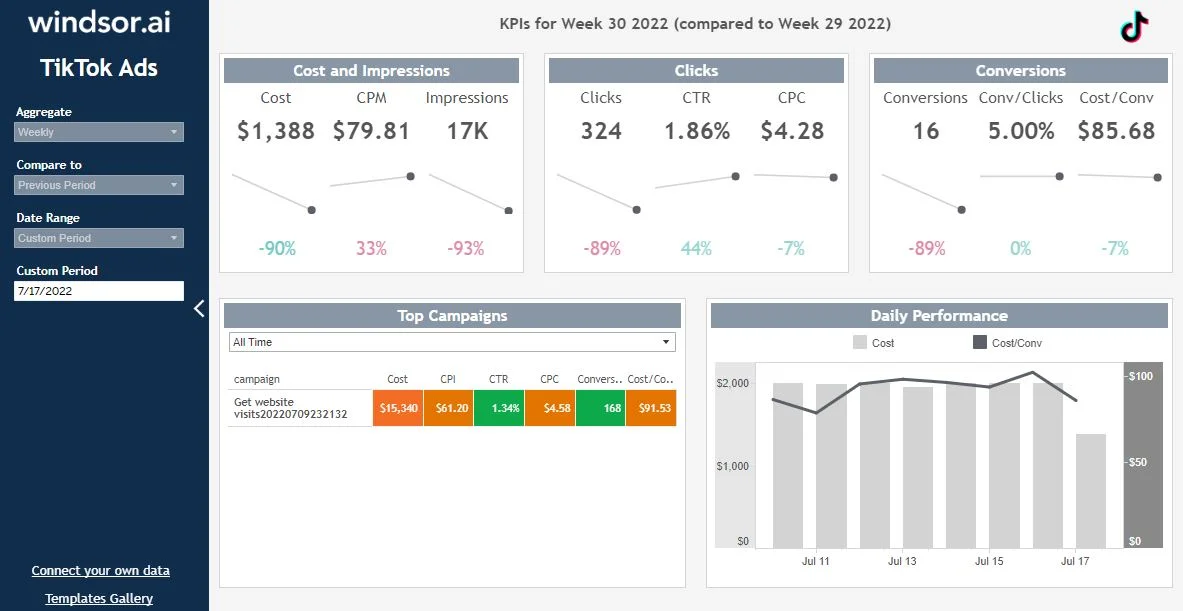
4. Open your unified TikTok Ads dashboard
Once your pipeline is live and running, your TikTok Ads data refreshes automatically based on the set sync schedule.
Now you can track ROAS, CPA, CTR, or multi-channel attribution all in one place.
*Bonus: Leverage ready-made TikTok dashboard templates
You can start instantly with pre-built reporting dashboards from our gallery (available for Looker Studio, Power BI, Tableau, and Excel): Windsor.ai Free TikTok Ads Dashboard Templates.
Configure a template in just minutes and customize a dashboard to match your reporting needs and company branding.
Conclusion
Relying on manual analytics in spreadsheets or in TikTok Ads Manager is quite limited and error-prone. What’s more, maintaining those reports requires time and continuous effort.
By automating your TikTok Ads data analytics with Windsor.ai, you gain:
- Reliable, near real-time TikTok Ads performance tracking
- Auto-updating TikTok Ads reporting dashboards
- Unified reporting across all your business channels
- A complete view of your customer journey
- 40+ hours saved every week
🚀 Try Windsor.ai today and build your automated TikTok Ads dashboard in minutes: https://onboard.windsor.ai/app/tiktok.
FAQs
Do I need dev support to set automated TikTok Ads analytics with Windsor.ai?
No. The setup is completely no-code. You can connect TikTok Ads and build your reporting dashboard in just a few clicks.
Can I blend TikTok Ads data with other channels (Meta Ads, Google Ads, GA4, etc.)?
Yes. Windsor.ai is built for cross-channel reporting and automatically normalizes naming across all connected platforms.
How often does the data refresh through the Windsor.ai connector?
You can upload data in batches or set a continuous auto-refresh at custom intervals (hourly/daily/every 15 minutes), depending on your Windsor plan and chosen destination.
Where can I send TikTok Ads data through Windsor.ai?
Windsor.ai enables you to integrate your TikTok Ads data into Power BI, Looker Studio, Google Sheets, Excel, BigQuery, Snowflake, Tableau, PostgreSQL, MySQL, Python, Amazon S3, Azure Blob Storage, Azure SQL, Redshift, Databricks, Microsoft Fabric, and Windsor MCP server for AI insights.
Can I track performance by creative or creator?
Yes. You can break your TikTok Ads analytics down by ad names, creative IDs, video engagement metrics, and creator-level campaigns.

