 AI insights
 About us
 Careers
 Security
 Customer reviews
 Contact us
 Affiliate program
 Solution partners
 Looker Studio templates
 Tableau templates
 Facebook Ads templates
 Google Ads templates
 Data fields & Metrics
 AI prompt library & Guides
 Product documentation
 API documentation
 Case studies
 Blog
Blog Data models
 Windsor vs Supermetrics
 Windsor vs Fivetran
 Windsor vs Portermetrics


Tired of manual data exports? Get started with Windsor.ai today to automate your reporting and extract deeper AI insights
Access all your data from various sources in one place. Get started for free.


Connect your business data from 350+ platforms, like Google Ads, Meta Ads, GA4, Shopify, Salesforce, and more, directly to Lovable with Windsor MCP.
Ask plain-language questions about your campaigns, dig into performance across channels, get AI-driven recommendations, and turn your findings into live dashboards your whole team can use.
Explore our step-by-step guide to seamlessly integrate your data from any source into Lovable with the Windsor.ai connector.
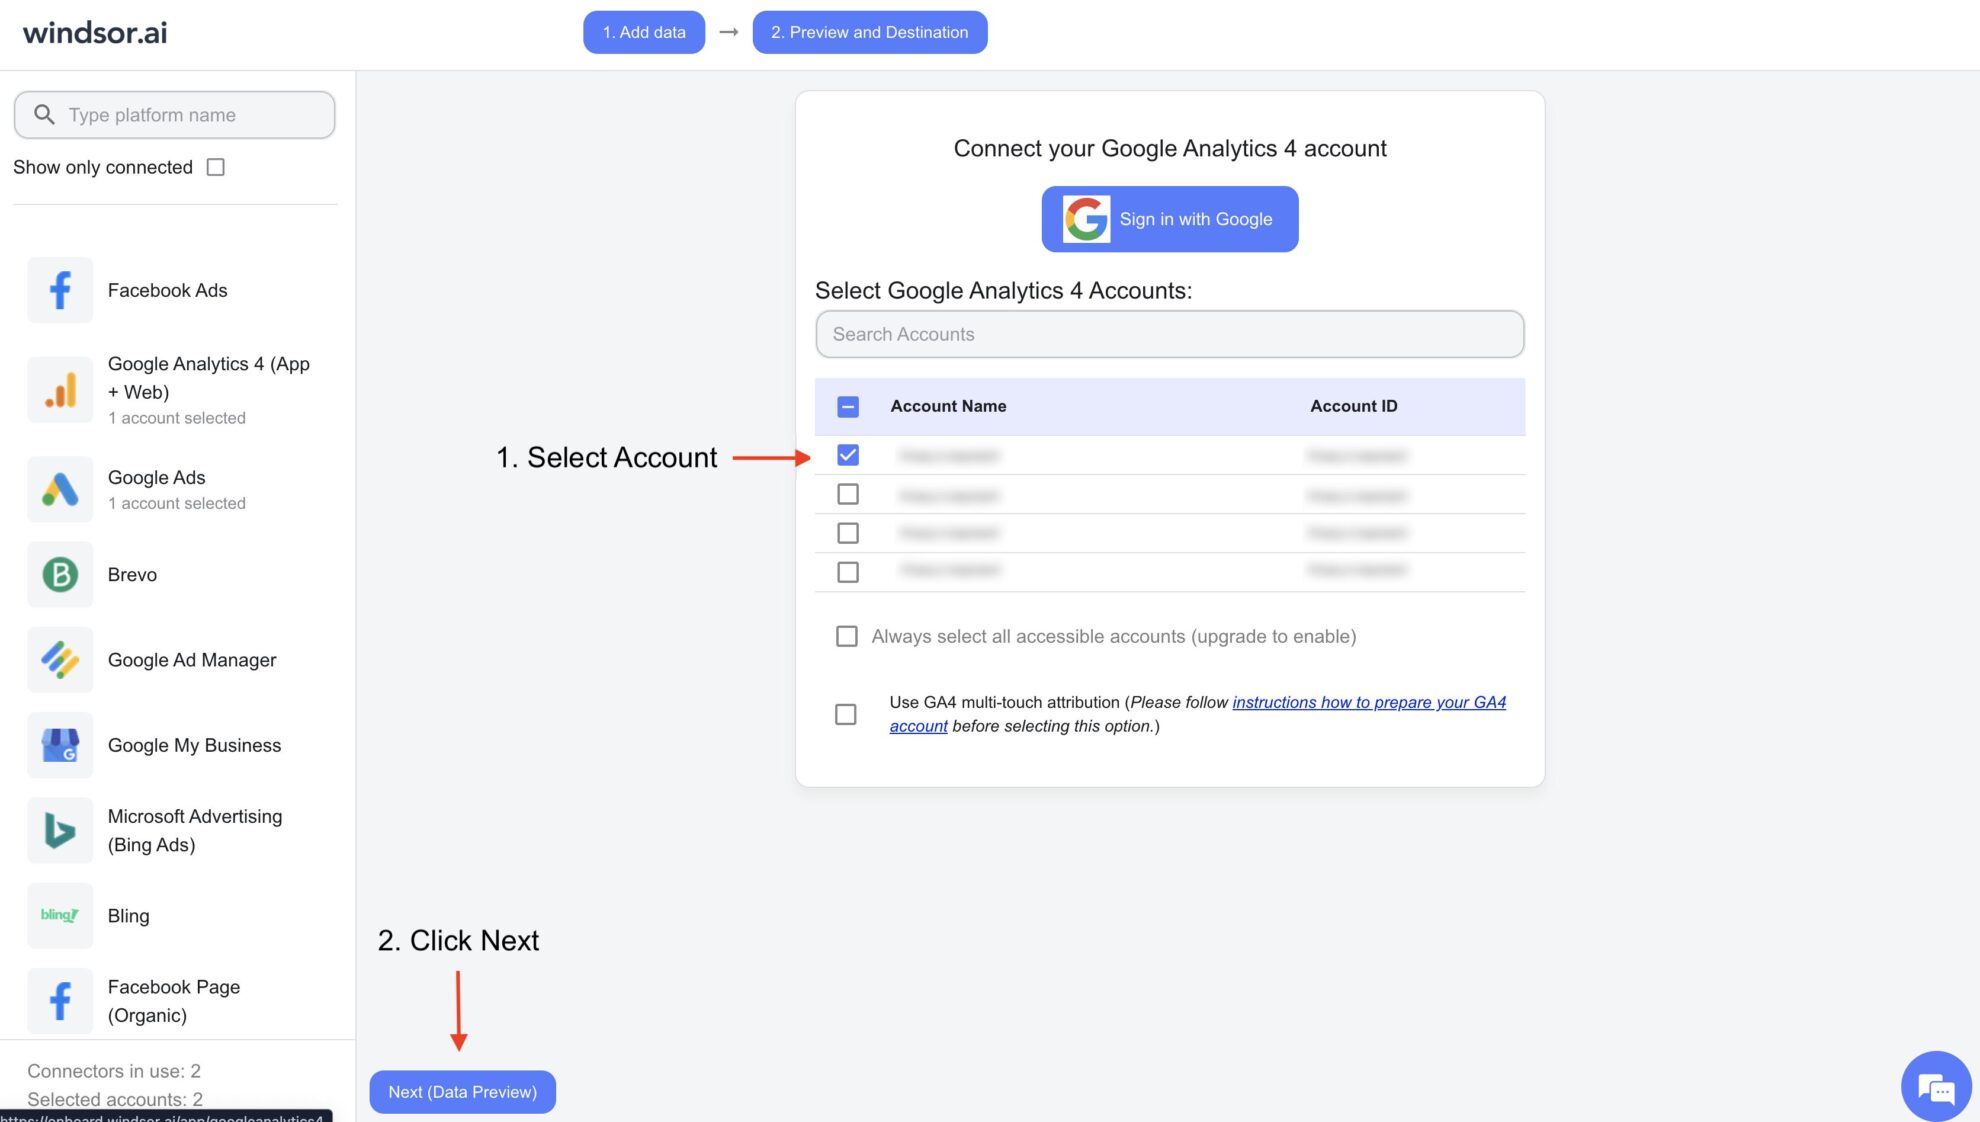
Connect your preferred data sources to Windsor.ai. Select the necessary account(s) you want to pull data from and click “Next.”
In Lovable, open Connectors and select Custom MCP.

Enter the following details:
Click Add & Authorize to save the connector and authorize access to Windsor.ai.

Once added, Windsor will appear in your list of connectors. Enable Always allow permissions for faster access.
Open a new chat and start querying your connected data.

Eliminate manual exports and data preparation. Windsor MCP automatically syncs your business data to Lovable, so you can analyze performance across your entire stack, spot trends and gaps, and turn your findings into working web applications.
Ask Lovable to surface your most important metrics (daily, weekly, or monthly) and get a clear, structured summary in seconds. Keep drilling down with follow‑up questions, refining by date range, metric, or campaign until you have the insights you need.
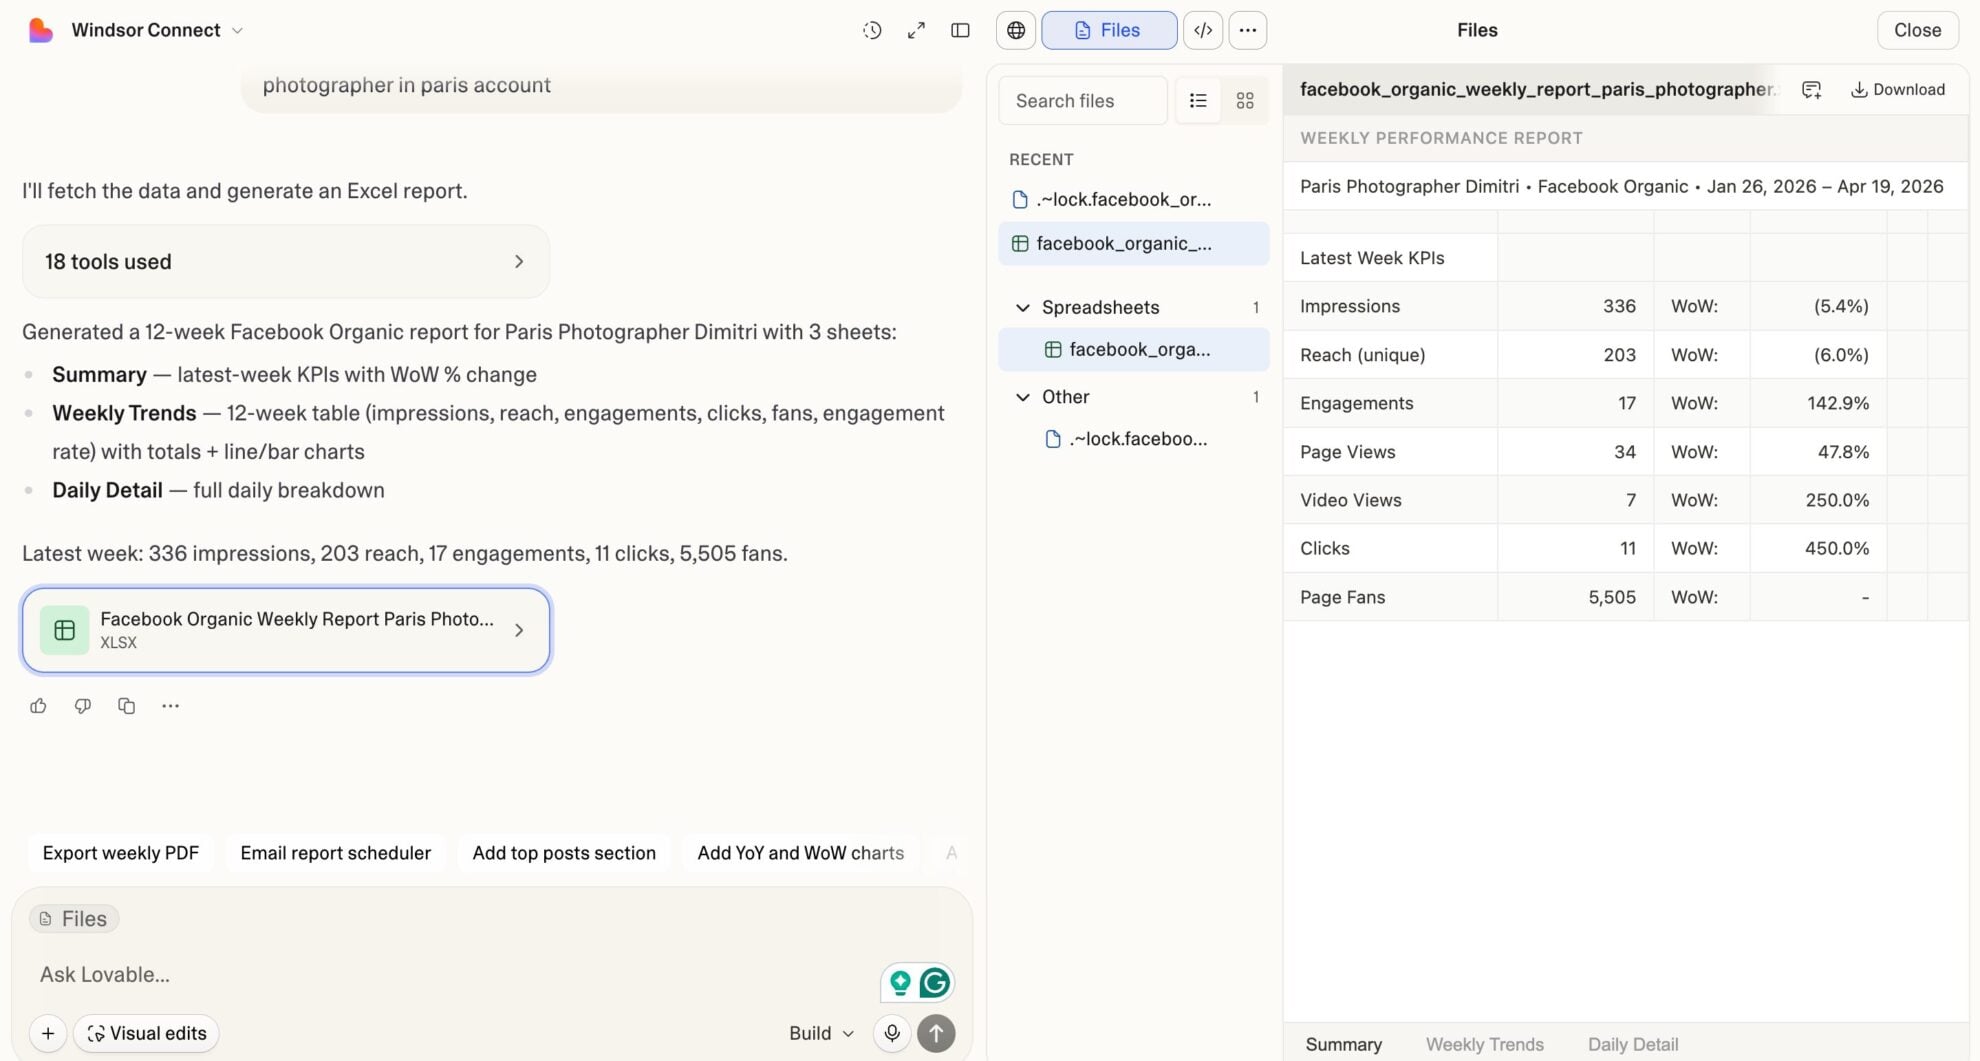
Ask Lovable to analyze performance over any time range, compare periods, and surface patterns in your data. See which campaigns are growing, where budget is leaking, and where funnel gaps are costing you the most, before they compound into bigger problems.
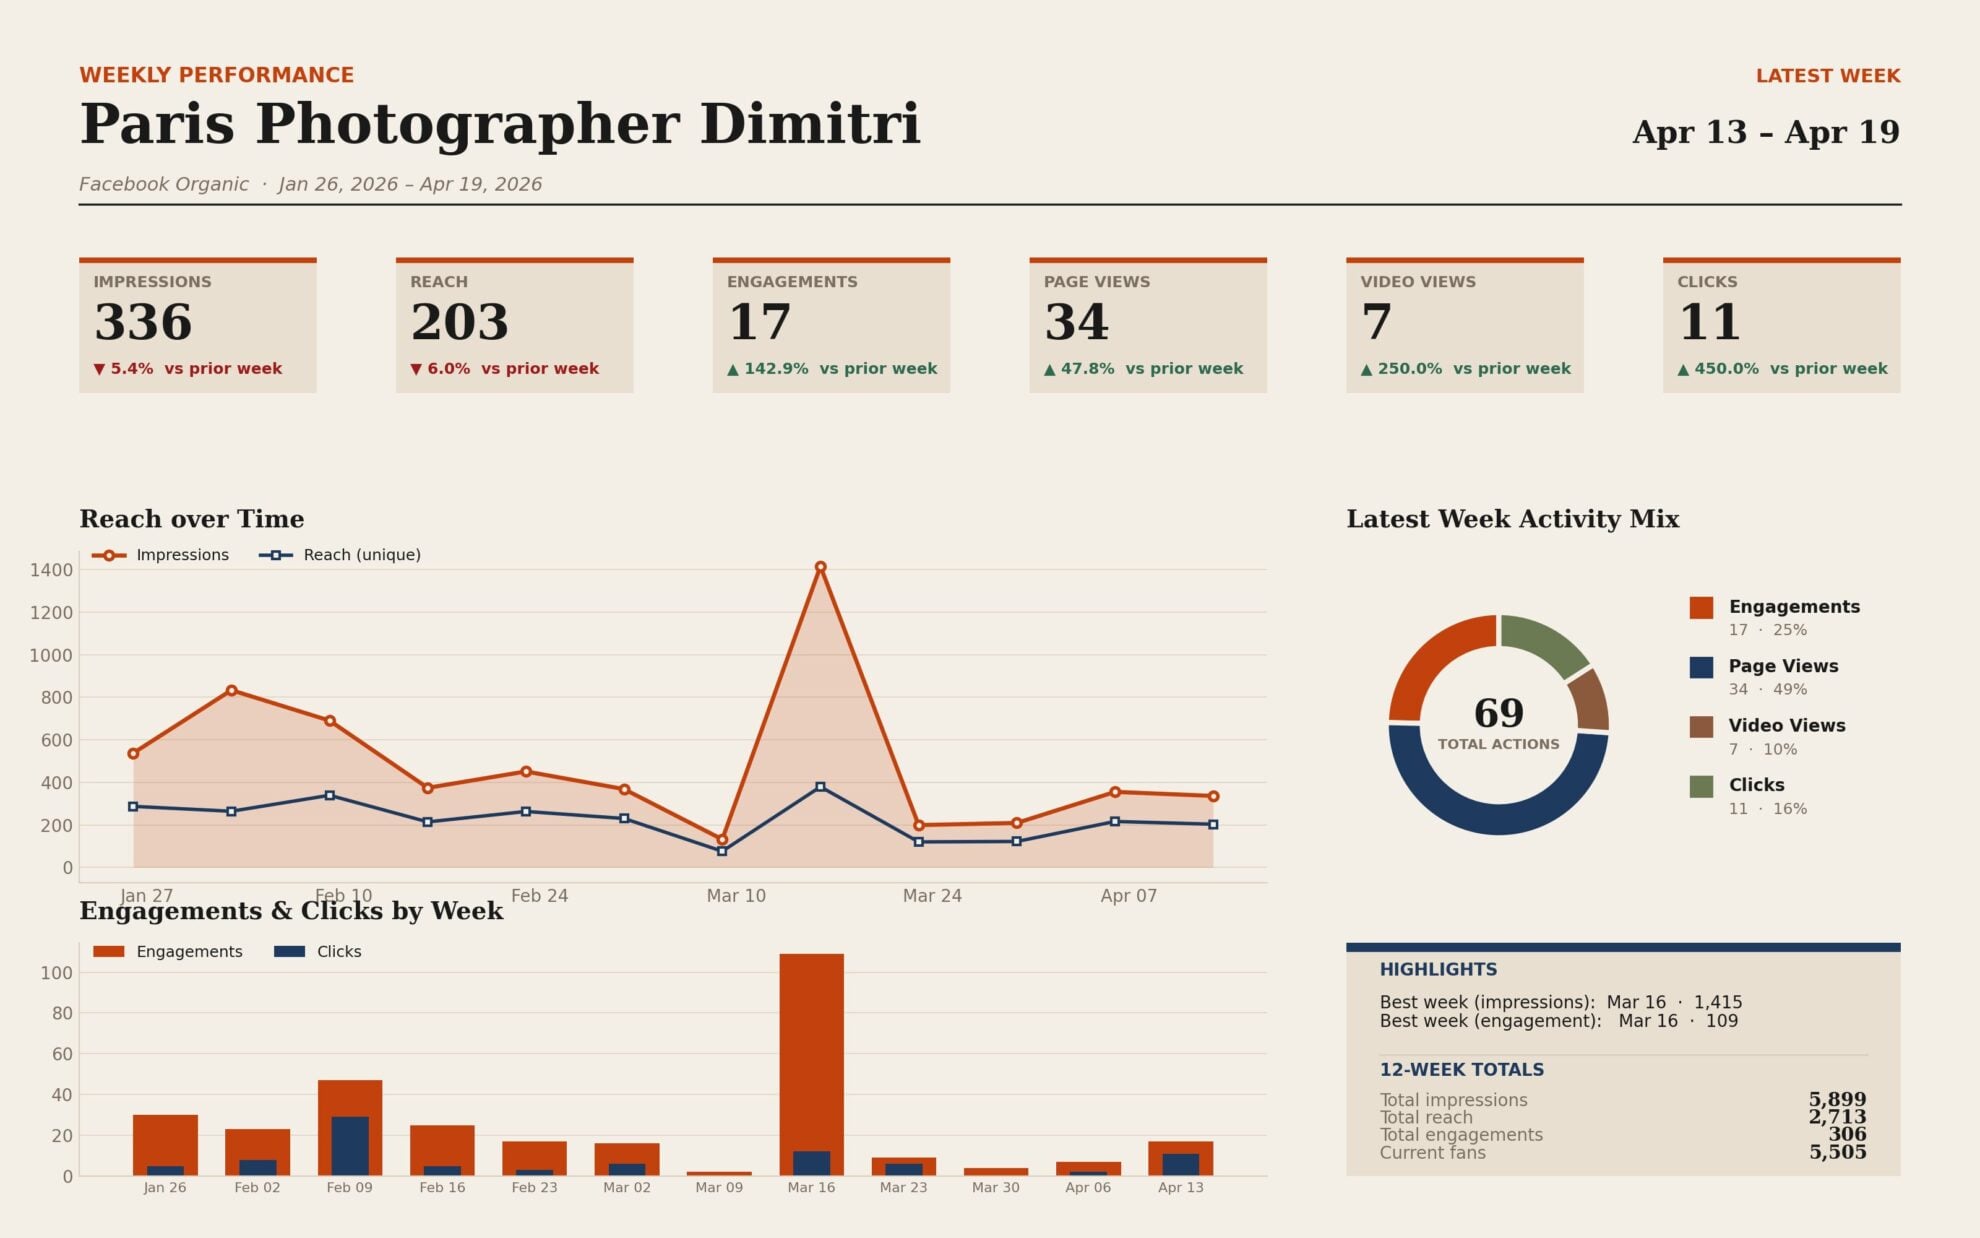
Turn your analysis into a real dashboard in seconds: performance summaries, spend vs. revenue breakdowns, channel comparisons. It lives at a real URL, updates automatically, and is accessible to anyone you share it with. No BI tool, no developer, no static PDF that’s outdated the moment you send it.
Most AI tools see one slice of your data. Windsor.ai connects your entire stack (ads, email, CRM, e-commerce, analytics), so Lovable can answer what actually matters. Did your Facebook campaigns drive real revenue? Are your emails retaining customers after the first purchase? Which touchpoints move people from awareness to conversion? See the complete picture, not just what one platform tells you.
Ask Lovable to surface your most important metrics (daily, weekly, or monthly) and get a clear, structured summary in seconds. Keep drilling down with follow‑up questions, refining by date range, metric, or campaign until you have the insights you need.
Ask Lovable to analyze performance over any time range, compare periods, and surface patterns in your data. See which campaigns are growing, where budget is leaking, and where funnel gaps are costing you the most, before they compound into bigger problems.
Turn your analysis into a real dashboard in seconds: performance summaries, spend vs. revenue breakdowns, channel comparisons. It lives at a real URL, updates automatically, and is accessible to anyone you share it with. No BI tool, no developer, no static PDF that’s outdated the moment you send it.
Most AI tools see one slice of your data. Windsor.ai connects your entire stack (ads, email, CRM, e-commerce, analytics), so Lovable can answer what actually matters. Did your Facebook campaigns drive real revenue? Are your emails retaining customers after the first purchase? Which touchpoints move people from awareness to conversion? See the complete picture, not just what one platform tells you.
No. ChatGPT and Claude are language models: you ask questions and get answers in chat. Lovable uses AI differently: it can analyze your data conversationally, but it also turns those insights into real web applications such as dashboards, internal tools, and customer‑facing apps, deployed to a live URL your team can use any time.
Windsor MCP (Model Context Protocol) is Windsor.ai’s infrastructure that securely delivers clean, structured data from your connected sources directly into Lovable. It handles data aggregation, normalization, and delivery under the hood, so instead of preparing and exporting data manually, you can jump straight into analysis and building.
Things you can do with Windsor.ai for Lovable:
Learn more: How to Use Windsor MCP for AI Data Analysis: Examples & Use Cases
Lovable can connect to individual platforms natively, but that means one source at a time. Windsor.ai connects your entire stack simultaneously, including Meta Ads, Google Ads, GA4, Shopify, HubSpot, Salesforce, and 350+ more marketing, CRM, and analytics platforms. With all your business data in one place, you can analyze the entire customer journey, break down silos, and make smarter decisions.
Windsor.ai has a free forever plan (1 data source, 1 user, 1 account). If you need more data sources, paid plans start at $90/month. See all options at windsor.ai/pricing.
Yes. Custom MCP connectors, including Windsor.ai, are only available on Lovable paid plans.
Under a minute. Connect your data sources in Windsor.ai, add Windsor as a Custom MCP connector in Lovable, authorize, and start querying immediately.
Yes. Windsor.ai adheres to industry‑standard security practices to ensure your data is handled safely. Lovable only accesses the data you explicitly connect via the Windsor.ai integration.
Lovable can answer a wide range of questions about your connected Windsor data. Ask it to summarize KPIs, compare channel performance, identify trends, explain anomalies, or get recommendations for optimizing your strategy and budget.
To get started quickly, check out our AI Prompt Library, which provides ready-to-use prompts tailored to different data sources and reporting needs.