Connect RTB House to Google Data Studio
Directly connect RTB House to Looker Studio in an easy-to-use format.

Analyze Your Marketing Metrics from RTB House in GDS
About RTB House
About Google Data Studio
Why integrate RTB House with Google Data Studio?
- Integrating RTB House data with Google Data Studio can help you gain a better understanding of your audience and how they respond to your paid media campaigns. You can create more effective campaigns and increase ROI by understanding how your target audience interacts with your ads.
- You can integrate multiple data sources into Google Data Studio reports & dashboards which can be useful for creating more comprehensive and holistic views of your campaign performance.
- By integrating RTB House with Google Data Studio, you can track specific goals and conversions, allowing you to measure the impact of your programmatic advertising efforts on business objectives.
About the RTB House Google Data Studio Connector
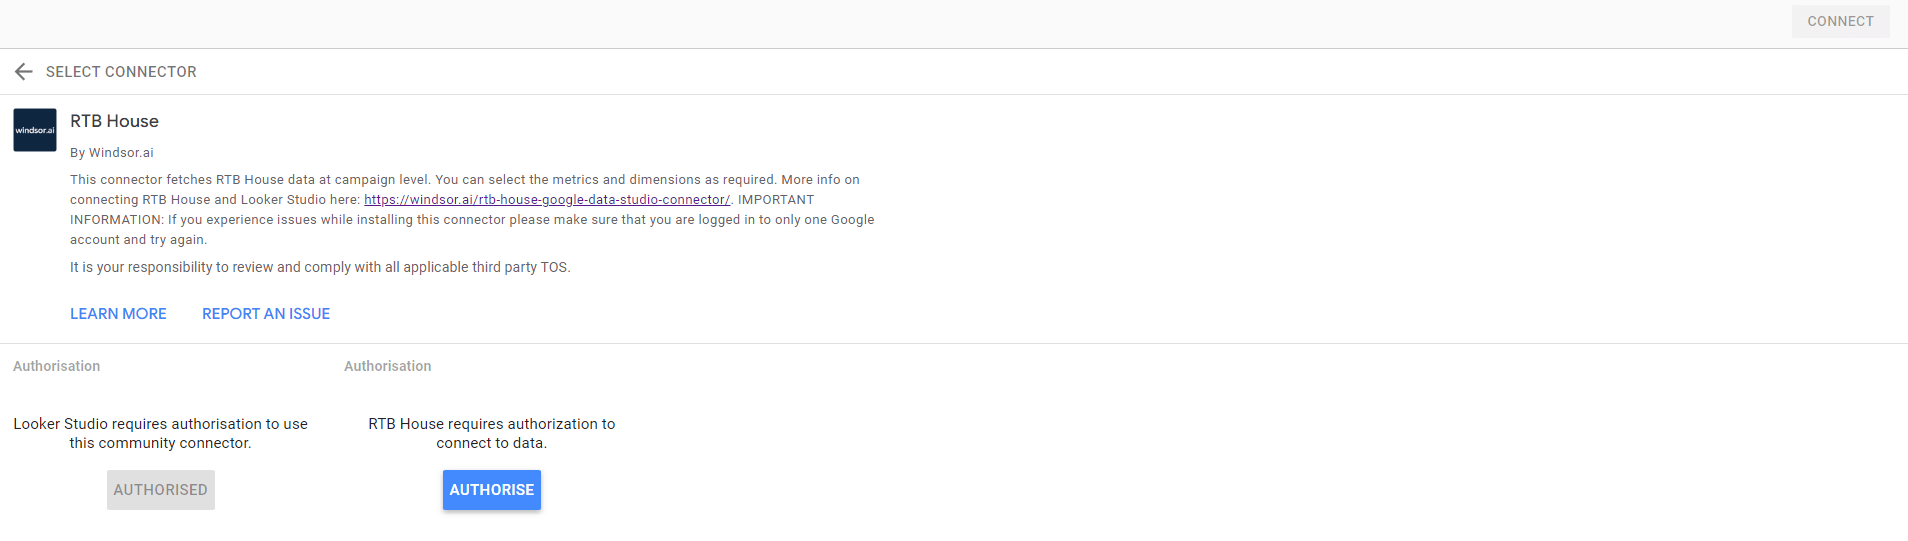
The RTB House Google Data Studio Connector pulls metrics and dimensions for RTB House. The Insights are retrieved at the campaign and ad levels.
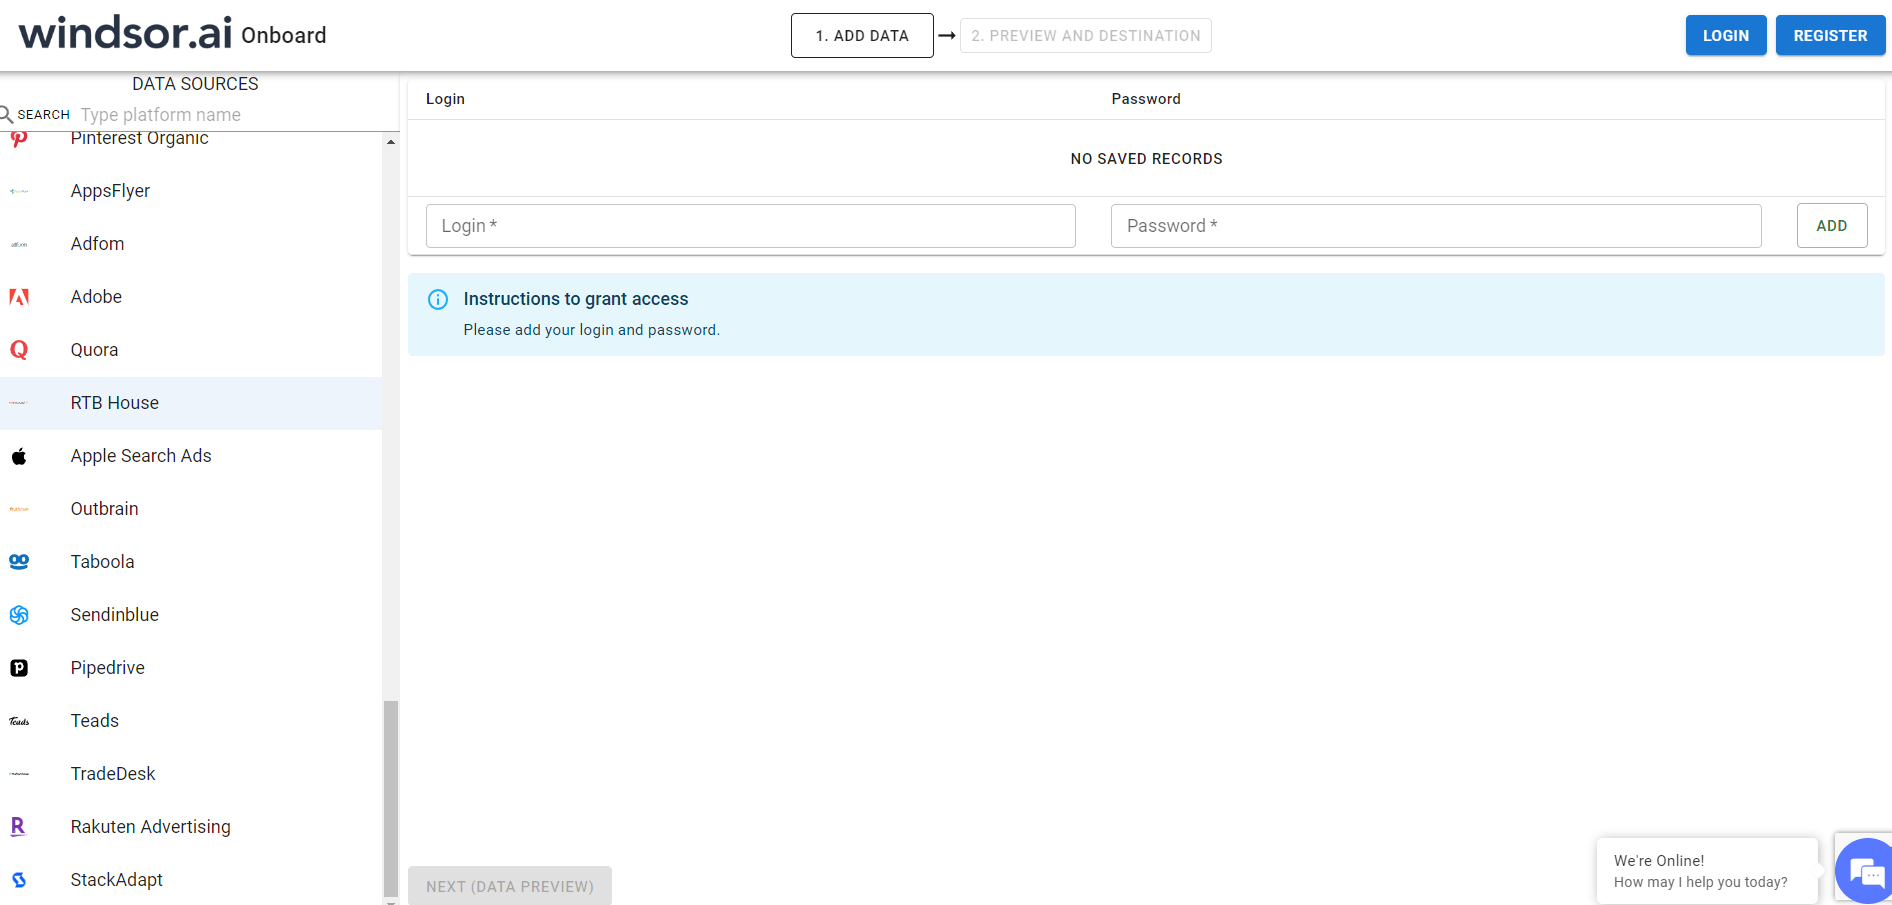
Once the user successfully logs into the connector he can then choose the metrics and dimensions he is interested to create a report on.
Prerequisites
To set up the connector, the user should have:
- A RTB House advertiser account (Visit our privacy policy and terms of use)
- Google account for RTB House to Google Data Studio integration.
- A Windsor account. Start your free trial now.
How to connect RTB House to Google Data Studio?
Do you plan to connect and visualize your RTB House in Google Data Studio? Follow the Tutorial Below:
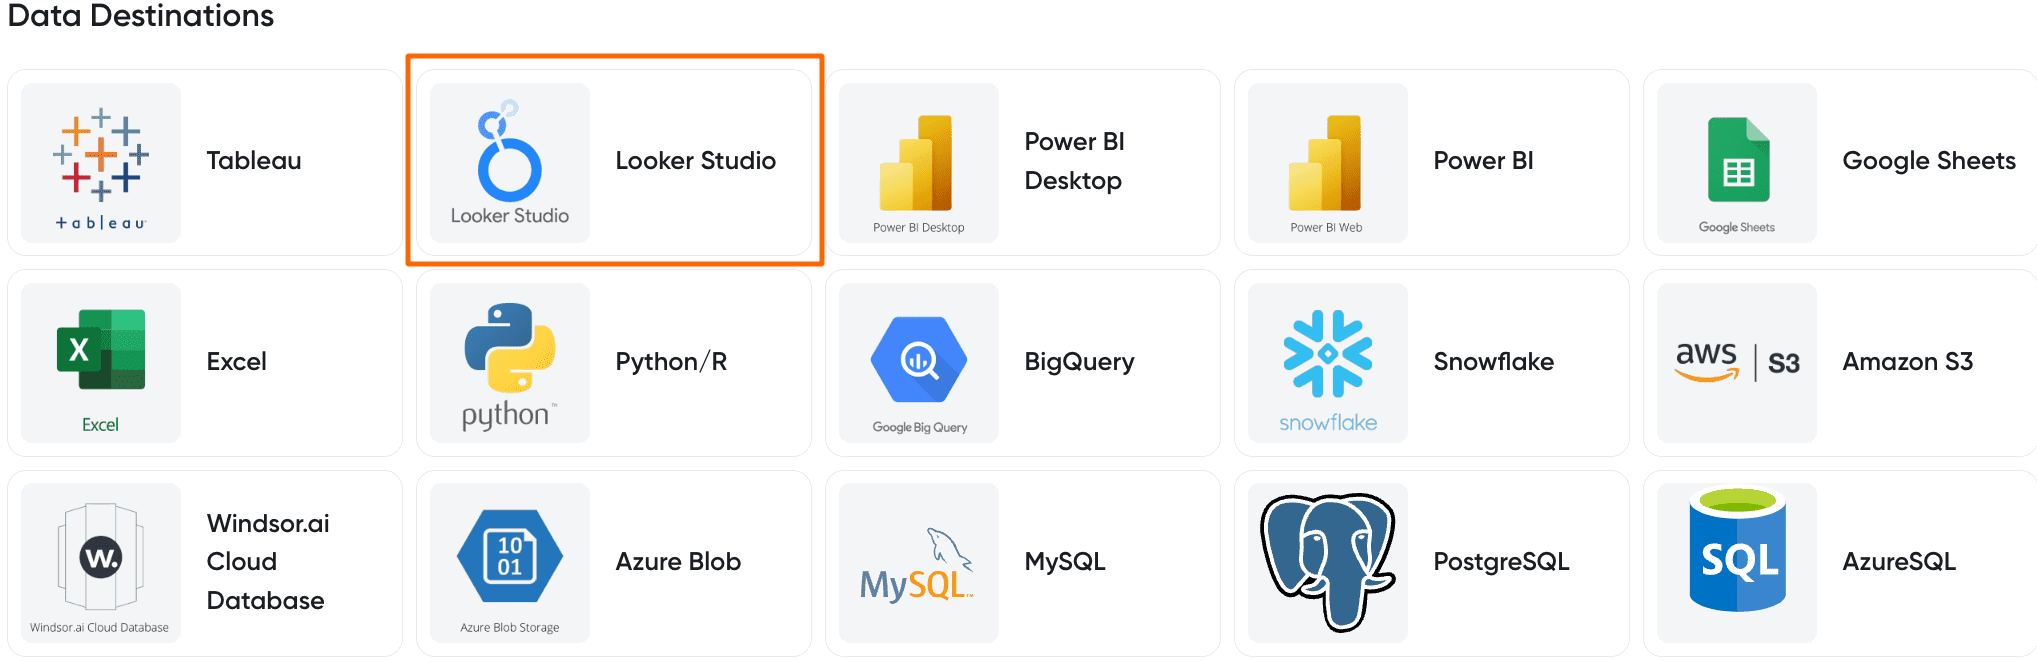
Select the fields on the right to later use in your data source. For example, you can include metrics such as Cost per Click, Cost per Action or Total Spend. Go to “Select Destination” and choose Looker Studio. Once done, select “connect” and authorize access to your data source.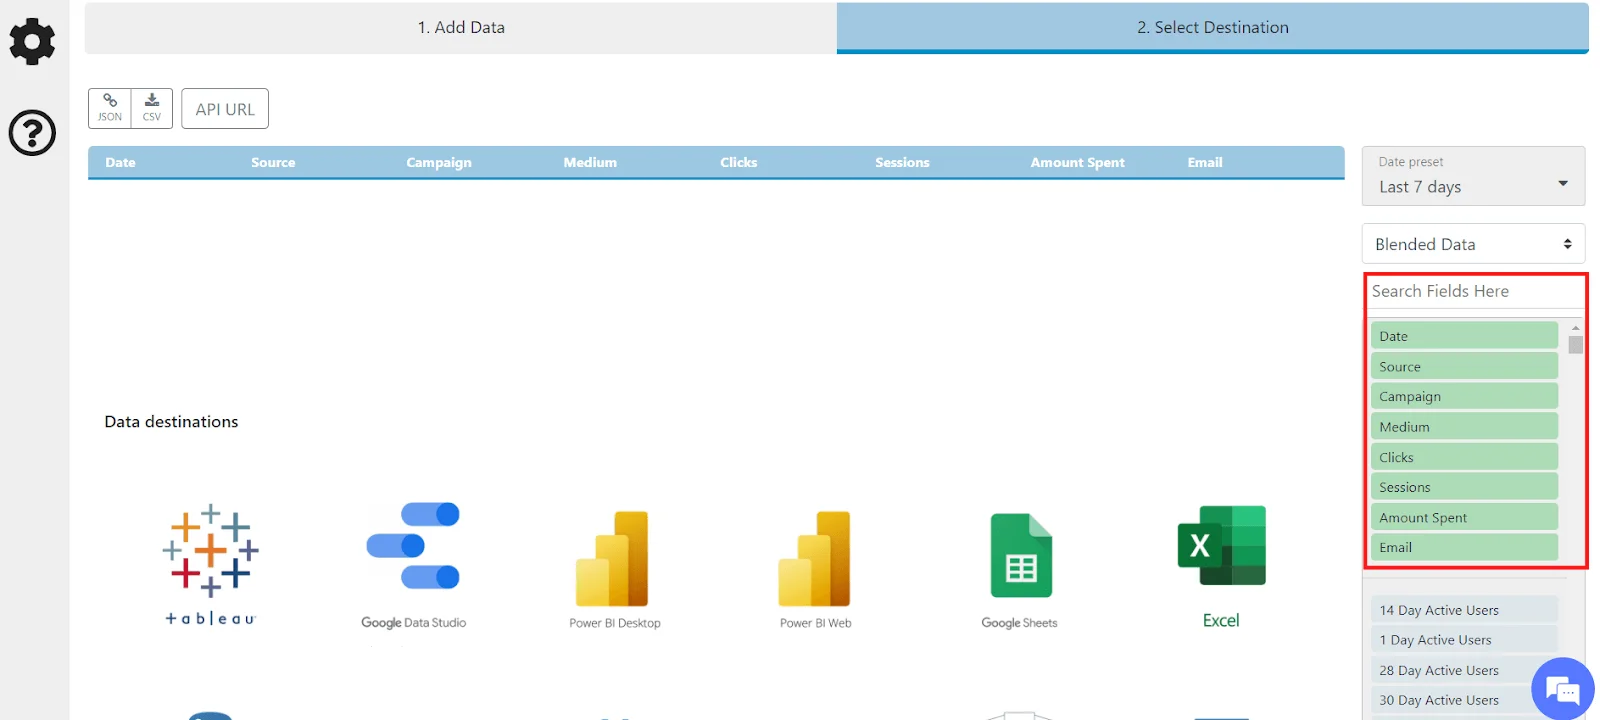
Extract RTB House data to Looker Studio with Windsor.ai
See the value and return on every marketing touchpoint

Providing 70+ marketing data streams, we make sure that all the data we integrate is fresh and accessible by marketers, whenever they want.

Spend less time on manual data loading and spreadsheets. Focus on delighting your customers.