 AI insights
 About us
 Careers
 Security
 Customer reviews
 Contact us
 Affiliate program
 Solution partners
 Looker Studio templates
 Tableau templates
 Facebook Ads templates
 Google Ads templates
 Data fields & Metrics
 API documentation
 Product documentation
 Case studies
 Data models
 Blog
Blog Product updates
 Windsor vs Supermetrics
 Windsor vs Fivetran
 Windsor vs Portermetrics
Connect Taboola to Data Studio (Looker Studio)
Easily integrate Taboola with Data Studio through Windsor.ai ETL connectors.
Our platform automates Taboola reporting, delivering real-time visibility into campaign performance that helps you optimize spend, improve ROI, and scale high-performing ads.
Forget CSVs. Stop copy/paste. Connect data in 2 minutes. No code required.


Make the most of your ad data with Taboola to Data Studio integration
By connecting Taboola with Data Studio through Windsor.ai, you can easily track your campaign performance in real-time and unlock these key benefits:

Automate reporting
Automate reporting
Windsor.ai automatically syncs key Taboola metrics such as impressions, spend, clicks, cost, and conversions into Data Studio. Dashboards update on a scheduled basis, ensuring your team always works with fresh and accurate data ready for analysis.

Unify data across channels
Unify data across channels
Combine Taboola data with marketing, sales, or analytics platforms in Data Studio to build a unified performance view. This holistic perspective shows how native ads contribute to traffic, conversions, and revenue, enabling smarter budget allocation and cross-channel optimization.

Optimize campaign efficiency
Optimize campaign efficiency
Data Studio dashboards make it easy to drill down into CPC, CTR, and ROAS across campaigns. With clear visualizations, you can identify high-performing content, adjust targeting, and continuously improve ad efficiency.
Using Windsor.ai connector to import data from Taboola to Data Studio
Most methods to integrate Taboola with Data Studio are complex, expensive, and require technical expertise. Windsor.ai simplifies the process with a fast, affordable, and no-code solution.
Our ETL connector automatically imports Taboola advertising data into Data Studio within minutes, centralizing campaign metrics in dynamic, auto-refreshing dashboards.
How to connect Taboola to Data Studio in Windsor.ai
Make sure you have the following prerequisites before setting up the connector:
- Taboola account (Visit our privacy policy and terms of use)
- Google account for Data Studio integration
- Active Windsor.ai account
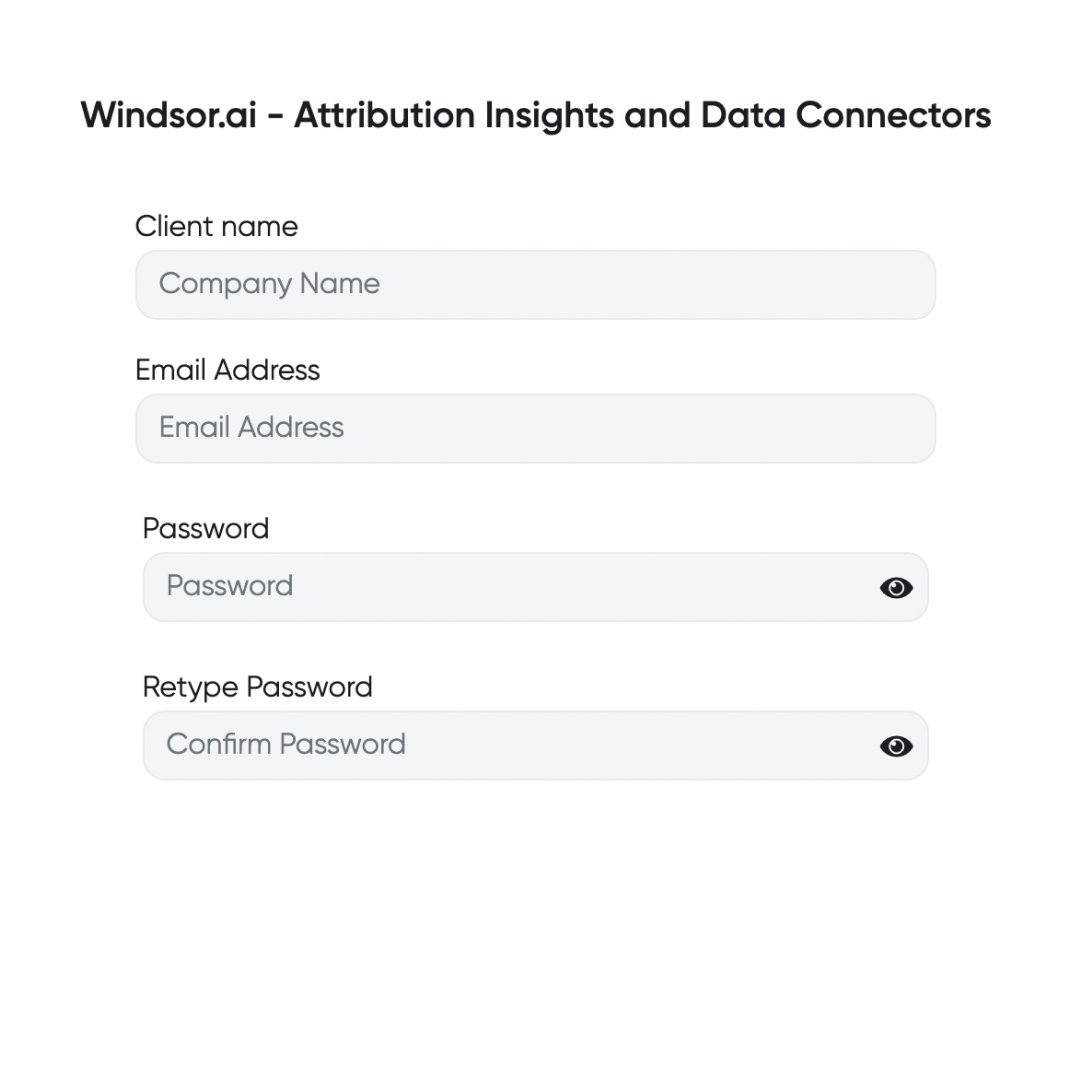
Register and log in to Windsor.ai
Create a new Windsor.ai account or log in if you already have one.
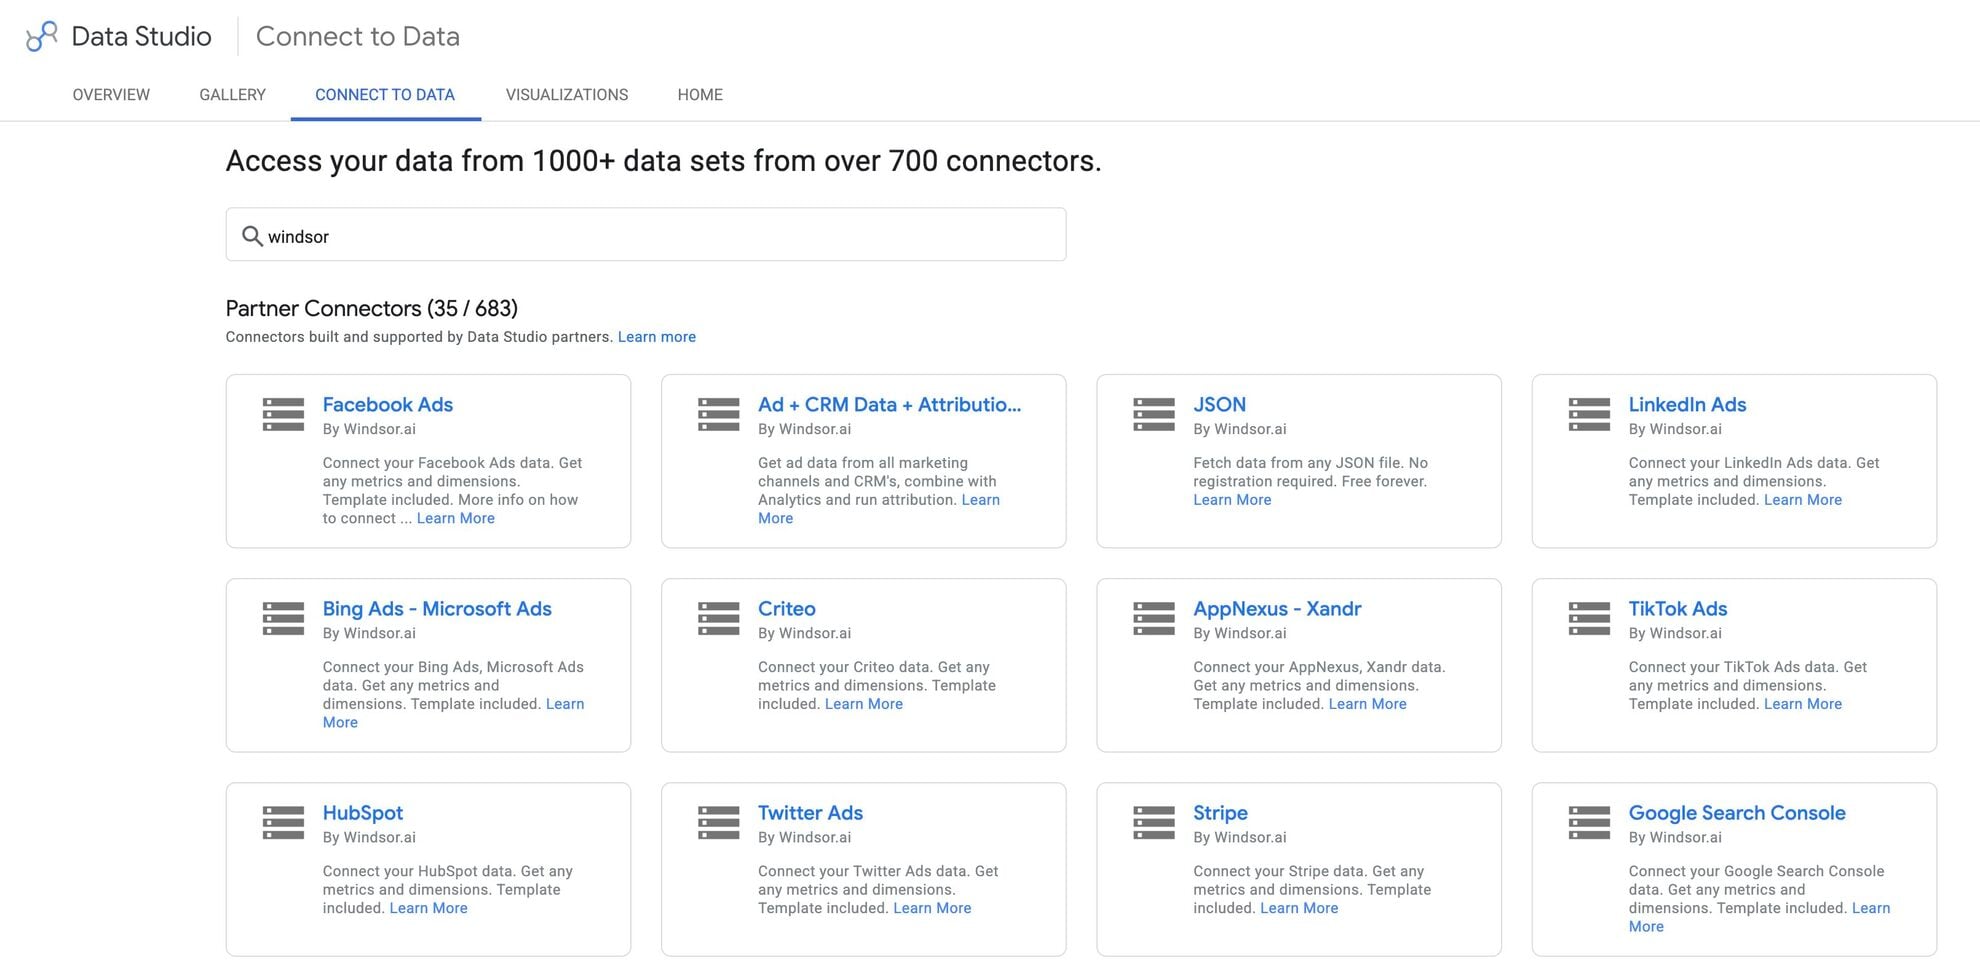
Select your data source
Choose Taboola as your data source and grant access to Windsor.ai.

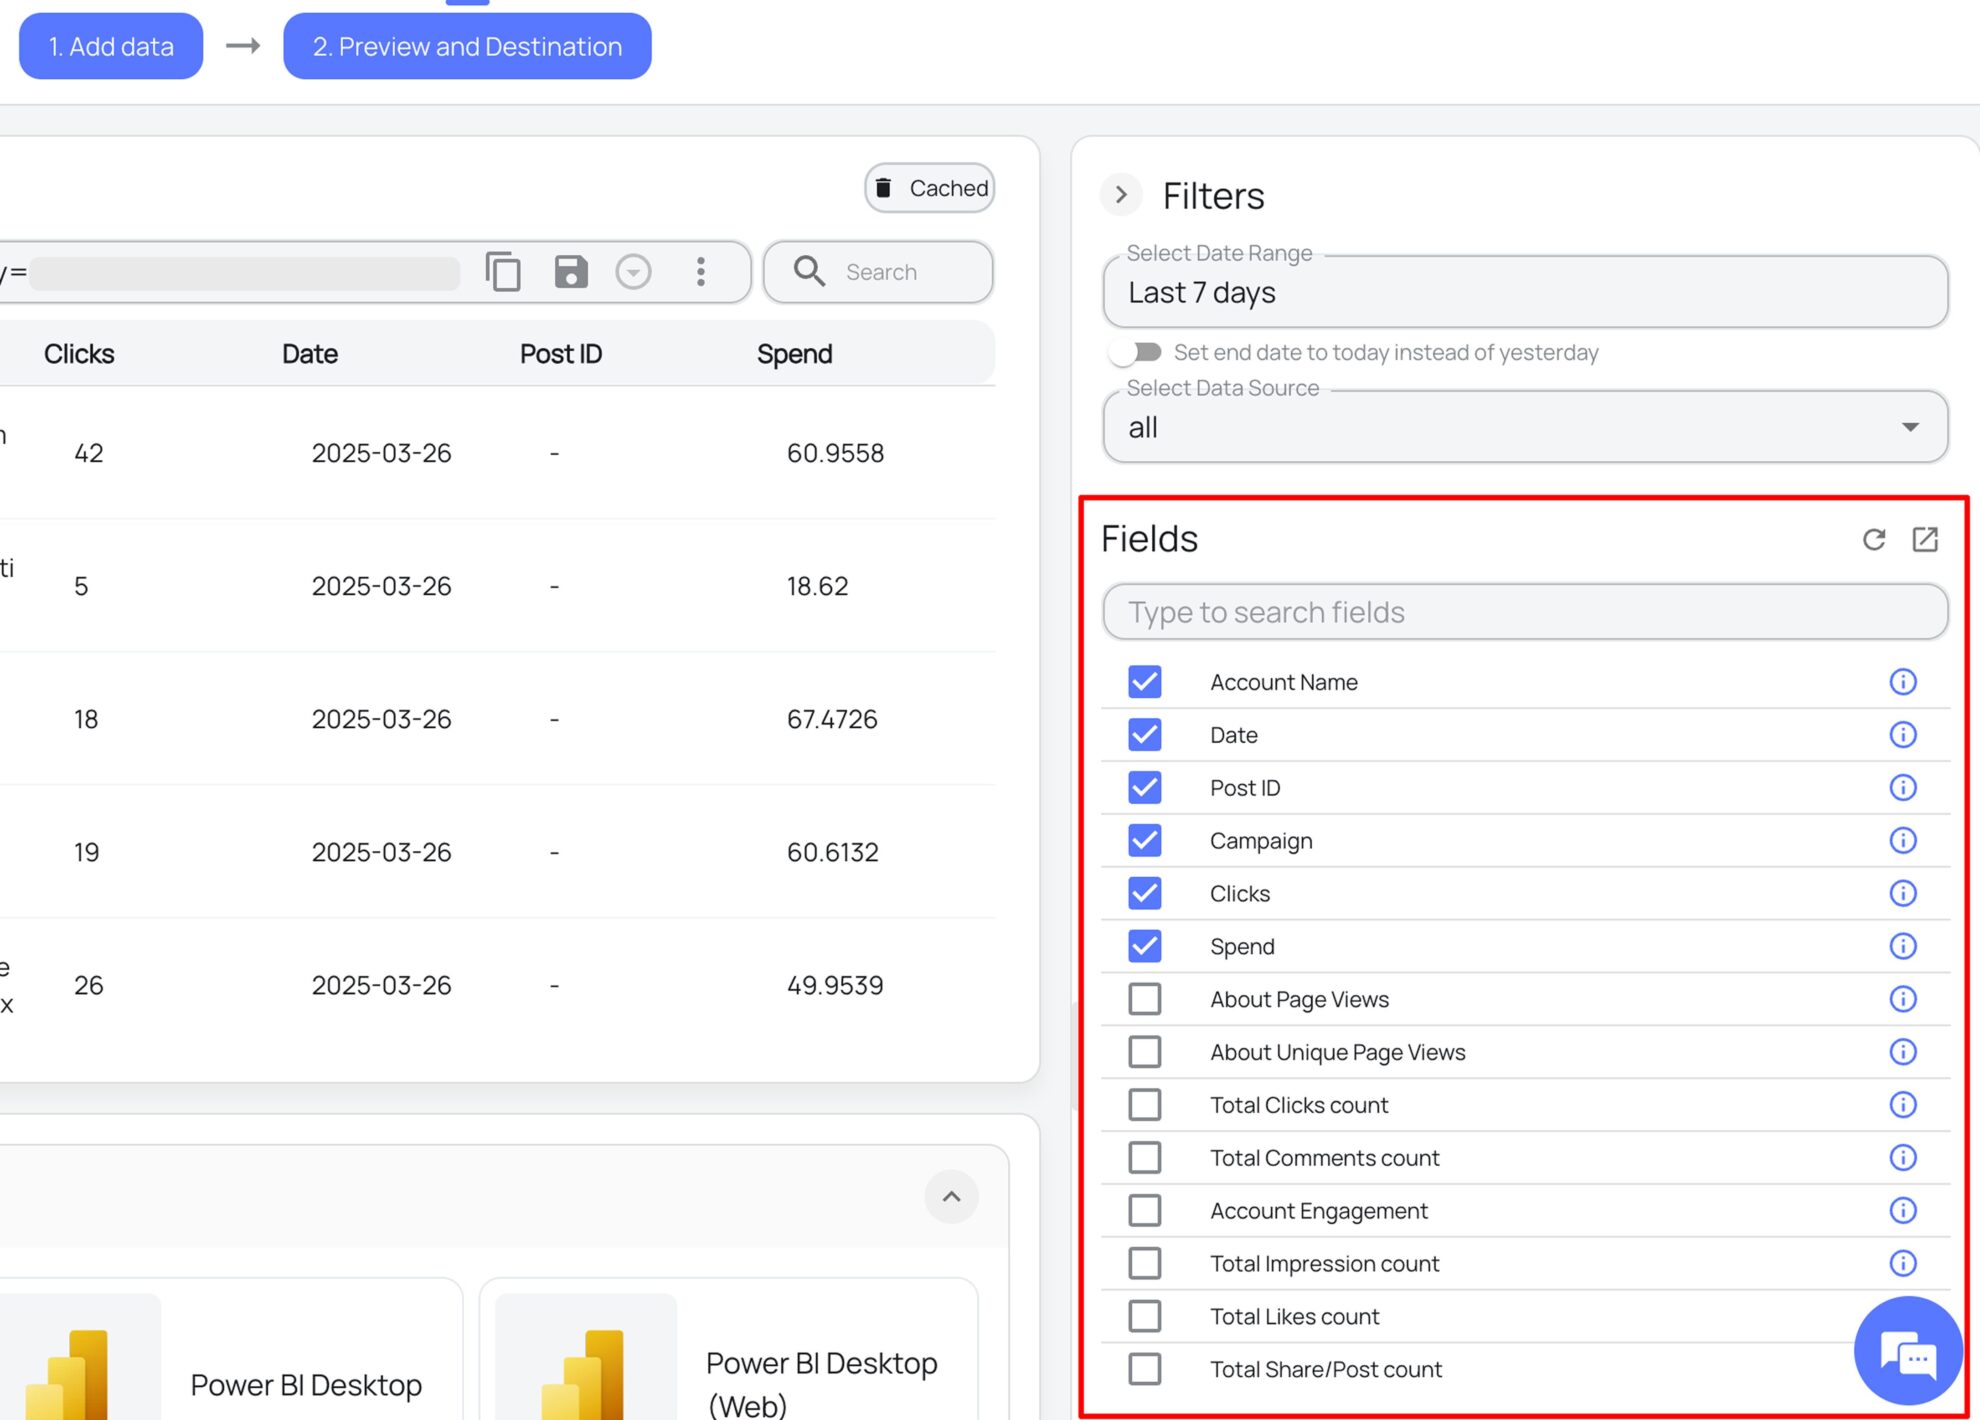
Select the reporting metrics and dimensions
Choose the Taboola fields you want to import into Data Studio on the right side and preview your data before export.
Select Data Studio as your data destination
Scroll down to the list of data destinations and click Data Studio. Install the Windsor.ai connector by authorizing your account, selecting the required Taboola account(s), and clicking Connect → Create Report.

FAQs
What is Data Studio?
Data Studio (Looker Studio) is Google’s premier data visualization and reporting platform that enables you to connect multiple data sources, create interactive visualizations, and share reports with your team to support data-driven decisions. With customizable dashboards, you can present data through graphs and charts. Data Studio also integrates with other Google Cloud tools, such as Workspace and AI, enabling advanced data processing and seamless team collaboration.
Do you have helpful links to get started with integrating Taboola and Data Studio using Windsor.ai?
Yes, we have helpful resources to help you get started. You can explore our official documentation and ready-to-use templates for seamless Taboola to Data Studio integration with Windsor.ai:
How much does it cost to integrate Taboola into Data Studio with Windsor.ai?
Windsor.ai’s pricing for Taboola to Data Studio data integration can vary depending on your use case and data volume. We offer transparent pricing plans tailored to diverse business needs and budgets.
How much time do I need to create the Taboola and Data Studio integration?
Windsor.ai provides a user-friendly interface and a robust data connector that extracts, transforms, and loads Taboola data into Data Studio in under 5 minutes, making the process quick and hassle-free.
Tired of manual Taboola data exports? Try Windsor.ai today to automate your reporting

