 AI insights
 About us
 Careers
 Security
 Customer reviews
 Contact us
 Affiliate program
 Solution partners
 Looker Studio templates
 Tableau templates
 Facebook Ads templates
 Google Ads templates
 Data fields & Metrics
 API documentation
 Product documentation
 Case studies
 Data models
 Blog
Blog Product updates
 Windsor vs Supermetrics
 Windsor vs Fivetran
 Windsor vs Portermetrics
Connect Outbrain to Looker Studio
Quickly integrate your Outbrain data into Looker Studio with the Windsor.ai ETL connectors.
Our platform automates Outbrain reporting, giving you real-time campaign visibility to spot trends faster, optimize content, and maximize ROI.
Forget CSVs. Stop copy/paste. Connect data in 2 minutes. No code required.


Optimize advertising campaigns with Outbrain to Looker Studio integration
Connecting Outbrain to Looker Studio via Windsor.ai automates data flows and helps you track KPIs in real time, compare campaigns, and unlock actionable insights instantly. Below are the key benefits this integration delivers to your business:

Improve content strategies
Improve content strategies
Outbrain campaigns generate detailed engagement data, including impressions, CTR, conversions, CPC, and more. By visualizing these metrics in Looker Studio, you can identify which headlines, creatives, and publishers drive the best results. This enables you to refine content strategies and allocate spend toward high-performing formats.

Enhance collaboration
Enhance collaboration
Centralize Outbrain data in Looker Studio, making performance insights accessible to marketing, media, and analytics teams. Shared dashboards reduce manual back-and-forth and ensure everyone works from the same up-to-date numbers. This alignment accelerates decision-making and campaign optimization.

Merge data across multiple channels
Merge data across multiple channels
Windsor.ai lets you combine Outbrain performance data with 325+ sources like Google Ads, Meta, CRM, and e-commerce platforms. In Looker Studio, you can compare channels side by side, build cross-channel attribution models, and understand the true ROI of your campaigns.
Using Windsor.ai connector to import data from Outbrain into Looker Studio
Integrating Outbrain with Looker Studio often requires manual exports, complex setups, or costly third-party tools. Windsor.ai simplifies this with a no-code ETL connector that automatically syncs your Outbrain data into Looker Studio for real-time reporting.
In just a few clicks, you can access complete advertising analytics in dynamic, auto-refreshing dashboards.
How to connect Outbrain to Looker Studio in Windsor.ai
Make sure you have the following prerequisites before setting up the connector:
- Outbrain account (Visit our privacy policy and terms of use)
- Google account for Looker Studio integration
- Active Windsor.ai account
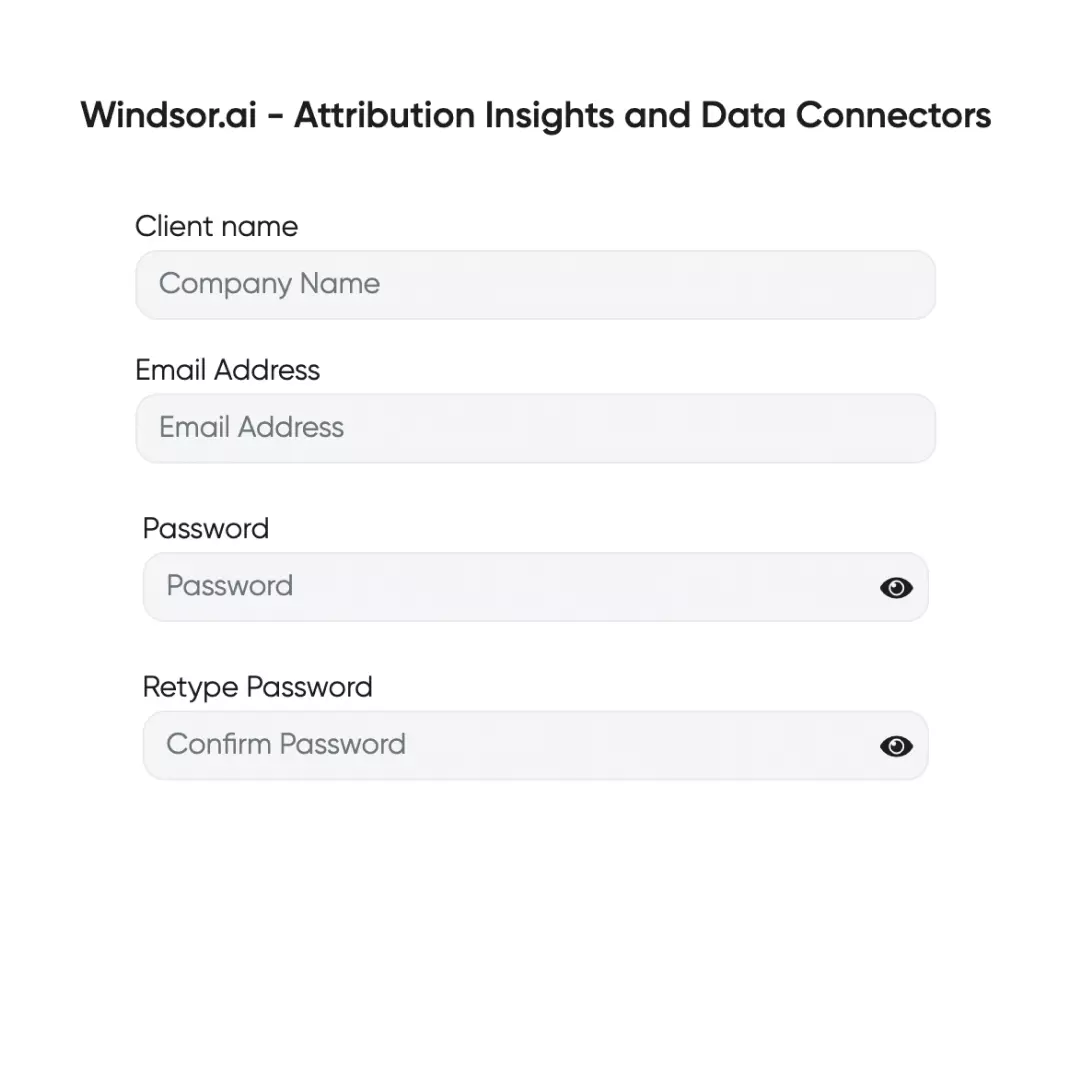
Register and log in to Windsor.ai
Create a new Windsor.ai account or log in if you already have one.
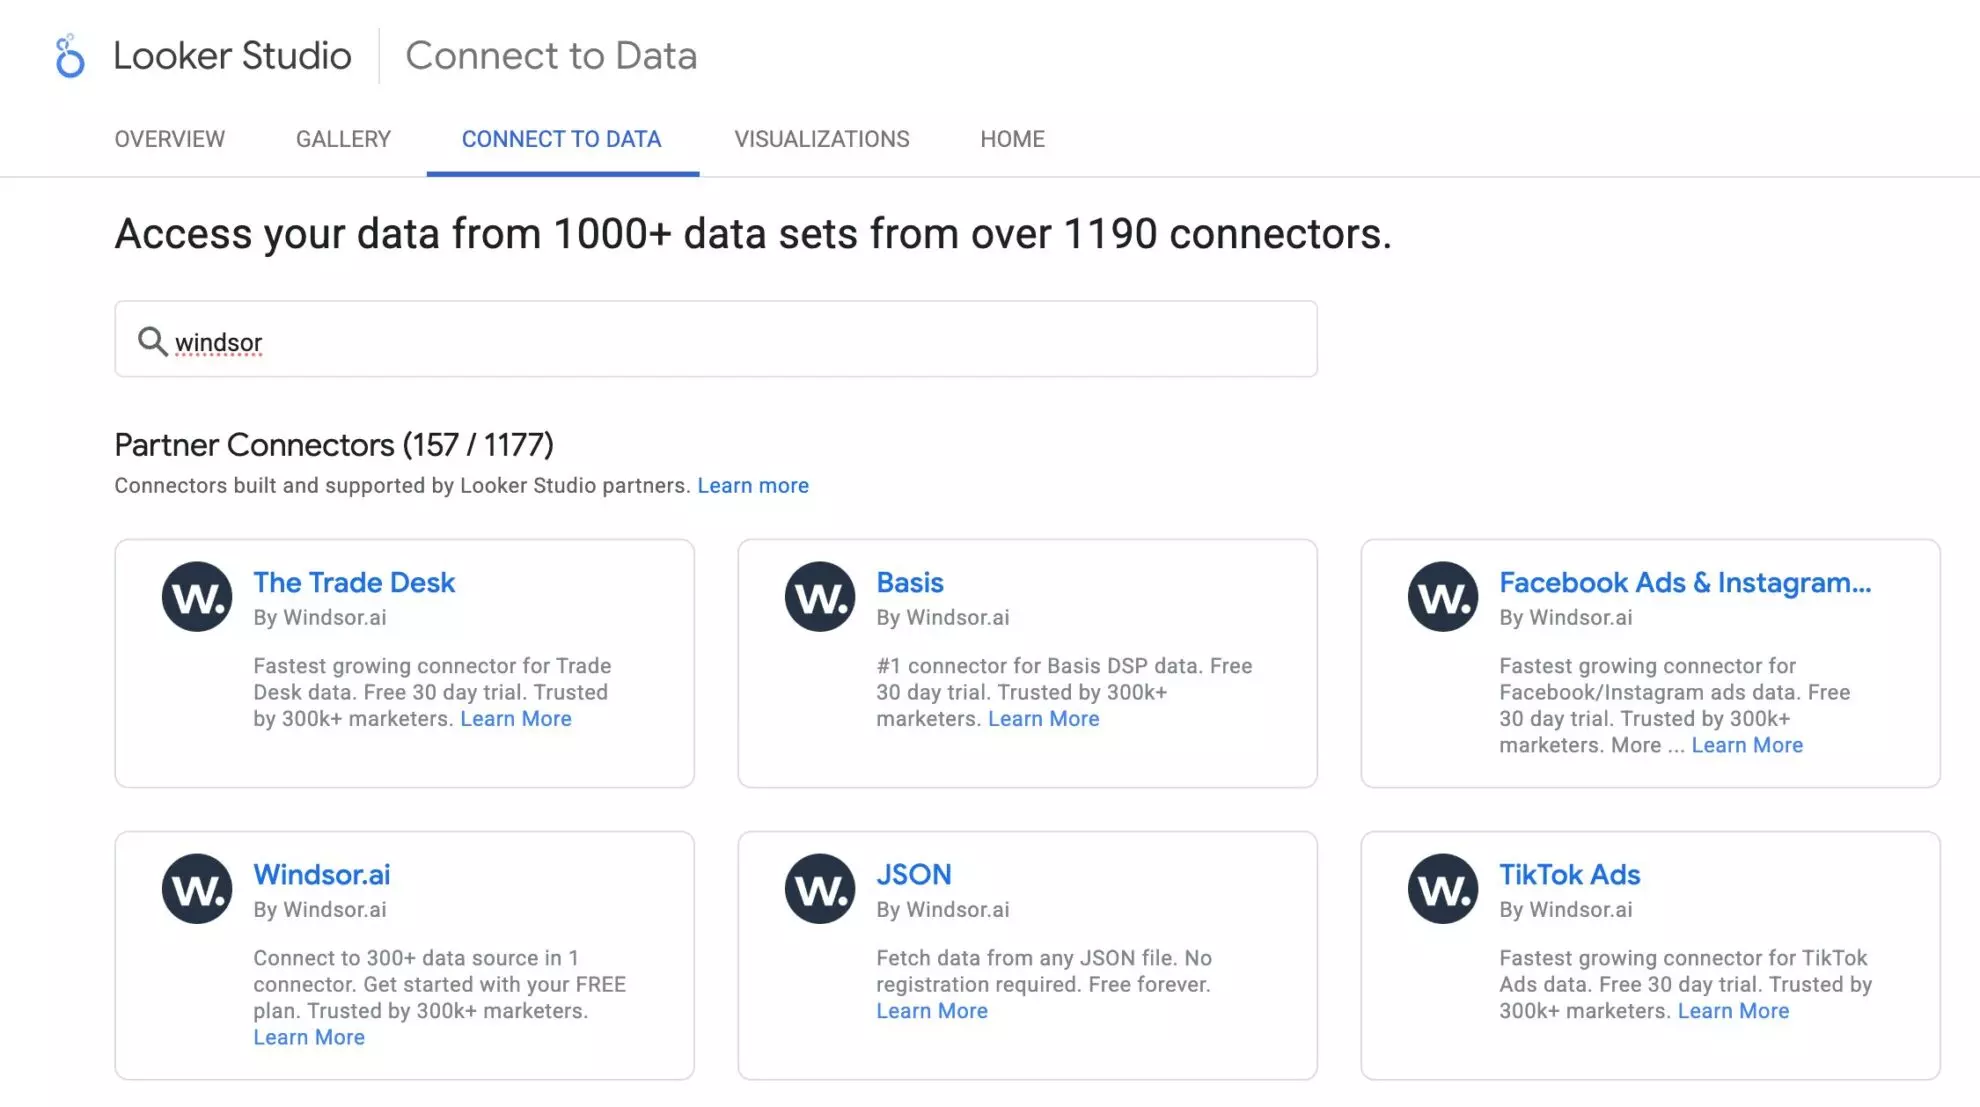
Select your data source
Choose Outbrain as your data source and grant access to Windsor.ai.

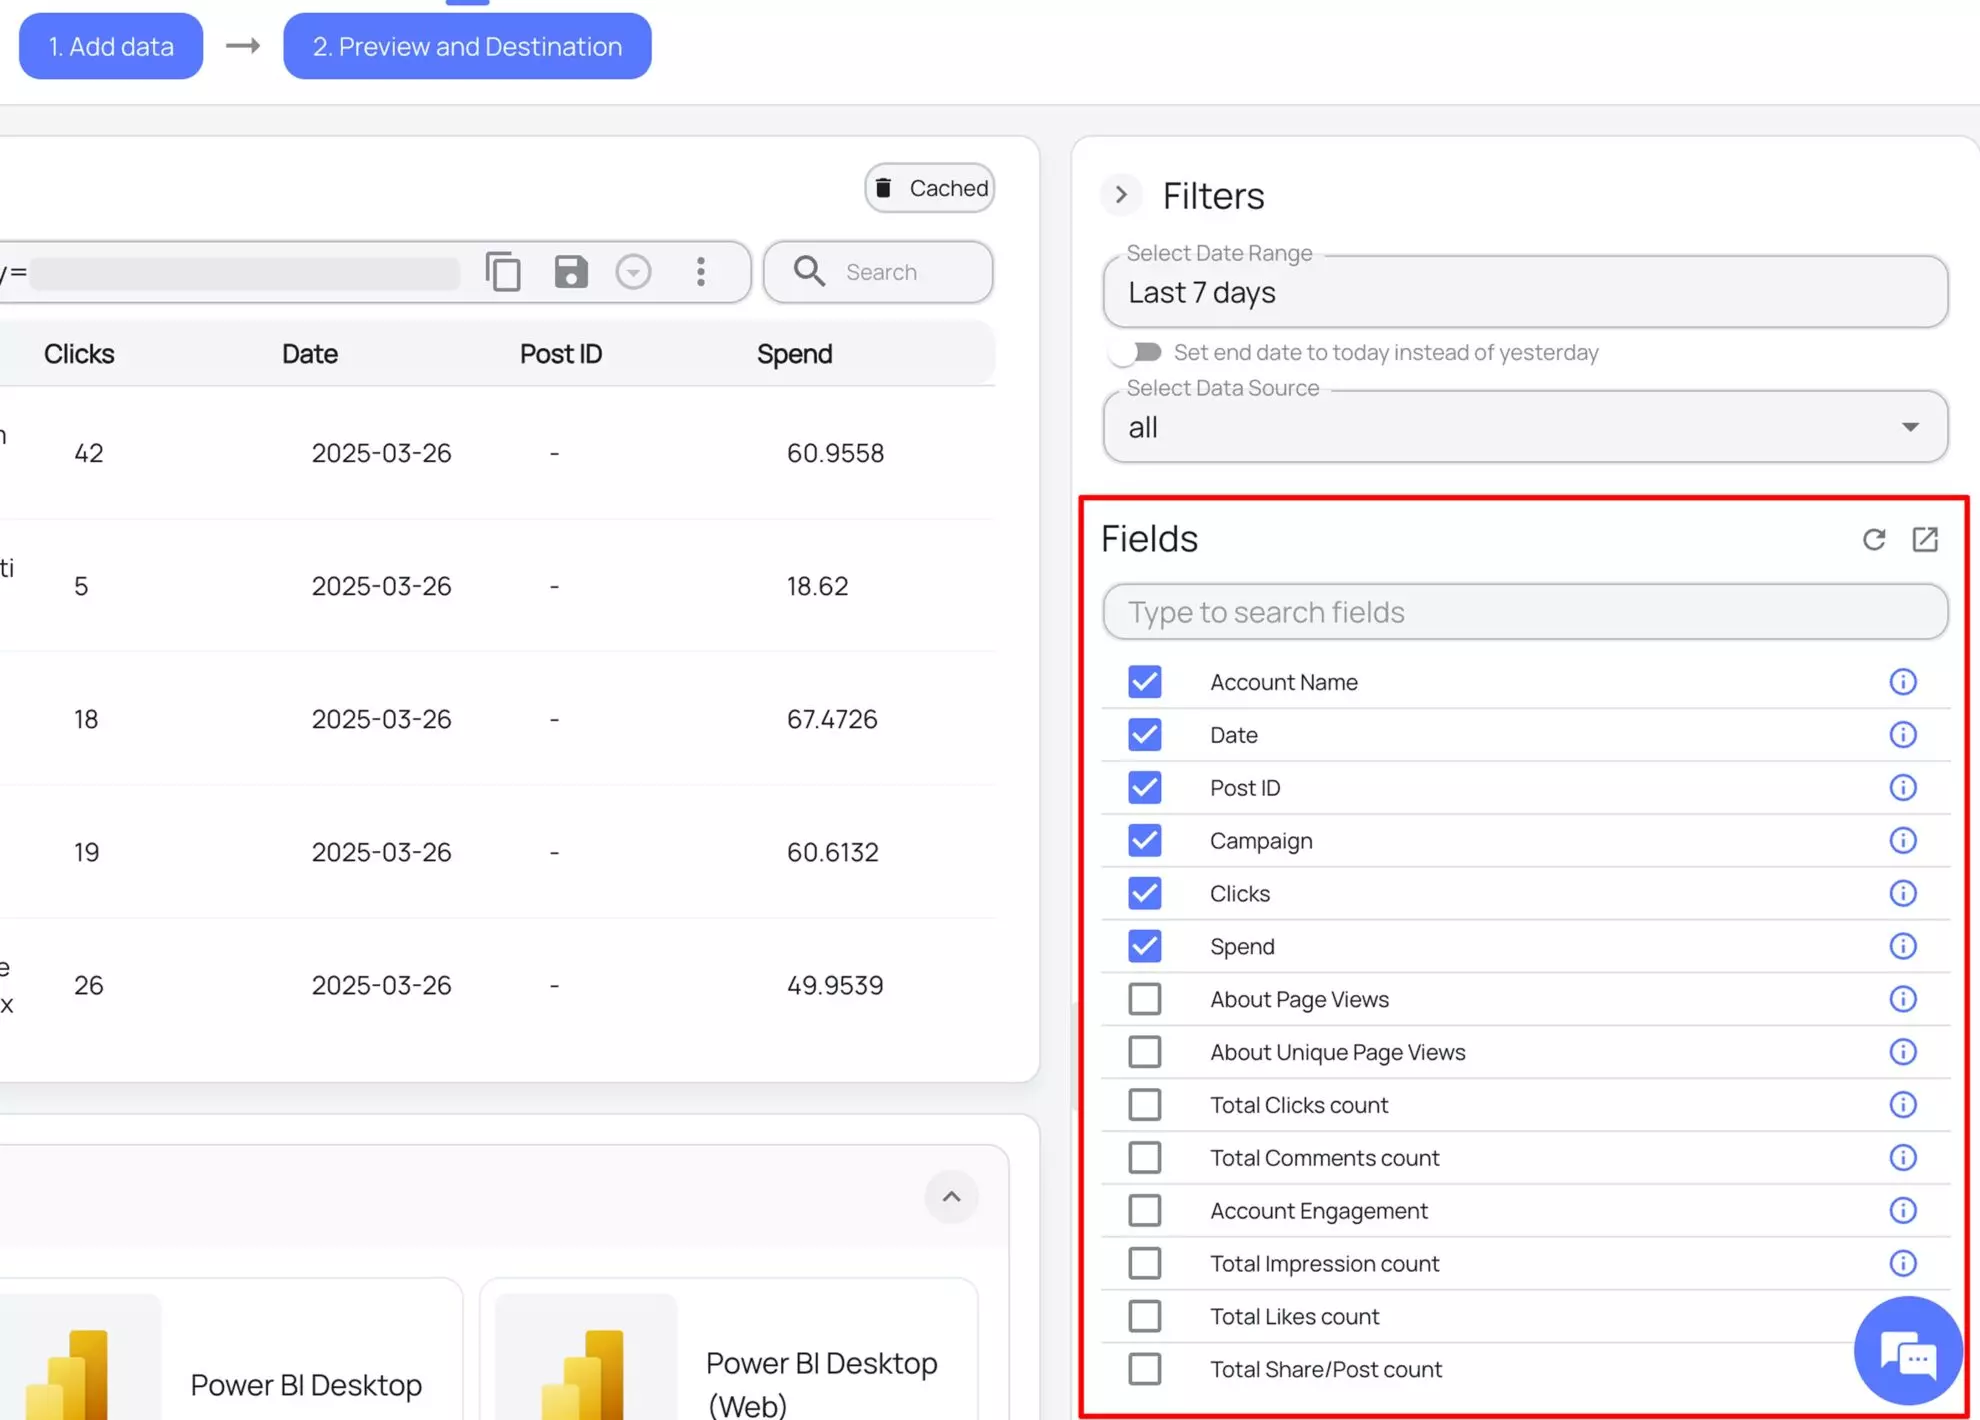
Select the reporting metrics and dimensions
Choose the Outbrain fields you want to import into Looker Studio on the right side.
Connect the Looker Studio connector and sync data
Select the Windsor.ai Outbrain Looker Studio Connector. Click “Authorize” and log in with your Windsor.ai credentials. You will be redirected to the Outbrain connector again. Choose your Outbrain account and click “Connect.” Then, click “Create Report.”

FAQs
What is Looker Studio?
Looker Studio is a free Google data visualization and business intelligence tool, bringing together data from multiple sources like CRMs, Google Analytics, marketing platforms, and spreadsheets to turn raw data into dynamic charts, graphs, and tables for detailed analysis. With Looker Studio and Windsor.ai integration, you can automate reporting, customize metrics to suit your business goals, track key performance indicators, and connect with other Google Cloud tools for enhanced analytical operations.
Do you have helpful links to get started with integrating Outbrain and Looker Studio using Windsor.ai?
Yes, we have helpful resources to help you get started. You can explore our official documentation and ready-to-use templates for seamless Outbrain to Looker Studio integration with Windsor.ai:
How much time do I need to create the Outbrain and Looker Studio integration?
Using Windsor.ai’s no-code ETL connector, you can integrate Outbrain with Looker Studio in a few minutes, benefiting from a quick and stress-free setup process.
How much does it cost to integrate Outbrain into Looker Studio with Windsor.ai?
Windsor.ai’s pricing for Outbrain to Looker Studio data integration can vary depending on your use case and data volume. We offer transparent pricing plans tailored to diverse business needs and budgets.
Tired of manual Outbrain data exports? Try Windsor.ai today to automate your reporting

